CORSIA Phase 1: Credits, Compliance, and What Comes Next
Key Takeaways
- CORSIA, the program intended to address international aviation emissions, is currently the world’s largest international compliance carbon market, with approximately 200 million tonnes of eligible emissions units (EEUs) expected to be retired for Phase 1 (2024-2026) compliance.
- Airlines have already begun retiring significant volumes of credits (clean cookstoves and jurisdictional REDD+) toward their Phase 1 obligations ahead of the January 2028 compliance deadline, signaling that the industry is treating CORSIA as a binding policy mandate.
- In addition to the four already approved, a record 25 carbon standards have applied for eligibility to supply credits under Phase 2 (2027–2035), pointing to a diversifying pipeline of credits.
- Legal enforcement of CORSIA at the national level remains uneven. A handful of jurisdictions, including the EU, Japan, Brazil, New Zealand, and Canada, have established compliance regimes, but it is unclear whether other major aviation markets will implement domestic enforcement requirements by 2027.
- As CORSIA matures alongside other compliance and voluntary frameworks, strategic engagement increasingly depends on understanding where eligibility overlaps and where the most value can be found.
Introduction to CORSIA
The Carbon Offsetting and Reduction Scheme for International Aviation (CORSIA) was established and is managed by the International Civil Aviation Organization (ICAO)—a specialized agency of the UN—and provides a compliance mechanism to reduce emissions from international aviation that do not fall within a single country’s contributions to the Paris Agreement. For years, CORSIA generated more commentary than activity—airlines weren’t required to offset a single tonne of CO2 emissions (tCO2) during the pilot phase (2021–2023). That is changing; in early 2026, Singapore Airlines and Japan Airlines retired significant volumes of carbon credits against their Phase 1 (2024–2026) obligations. Increasing authorization announcements showcase the eligible supply steadily entering the market, and 25 carbon standards have applied for Phase 2 (2027–2035) eligibility. As CORSIA becomes an active compliance market, this article explains how the program works, what is driving the current trends, and what to watch as Phase 1 draws to a close.
Who is Covered by CORSIA Phase 1 and Phase 2?
Because emissions from international aviation are not tied to any individual nation, the International Civil Aviation Organization (ICAO) adopted CORSIA in 2016 to complement the Paris Agreement framework and address these emissions. CORSIA applies to international airlines operating flights registered between participating countries.
- During Phase 1, offsetting obligations apply only to routes between the 130 countries that have voluntarily opted in.
- From Phase 2, participation becomes mandatory for all 193 ICAO member states, except for those below the aviation activity threshold or classified as Least Developed Countries, Small Island Developing States, or Landlocked Developing Countries—although they can voluntarily participate.
Several major aviation markets, including China, that are not participating in Phase 1 will be required to do so from 2027.
Offsetting Obligations
Airlines are required to offset the portion of their emissions that exceeds the program’s baseline on routes subject to offsetting. The key input is the annual Sectoral Growth Factor (SGF), which reflects how much annual emissions on covered routes have grown above the baseline (set at 85% of 2019 emissions). In simple terms, each airline's offsetting obligation is calculated by multiplying its CORSIA-regulated emissions by the SGF.
For example, an airline that emits 1 million tCO2 on covered routes in a year when the SGF is 10%, would have an offsetting obligation of 100,000 tCO2. An airline that emits 500,000 tCO2 in the same year would have an obligation of 50,000 tCO2. The actual 2024 SGF was 15.4%, exceeding the baseline and triggering offsetting obligations for the first time since the COVID-induced reduction in international aviation activity.
Beginning in 2033, CORSIA’s offsetting formula combined the SGF with an individual component that accounts for each airline's own emissions growth. The individual weighting starts at 15% in 2033 (with an SGF weighting of 85%) and rises to 45% by 2035 (SGF 55%). This progressively ties each airline’s obligations to its own emissions trajectory rather than sector-wide trends alone.
Airlines can also reduce their obligations by reporting the use of CORSIA Eligible Fuel (CEF). In order to qualify as CEF, Sustainable Aviation Fuel (SAF) must meet ICAO’s certification criteria. Offsetting remains a lower-cost option than sustainable fuel procurement, and CORSIA obligations are currently not influential drivers of CEF/SAF uptake compared to supply mandates, such as ReFuelEU Aviation. However, these dynamics will evolve as CORSIA matures and SAF prices continue to fall.
CORSIA Eligible Carbon Credits: Phase 1 and Phase 2
To determine the eligibility of carbon crediting standards and credits issued under those standards, ICAO's Technical Advisory Body (TAB) reviews applications and recommends approval to the ICAO Council, subject to restrictions on methodologies, vintages, and more granular project elements. Currently, no standard is approved without exclusions. Credits eligible for use under CORSIA are known as Eligible Emissions Units (EEUs).
TAB broadly excludes some project types across standards, including large-scale grid-connected renewable energy projects and most project-level REDD+ activities. The exclusions reflect TAB's assessments of baselines, safeguards, and quantification gaps. However, these assessments are not static; ICAO updates its determinations as the evidence base improves. For example, in 2025, TAB approved certain direct air capture (DAC) and biochar pathways for the first time.
A record 25 carbon standards—certifying projects from emissions avoidance to engineered carbon dioxide removal (CDR)—have applied for Phase 2 eligibility in the 2026 assessment cycle, reflecting the scale of the opportunity. The International Air Transportation Association (IATA) projected a demand of 170–236 million EEUs for Phase 1 alone; developers are eager to serve this growing market. Assessment results are expected in October 2026.
Article 6 and Corresponding Adjustments
The biggest bottleneck for eligible supply has been requirements relating to Article 6.2 of the Paris Agreement. CORSIA requires that EEUs carry a host country Letter of Authorization (LoA) confirming that the host country will not count the underlying mitigation toward its Nationally Determined Contribution (NDC). This prevents double counting between CORSIA and national emission inventories, but it also means eligible supply depends on host country authorization, not just meeting methodological requirements. Authorized credits are called Internationally Transferred Mitigation Outcomes (ITMOs).
To manage the risk that a host country fails to apply the promised corresponding adjustment, projects must secure legally enforceable insurance policies that either provide replacement EEUs or funds to secure them. Several providers have been approved to insure EEUs registered by Gold Standard and Verra.
Insurance requirements do not apply when the host country has already confirmed the corresponding adjustments in its mandatory Paris Agreement reporting. For example, in March 2026, Madagascar submitted a Biennial Transparency Report (BTR) and annual information report that reflect the application of corresponding adjustments to CORSIA-eligible clean cookstoves credits listed on the Verra registry. According to Verra, BTR accounting is the “highest level of assurance” that ITMOs will not be double counted.
The Enforcement Challenge
With the authorization bottleneck loosening, market attention is turning to demand. Critically, ICAO has no direct enforcement power; for CORSIA to work, participating countries must pass laws requiring airlines to comply with its requirements. Under CORSIA rules, airlines must retire their Phase 1 EEUs by January 2028, but most are not yet subject to legal sanctions for failing to comply. Where regulations do exist, it remains unclear whether penalties will be stringent enough to matter, or whether they will be enforced at all.
Where legal enforcement of offsetting requirements does exist, it varies by design. For example, in Brazil, failure to comply attracts a penalty of BRL 50/tCO2 (US$10/tCO2) and an administrative fine. Meanwhile, the Canadian Aviation Regulations impose administrative fines capped at CAD 25,000 (US$18,000) per infraction, but there is no specific fine for each tCO2 not offset. However, the absence of a statutory penalty framework does not necessarily mean compliance will not be enforced. For example, New Zealand manages CORSIA participation through an administrative Memorandum of Understanding with Air New Zealand, rather than a dedicated legal regime (though this will change from 2027). Similar informal arrangements may be more common than the legislative record suggests.
According to 2024 data, US-based airlines account for around 15% of CORSIA-covered emissions. However, there is no indication that the federal government will implement CORSIA penalties under the current administration. It is unclear how non-compliance by a major economy will impact market confidence or enforcement by other governments, but uncertainty about US participation in multilateral climate programs is not new.
What to Watch
- Global enforcement: As Phase 2 approaches, the prospects for CORSIA enforcement in key aviation markets will become clearer. China, which has not participated in the voluntary phase and has raised objections to CORSIA’s design on grounds of fairness, presents an uncertain picture for domestic transposition. The UK government has consulted on a draft legal amendment that would penalise non-compliance for UK airlines at £100/tCO2 (US$130/tCO2), but has not published updates since February 2025.
- EU Emissions Trading Scheme (ETS) update: In July 2026, the European Commission proposed to expand the ETS to address emissions from flights departing the European Economic Area (EEA) to destinations within 5,000 km. To avoid double charging emissions also regulated under CORSIA, the Commission proposed to deduct CORSIA costs from airlines’ ETS obligations. While the Commission flagged concern about the stringency of CORSIA eligibility criteria, the proposed rules would not impact demand for Phase 1 EEUs. Still, it is worth watching for future restrictions on which credits EU airlines can use for CORSIA, whether in Phase 1 or 2.
- Supply financing vehicles: The LEAF Coalition—which purchases credits verified under the CORSIA-eligible ART TREES standard—has signed over US$1.5 billion worth of purchase agreements with host countries. The Forest Carbon Partnership Facility (FCPF) and BioCarbon Fund Initiative for Sustainable Forest Landscapes (ISFL), both CORSIA-approved for Phase 1 in early 2026, have built jurisdictional REDD+ pipelines across dozens of countries. As projects mature, it will be worth watching how issued credits are marketed across compliance and voluntary channels.
Strategic Considerations
Avoided emissions credits dominate early CORSIA supply—and consequently demand—principally from avoided deforestation and clean cooking projects. As there is no regulatory premium for higher-cost CDR, this is not surprising. But as the market matures and supply diversifies, airlines are likely to begin differentiating on geography, co-benefits, and environmental performance. Corporate interest is growing in projects that abate non-CO2 superpollutants, due to their outsized near-term climate impact. As many of these projects are based in countries actively issuing LoAs, this may soon translate into a supply of superpollutant EEUs. Some airlines are reluctant to procure aggressively now, anticipating the upcoming availability of higher-quality credits.
Credits that hold value across multiple frameworks could carry a strategic premium. A credit also eligible for Singapore's carbon tax, Switzerland's CO2 Act, or SBTi claims may offer more durable demand than one tied to a single use case. While specific requirements vary significantly, we are beginning to see convergence around broad principles, such as the need for Article 6 authorization for credits used in compliance markets tied to NDCs. Procurement and project development strategies could begin to favour credits that confer wider market optionality.
The precondition for all of this is policy stability. Longer-term offtake agreements, portfolio strategies, and meaningful investment in project development depend on confidence that CORSIA rules will hold. Efforts to soften emissions regulations in response to energy price shocks are now testing this confidence, from proposed changes to soften the EU ETS to Singapore's deferral of its SAF levy. Tracking price signals, enforcement developments, and authorization trends will be essential for identifying firm demand and where the opportunities lie.
Conclusion
Effective engagement with CORSIA requires more than developing quality projects. It means understanding methodological eligibility requirements, navigating Article 6.2 authorization processes, tracking a network of overlapping national regulations, and staying ahead of a rapidly evolving market landscape. Relae (formerly Carbon Direct) brings together policy, market, and scientific expertise to help clients on all of these fronts.
Frequently Asked Questions
Which carbon credits can airlines use for CORSIA compliance?
CORSIA Eligible Emissions Units (EEUs) must be issued by crediting standards approved by ICAO's Technical Advisory Body. Every approved standard currently has exclusions on certain methodologies and project types, so eligibility is granular rather than blanket. EEUs must also have a host country Letter of Authorization confirming a corresponding adjustment under Article 6.2 of the Paris Agreement.
Is CORSIA actually enforceable?
In all phases, CORSIA obligations are legally binding when a country writes them into domestic law. Countries participating in Phase 1 are expected to do this, but not all have, and enforcement remains uncertain in several key aviation markets (e.g., the United States). Even where enforcement exists, penalty regimes vary significantly in stringency and design.
How does the July 2026 EU ETS proposal affect CORSIA?
The European Commission's proposal to expand ETS coverage to more flights does not reduce demand for CORSIA credits. While it would lead to overlap between flights covered under CORSIA and the ETS, as proposed, airlines could have CORSIA costs effectively deducted from their ETS allowance obligations. However, the Commission has signalled continued scrutiny of CORSIA's effectiveness, which could shape future limits on the credits EU airlines are allowed to use.
SAF
Relae helps SAF buyers, producers, and project developers navigate an increasingly complex market shaped by evolving regulation, voluntary standards, and feedstock sustainability expectations. We combine project-level diligence, market and policy intelligence, technical life cycle assessment, and commercial strategy to help you manage claims risk, capture green premiums, and scale high-quality SAF.
Sustainable Aviation Fuel Primer



Chimdi Obienu

Chimdi Obienu

Before Relae, Chimdi worked as the Carbon Markets Data and Policy Lead at EcoAct, where he built the knowledge management system covering policies such as CORSIA, Article 6 of the Paris Agreement, and the EU Green Claims Directive. As part of the Research and Innovation Team, he created tools to quantify the risk associated with regulatory mechanisms, such as CBAM and the EU Emissions Trading Scheme. Chimdi began his career in Washington DC advising clients on policy developments and technology innovation across the energy and transportation sectors.
Best Student, University of Sussex MSc in Energy Policy

Rory Jacobson

Rory Jacobson
Rory Jacobson is the Head of Policy at Relae. Previously, he served as the Director of the Carbon Dioxide Removal program within the Office of Fossil Energy and Carbon Management (FECM) at the U.S. Department of Energy (DOE). In previous roles at DOE, Jacobson has supported and coordinated FECM’s carbon removal and management programs and projects.
Prior to joining DOE, Jacobson was a Deputy Director of Policy at Carbon180, where he managed the federal policy portfolio for engineered carbon removal pathways. He has led carbon management research and analysis in multiple roles, including with the Natural Resources Defense Council and the World Resources Institute, and Relae. Jacobson received his master’s in environmental management from the Yale School of Forestry, where he was a Kerry Fellow.
Kerry Fellowship (2021-2022)
Yale Jackson School of Global Affairs
Secretary’s Honor Award (2023)
U.S. Department of Energy
What to Read Next
Decarbonizing Cement and Concrete: Are Their Emissions Set in Stone?
Key Takeaways
- Cement is the key ingredient in concrete and is responsible for more than 80% of concrete’s emissions. Cement’s GHG emissions are the primary technical challenge in decarbonizing an industry that accounts for over 8% of annual global greenhouse gas emissions.
- The global market for low-carbon concrete is constrained by the slow deployment of breakthrough technologies, yet demand from major buyers such as hyperscalers, developers, and infrastructure investors is accelerating. This mismatch between demand and supply is creating a new market mechanism: environmental attribute certificates (EACs) for building materials.
- EACs represent the climate benefits of low-carbon materials and can be traded separately from the physical product. These certificates, when backed by robust technical diligence, offer a near-term funding mechanism to accelerate decarbonization across the cement and concrete supply chain.
The AI Boom Meets an Industrial Reality
As the market for AI infrastructure expands, data center construction is accelerating—and with it, demand for concrete, one of the most carbon-intensive materials in the built environment. For both builders and material suppliers, the embodied carbon of cement and concrete is under a microscope due to its significant climate impact. Hyperscalers, like Microsoft and Meta, have 2030 targets that far outpace the concrete industry’s readiness to provide near-term low-emissions materials.
This piece explores why cement and concrete decarbonization is so challenging and how credible, high-quality EACs can help bridge the ambition gap.
Cement and Concrete: An Important Distinction
These two terms are often used interchangeably, but they are not the same—and the distinction matters for decarbonization strategy. Cement is the reactive ingredient in concrete, acting like an egg in a cake batter. Concrete itself is a blend of cement, aggregates (like sand and gravel), and water (the batter overall). While concrete is widely used and often seen as the emissions culprit, it is actually cement—just 15% of the mix by volume—that is responsible for more than 80% of concrete’s lifecycle carbon emissions.
Why Is Concrete so Hard to Decarbonize?
Concrete is the second most-used material on Earth after water. Despite emitting only ~0.13 kg of CO₂ per kilogram, its sheer scale gives it an outsized climate impact—contributing around 8% of global CO₂ emissions. Yet decarbonization has been slow, held back by technical, structural, and accounting challenges across a complex supply chain.
The Supply Chain Behind Concrete’s Carbon Footprint
To understand why decarbonizing concrete is so difficult, it’s essential to understand how it’s made and what drives its emissions. Three factors explain much of the difficulty:
- Cement is made in an emissions-intensive process. Cement is produced by heating limestone to extreme temperatures (~1450 °C) to create clinker, a reactive material that binds sand and aggregates into concrete. This energy and carbon-intensive process is where the majority of the emissions occur.
- Concrete is made to order. Concrete is a blend of cement, aggregate, and water. It is made to order at local batch plants and poured on-site or used in precast molds, with mix designs tailored to specific compressive strength and durability requirements.
- The supply chain is decentralized and performance-driven. Because concrete mixtures must meet application-specific performance requirements, low-carbon innovations are limited to those that do not decrease product quality and performance at any point in the value chain.
This layered supply chain, from kiln to batch plant to job site, means decarbonization strategies must be compatible with local infrastructure, material availability, and performance needs. There is no single lever to pull.
Clinker Is the Main Emissions Driver
Clinker production alone accounts for the majority of cement’s emissions, due to the chemical process (calcination) that converts limestone into lime and releases CO2. Not only does calcination directly produce CO2, but the combustion of fossil fuels used to heat the kiln adds to the emissions of the overall process.
Low-Carbon Concrete Technology: Invented, Not Yet Deployed
Six promising technologies are in development to address cement and concrete emissions, including:
- Carbon Capture and Storage (CCS): CCS can be retrofitted to capture the fuel and process emissions from clinker production, delivering nearly complete decarbonization of the cement manufacturing process. CCS can be combined with electrification or fuel switching to deliver deeper decarbonization
- Supplementary cementitous materials (SCMs): SCMs offer two key benefits: they can partially replace conventional cement in concrete mixtures, and certain SCMs react with CO₂ from industrial or atmospheric sources to enable durable carbon storage.
- Electrification: Electrifying kiln heating systems can reduce emissions from fossil fuel combustion during clinker production. When powered by low-carbon electricity, this approach lowers the carbon intensity of cement manufacturing while maintaining the high temperatures required for clinker formation.
- Fuel Switching: Natural gas, biomass, and renewable natural gas are low carbon-intensity fuels that can replace the higher-emitting coal and refuse derived fuel that usually drive the clinker production process. Unlike electrification, some alternative fuels can be used as 'drop-in' replacements in existing equipment.
- Synthetic and recycled aggregates: Alternatives to traditional gravel and crushed stone, made from waste materials or industrial byproducts, which can lower emissions and reduce resource extraction.
- CO2 curing: A process where concrete is cured with captured CO2 instead of air, helping lock carbon into the material and partially offsetting upstream process emissions.
Each solution faces deployment challenges, from raw material availability and geographic constraints to cost, performance certification, and integration with legacy infrastructure.
Few decarbonization strategies have reached industrial scale today, but these strategies are being piloted and demonstrated, and given targeted support, some have the potential to significantly decarbonize the future of the industry.
The Gap Between Targets and Real Market Capacity
Hyperscalers, utilities, real estate developers, and other large organizations with ambitious scope 3 targets are looking to significantly reduce the embodied carbon throughout their supply chain. However, the current supply of deeply decarbonized cement and concrete is insufficient to support these targets through direct procurement alone; the low-carbon material simply does not exist at the required volume or in the right geographies. In some cases, pilot plants produce too little material to meet large-scale demand, while projects capable of larger volumes may not yet be located in regions where interested buyers are concentrated.
In this context, EACs offer a flexible mechanism to fund innovation and bridge the gap. By unbundling climate attributes from physical materials, near-term obstacles, such as geographic availability, can be overcome while channeling capital toward scalable and catalytic solutions.
When backed by rigorous life cycle assessments and high-quality, transparent traceability standards, EACs can provide the financial bridge for truly innovative suppliers to invest in the capital solutions required to decarbonize cement and concrete. EACs can serve a catalytic role to support scalable strategies and help ensure that first-of-a-kind facilities are built, and direct procurement of low-carbon concrete is increasingly feasible in the years to come.
How Environmental Attribute Certificates Work in Cement and Concrete Markets
EACs translate emissions reductions from low-carbon cement and concrete production into climate attributes that can be purchased separately from the physical material. Instead of requiring buyers to procure low-carbon concrete directly from a specific supplier site, EACs allow the climate benefit associated with that production to be transacted independently through a book and claim model.
In practice, a producer implements a verified emissions reduction intervention, such as reducing clinker content through supplementary cementitious materials, installing carbon capture at a kiln, or deploying alternative cement chemistries. The resulting emissions reductions are quantified through life cycle assessment and product-level disclosures such as Environmental Product Declarations. Verified reductions can then be converted into certificates representing the climate benefit of that lower-emissions production.
Buyers can purchase these certificates to support the deployment of low-carbon cement and concrete technologies while making progress toward embodied carbon reduction targets. In this way, EACs provide an early demand signal and a revenue stream that can help producers finance capital-intensive decarbonization investments across the cement and concrete supply chain.
What This Means for Suppliers and Buyers
Whether you are procuring concrete or producing it, EACs are only one part of a broader decarbonization strategy. Navigating this space requires decisions at the intersection of technical feasibility, GHG accounting, and capital strategy. Key considerations include:
- GHG accounting and reportability: Life cycle assessments, Environmental Product Declarations, and other product-level attributes must be tracked and transacted with high integrity. Buyers should report their EAC activities responsibly, especially in the current absence of formal standards and guidance.
- Procurement alignment: EAC buyers must ensure purchased certificates reflect equivalent performance grade materials to what was directly procured for structural applications.
- Monetization pathways: Book-and-claim EAC models offer producers a way to fund capital-intensive decarbonization upgrades while giving buyers a credible way to meet interim scope 3 goals. EAC transactions can take many forms and should be designed thoughtfully to minimize risks such as double counting.
Frequently Asked Questions
What is low-carbon cement, and how does it work?
Low-carbon cement reduces emissions by replacing traditional clinker with supplementary cementitious materials (SCMs), switching to cleaner fuels, electrifying kilns, or capturing CO₂ at the point of production. Because cement is responsible for more than 80% of concrete's lifecycle emissions, interventions targeting clinker production deliver the greatest climate impact. Most approaches are technically proven at smaller scales but have not yet reached the industrial volumes needed to meet mainstream demand.
How do EACs for cement and concrete compare to direct procurement of low-carbon materials?
Direct procurement means physically buying low-carbon concrete from a supplier, which requires that product to exist at conditions that often can not be met today. EACs decouple the climate benefit from the physical material, allowing buyers to fund verified emissions reductions across the supply chain even when direct sourcing isn't feasible. Both approaches can count toward scope 3 targets, but EACs offer more flexibility in the near term while the low-carbon materials market matures.
Is low-carbon concrete proven and available at scale today?
The core technologies for decarbonizing cement and concrete are technically demonstrated, but most have not reached commercial scale. Supply is geographically concentrated and insufficient to meet the volume demands of large buyers like hyperscalers, utilities, and real estate developers. This gap between technical readiness and market availability is precisely what makes EACs a valuable bridging mechanism right now.
What should a company look for when evaluating EACs for cement and concrete?
High-quality EACs should be backed by rigorous life cycle assessments and transparent traceability standards that tie the certificate to a specific, verifiable emissions reduction intervention. Buyers should also confirm that the certificates represent materials with equivalent performance grades to what they are directly procuring for structural applications, and that accounting practices minimize risks like double counting. Working with a technically credible advisor to evaluate EAC quality is essential, since the market currently lacks formal standards and guidance.
How Relae Can Help Decarbonize Cement and Concrete
Decarbonizing cement and concrete is both a technical and a strategic challenge. Relae brings integrated expertise across geochemistry, life cycle assessment, carbon accounting, and industrial decarbonization strategy to help buyers and producers navigate the complex path to decarbonization. Relae works directly with producers developing low-carbon cement and concrete technologies and with global buyers seeking credible pathways to address embodied emissions in construction. Our team combines industrial decarbonization engineering, geochemical expertise, and carbon accounting to evaluate emerging EAC frameworks and ensure they deliver real climate impact.
- EAC advisory for buyers: Relae helps buyers procure high-quality EACs through criteria development and in-depth technical diligence of EAC offerings across a range of low-carbon commodities, supporting purchased certificates that reflect genuine, verifiable climate impact.
- EAC advisory for suppliers: Relae helps producers design high-quality EAC interventions and assess potential EAC claims throughout the supply chain, informed by technical assessment, book-and-claim systems, and market landscaping.
- For both: Relae’s levelized cost of carbon abatement tooling provides custom modeling to assess trade-offs across cement and concrete decarbonization pathways, helping ensure that every dollar of climate spend goes further.
The Sustainable Aviation Fuel Cost Premium Is Permanent
Key Takeaways
- Sustainable aviation fuel (SAF) will not reach price parity with fossil jet fuel under any realistic near-term scenario. The cost premium is structural—rooted in the chemistry of feedstocks—not a temporary artifact of early-stage markets.
- Neither airlines nor corporate buyers are purchasing SAF for its energy content. Both are buying sustainability claims: airlines for regulatory compliance and scope 1 credentials, corporates for scope 3 emissions reporting and social license to operate. The fuel is incidental to both transactions.
- Corporate offtakes can play a genuine role in building the SAF industry, but only if they create capacity that would not otherwise exist. Additionality is not a technicality; it is the entire value proposition.
- High-integrity SAF procurement requires evaluating not just carbon reduction, but feedstock sourcing, leakage, and social and environmental harms. The newly released Criteria for High-Quality Low Carbon Fuels from Relae (formerly Carbon Direct) provides a framework for doing this rigorously.
A Major Deal Illustrates How the SAF Market Really Works
On June 5, 2026, Google and American Airlines announced a three-year agreement under which Google will purchase sustainable aviation fuel (SAF) certificates (SAFc) associated with 35 million gallons of SAF. American will take physical delivery of the fuel at Chicago O'Hare. Google receives the emissions attributes. The arrangement relies on book-and-claim accounting, in which the physical fuel and the environmental attribute are legally separated and transferred to different parties.
The deal is a window into how the SAF market works, and what every company in the value chain needs to understand before entering it.
The SAF Cost Premium Is Structural, Not a Market Inefficiency
There is a persistent hope in the aviation industry that SAF will eventually reach price parity with fossil jet fuel. This will not happen, at least not through any mechanism that currently exists or is credibly in development.
The economics are the product of thermodynamics. Petroleum is pre-deoxygenated; over millions of years, heat and pressure stripped oxygen from biological material, concentrating energy into the hydrocarbons we pump out of the ground today. Bio-based SAF feedstocks, e.g., vegetable oils, agricultural residues, and other biomass, are oxygen-rich (carbohydrates, not hydrocarbons). Power-to-liquid e-fuels start from captured CO₂, which is fully oxidized.
Either way, every SAF production pathway must pay an energy debt to remove or chemically reduce that oxygen, in the form of hydrogen deoxygenation, energy inputs, and processing costs. This is not a manufacturing inefficiency that scale will solve. It is a constraint baked into the feedstocks themselves.
The numbers reflect this. According to the European Union Aviation Safety Agency (EASA), the average market price of SAF in 2025 was approximately €1,925 per tonne, roughly three times the €640 per tonne average for conventional jet fuel.
The cheapest pathway, hydroprocessed esters and fatty acids (HEFA), produced from waste oils like used cooking oil or tallow, represents almost all current SAF supply and sits at the lower end of the SAF cost range. Costlier cellulosic and e-fuel pathways push it higher. EASA estimates 2025 production costs for power-to-liquid e-fuels at €7,520 per tonne, more than ten times the cost of conventional kerosene. While these costs can and will come down, none are expected to approach price parity.
The feedstock ceiling compounds this. HEFA from waste oils is the cheapest SAF pathway, but waste oil supply is finite and competes with renewable diesel, which typically offers better margins for producers. As mandates push SAF volumes beyond what HEFA can supply, the industry must move to cellulosic biomass or power-to-liquid pathways, at progressively higher cost. Scaling the SAF industry does not automatically bring prices down. In the near term, it pushes them up.
Policy Determines Who Absorbs the Cost
If price parity is not coming, the cost premium lands somewhere. Two policy philosophies have emerged to answer that question.
Europe has largely adopted the polluter-pays principle: SAF mandates place the cost burden on fuel suppliers and, by extension, on airlines and their passengers. The EU's ReFuelEU Aviation regulation and the UK's SAF mandate both carry steep penalties for non-compliance. As Relae has documented, in the UK, those penalties range from three to 13 times the cost of compliance, depending on the obligation type and year, signaling that regulators are serious about pushing aviation toward sustainable fuels.
The United States approached the problem differently, leaning on taxpayer subsidies.The Inflation Reduction Act (IRA) 45Z Clean Fuel Production Credit and its predecessor, the 40B Sustainable Aviation Fuel Credit sought to socialize much of the cost premium. The appeal of this approach was that it made SAF economics viable without raising ticket prices. Its vulnerability was political: when the IRA's incentive landscape was revised, the project pipelines that had formed around those credits evaporated quickly. US taxpayer-funded support proved politically less durable than the UK and EU’s mandated compliance obligations.
Neither model works in isolation. Mandates without bankable project finance generate demand signals but no new supply. Incentives without policy durability attract project interest but cannot get facilities to final investment decisions. The deals that have actually moved capital combine a stable policy floor, whether mandate or incentive, with long-term private commitments that provide the revenue certainty project finance requires.
The Google-American Airlines deal illustrates the incentives-plus-private-commitment structure. The deal explicitly credits the Illinois SAF tax credit as the enabling policy lever. HEFA SAF of this type is eligible to generate Renewable Fuel Standard credits (RINs), and fuel produced from 2025 onward qualifies for the IRA's 45Z Clean Fuel Production Credit. This stack provides additional floor economics. The corporate offtake completes the structure by delivering the revenue certainty that volatile policy credits alone cannot. Remove any one of those elements and the deal's economics likely do not hold.
Nobody in this Market Is Buying SAF for its Energy Content
This is the key to understanding how the SAF market works. Neither airlines nor corporate buyers purchase SAF for its energy content. Airports have kerosene. Airlines do not need SAF to keep planes in the air. Corporate buyers, like Google, have minimal operational use for aviation fuel at all. While recent global disruptions in crude oil supply have highlighted SAF in the context of energy security, the industry as it exists today does not represent a realistic hedge against conventional fuel volatility.
What all parties are buying is the sustainability attribute attached to the fuel. For airlines, the relevant claim is a scope 1 emissions reduction: the right to report lower lifecycle carbon intensity for their flight operations. For corporate buyers, the relevant claim is a scope 3 reduction, a documented abatement of the emissions associated with their employees' business travel. Book-and-claim accounting makes this architecture explicit: it legally severs the physical fuel from the environmental attribute, allowing each to be transferred to the party that values it. The fuel is the delivery mechanism for the claim.
This distinction matters for assessing the market. Airlines operate on among the lowest margins of any major industry. They cannot absorb the cost premium voluntarily without fundamentally compromising their finances. They participate in SAF markets when required to by mandate, or when a corporate partner subsidizes the premium by purchasing certificates downstream. The cost premium does not disappear; it shifts. Understanding where it lands is the starting point for any serious procurement decision.
Corporate climate programs have finite budgets. SAF competes with renewable electricity procurement, fleet electrification, CO2 removal, and supply chain decarbonization for the same dollars. Buyers who want their sustainability claims to match the actual sources of their emissions (rather than offsetting aviation with unrelated activities elsewhere) have a genuine reason to prefer SAF.
A SAF Claim Is Only as Strong as the Quality Behind it
SAF buyers and sellers trade sustainability claims. The quality of those claims is the entire value proposition, and the reputational liability travels with them. The companies with the greatest willingness to pay for SAF certificates tend to be those with the most brand exposure: high-profile technology companies, professional services firms, and financial institutions. These are also the companies most likely to face scrutiny from regulators, NGOs, and investors if a claim does not hold up. Buying a certificate does not protect a company from that scrutiny. It transfers the liability along with the attribute.
That means a rigorous buyer needs to answer at least three distinct questions before relying on a SAF claim.
- Does this fuel actually reduce lifecycle emissions?
SAF's climate case rests on a carbon cycle argument: the feedstock absorbs CO₂ from the atmosphere as it grows, so when that carbon is released during combustion, the net addition to the atmosphere is theoretically near zero. But that logic holds only if upstream production is clean, and it often is not.
Indirect land use change (when demand for a feedstock crop displaces food agriculture elsewhere, triggering clearing of forests or grasslands) can generate substantial emissions elsewhere in the global land and food system, eroding or eliminating the lifecycle benefit. Even waste-based feedstocks are not automatically clean: used cooking oil and tallow have existing market uses, and diverting them without careful accounting can displace those uses, alter commodity markets, and create emissions leakage elsewhere.
- Is the purchase additional?
Additionality asks whether the procurement caused SAF to exist that otherwise would not have. This is a harder question than it appears, especially in markets where multiple policy support mechanisms are already active. For the Google-American Airlines deal, one critical variable for financial additionality—the SAFc price—has not been disclosed. If Illinois credits and federal RINs already cover most of the HEFA cost premium, then the question of what Google's purchase actually caused to happen is genuinely open. However, American Airlines has stated publicly that the long-term nature of the agreement enabled them to secure a new SAF offtake with Valero Marketing and Supply Company. The supply arrangement that may not have been bankable on the basis of volatile RIN markets and changeable policy alone. That is a real additionality argument. But it requires transparency to evaluate. The undisclosed SAF credit price is a current market liability, not just in this deal, but across the voluntary SAF market broadly.
Long-term offtakes do something that policy credits cannot: they provide stable, bankable revenue certainty. RIN prices fluctuate. Tax credits change with administrations. Neither can reliably anchor a final investment decision at the project level. A multi-year, creditworthy offtake agreement can. This is the distinctive and genuinely valuable role that corporate buyers play in this market: not paying the cost premium per gallon, but reducing the financial risk premium that keeps capital on the sidelines.
- Is the full supply chain sound?
Carbon claims are not the only dimension of sustainability that matters to a buyer's reputation. Companies making claims about their SAF procurement are implicitly making claims about their supply chains. That means labor practices, community impacts, Indigenous rights, feedstock sourcing integrity, and market leakage from displaced uses all fall within the scope of what a rigorous buyer should evaluate. A SAF supply chain that displaces food crops, harms a proximate community, or causes deforestation through indirect land use change creates a reputational problem that no certificate can fix.
What High-Integrity SAF Procurement Looks Like
The voluntary SAF market is still early, and the transparency it requires does not yet exist consistently. Relae recently released the Criteria for High-Quality Low Carbon Fuels, a comprehensive, publicly available framework designed to help close that gap.
The criteria address six principles across the full supply chain: carbon accounting, additionality, feedstock sourcing, leakage, environmental harms, and social harms and environmental justice. They are designed as a practical reference for what a credible SAF claim requires, and where existing certifications may leave gaps that require additional diligence.
At the transaction level, five questions should have clear answers before any buyer signs an offtake:
- Is the certificate linked to a specific project or supply agreement?
- Is that project financially dependent on the offtake, after accounting for all policy support already in the stack?
- Is the lifecycle emissions profile documented across the full well-to-wheel boundary, including indirect effects?
- Are the feedstock sourcing and supply chain risks assessed and disclosed?
- Has the producer evaluated leakage and community impacts?
The Google-American Airlines deal demonstrates what serious voluntary SAF procurement can look like. The Criteria for High-Quality Low Carbon Fuels provides the framework buyers need to evaluate deals like this one rigorously.
Steel Decarbonization: How EACs Scale Low-Carbon Production by 2030
Key Takeaways
- Decarbonizing steel is key to meeting ambitious climate targets in the face of rapidly expanding AI infrastructure as well as broader infrastructure growth.
- The gap between corporate climate ambitions and near-term commercial reality is widening. Despite strong demand signals from hyperscalers and other major buyers, leading producers have recently canceled or delayed flagship green steel projects, citing high energy costs, slow hydrogen market development, and unfavorable policy environments.
- Bridging this gap requires significant capital investment and supporting mechanisms to scale low-carbon technologies. Environmental attribute certificates offer an effective mechanism to channel capital toward transformative, low-carbon steel projects, supporting technology scale-up, as well as providing a way for buyers to meet their emissions reduction targets.
- To protect the credibility of environmental attribute certificates as a market mechanism for decarbonization, projects should seek to meet rigorous quality criteria such as additionality, verifiability, and catalytic impact.
Forging New Climate Ambitions for Steel Production
Decarbonizing steel production is essential to meet global climate targets. Steel production accounts for approximately 7–9% of global CO2 emissions. This is driven chiefly by coal-based primary steelmaking, which still accounts for the majority of global production. Globally, at least 1.8 billion tonnes of crude steel were produced in 2025 to serve a broad array of industries including real estate, infrastructure, automotive, and data center construction.
As hyperscalers race to build the infrastructure underpinning the AI revolution, steel demand for data center construction, and associated energy infrastructure, is increasing. While the relative share of data center demand for steel versus global steel demand is small, the need for approximately 20,000 tonnes of steel per data center has a material impact on hyperscaler’s public climate commitments. Microsoft, Meta, and other large technology companies have set ambitious 2030 climate targets that include their scope 3 emissions. The embodied carbon of the steel used to build their data centers sits squarely in scope 3.
Hyperscaler’s climate commitments have generated sector-specific demand for decarbonized steel, presenting an opportunity to affect steel decarbonization more broadly. Despite this demand, the supply of low-carbon steel remains limited. The industry faces significant scale-up challenges due to the diffuse nature of demand and the nascent market. Catalyzing growth in decarbonized steel production will require market innovations and new production pathways designed to overcome these challenges. Credible environmental attribute certificates can help bridge the gap between today’s market and tomorrow’s low-carbon steel sector.
What is an Environmental Attribute Certificate?
An environmental attribute certificate (EAC) represents the environmental attributes of a product that can be unbundled and transacted separately from the underlying physical commodity. The most widely used EACs today are renewable energy certificates (RECs), which track the environmental attributes of renewable electricity. The same concept can also be applied to steel and iron, as well as to materials such as cement and concrete.
In a book and claim model, a steel producer can implement a verified emissions reduction intervention, quantify the resulting lowered carbon intensity per tonne of steel produced, and convert that into tradeable certificates. Buyers can then purchase those certificates to support the deployment of low-carbon steelmaking capacity in cases where direct procurement of low-carbon steel is currently impractical due to geographic, contracting, or scheduling incompatibilities.
EACs are distinct from carbon credits. They do not represent emissions reduced or avoided relative to a counterfactual; they represent the intrinsic carbon intensity of the material produced, measured through a life cycle assessment.
Decarbonizing Steel Requires Significant Capital and Infrastructure Deployment
Steel Production Today
Steel is currently made via three main production routes. About 71% of the world’s steel is produced through the blast furnace–basic oxygen furnace (BF-BOF) route, which emits an average of 2.33 tonnes of carbon dioxide (tCO2) per tonne of crude steel. A further 24% is produced using scrap-based electric arc furnaces (EAFs), which emit 0.68 tCO2 per tonne on average—far lower, but still dependent on the carbon intensity of grid electricity. The remaining roughly 5% uses direct reduced iron combined with an EAF (DRI-EAF), typically using natural gas, emitting 1.37 tCO₂ per tonne on average.
While increasing scrap-based production is a critical decarbonization lever, scrap availability is limited. Primary steel production, which uses iron ore as the main feedstock rather than recycled scrap, will remain necessary at large volumes through 2050. This makes it essential to decarbonize ore-based pathways, especially ironmaking: the step where iron ore is reduced to iron and where most emissions occur.
Decarbonizing ore-based steel production requires one of three fundamental interventions: (1) replacing coal and natural gas with low-carbon fuels such as hydrogen or bio-coke, (2) electrifying ironmaking directly, or (3) capturing and storing the CO2 generated from fossil-fuel-based processes. All three involve significant capital expenditure and dependencies on infrastructure that is not yet in place at the necessary scale. As a result, the energy and cost challenge is substantial.
Low-Carbon Steel: Emerging Pathways
A range of transformative technological pathways are currently in development to overcome these barriers, offering the potential to deliver deep decarbonization to the steel industry exceeding 90% by 2050:
- Hydrogen-based DRI-EAF: Using green hydrogen instead of natural gas within the DRI process provides a pathway to significantly lower the carbon intensity of ironmaking. Producers such as Stegra are deploying commercial-scale facilities designed to utilize 100% green hydrogen to reduce iron ore.
- Electrifying ironmaking:
- Molten oxide electrolysis: Boston Metal is commercializing a process that uses electricity to directly convert iron ore to molten metal through electrolysis at high temperature, eliminating the need for hydrogen or carbon reductants entirely.
- Low-temperature electrowinning: Colorado-based startup Electra uses renewable electricity to extract iron from ore via an aqueous electrochemical process that operates at near-ambient temperature.
- Carbon capture and storage (CCS): For blast furnaces and DRI plants with long remaining lifetimes, retrofitting with CCS technology can significantly reduce emissions. With new high-emitting capacity still being built, and assets expected to operate for decades, integrating CCS will be essential to avoid long-term carbon lock-in and to decarbonize these facilities over time. To date, commercial-scale deployment remains limited. The Al Reyadah facility at Emirates Steel is the only project currently capturing CO2 from a DRI process at scale, though a handful of other large-scale projects have entered the development pipeline.
Progress and Setbacks: A Mixed Picture
The past year sent contradictory signals about the pace of steel decarbonization. On the demand side, technology companies with ambitious climate targets are actively signaling their intent to procure near-zero steel and support its development.
In September 2025, Microsoft and Stegra announced a landmark agreement that combines a physical supply deal for low-carbon steel with a separate EAC purchase agreement. Around the same time, Meta announced an agreement with Electra to purchase EACs tied to the startup’s clean iron production, becoming one of the first buyers to use the EAC model for an entirely novel, pre-commercial ironmaking technology. Nucor, the largest US steelmaker, also entered into a physical iron purchase agreement with Electra.
Despite these demand signals, the industry has experienced significant setbacks. A series of low-carbon steel project cancellations and delays has raised questions about the pace and viability of the steel transition, especially due to the high costs associated with green hydrogen production.
At present, the green premium for most low-carbon steel remains too high for buyers. A combination of sustained policy support, long-term demand signals from buyers willing to pay more, and scaling of supporting industries, such as green hydrogen production, is necessary for the low-carbon steel industry to be successful in the long run.
How EACs Can Bridge the Funding Gap in Steel
EACs unbundle low-carbon steel attributes from the physical material, reducing the friction between buyers who are willing to pay a green premium and geographic or logistical constraints that may inhibit physical offtake. Buyers, such as hyperscalers procuring conventional steel for data center construction in locations where low-carbon steel is not yet available, can purchase these certificates to support the development of low-carbon capacity, attribute lower-carbon production to their steel use via a market-based mechanism, and advance toward their scope 3 targets.
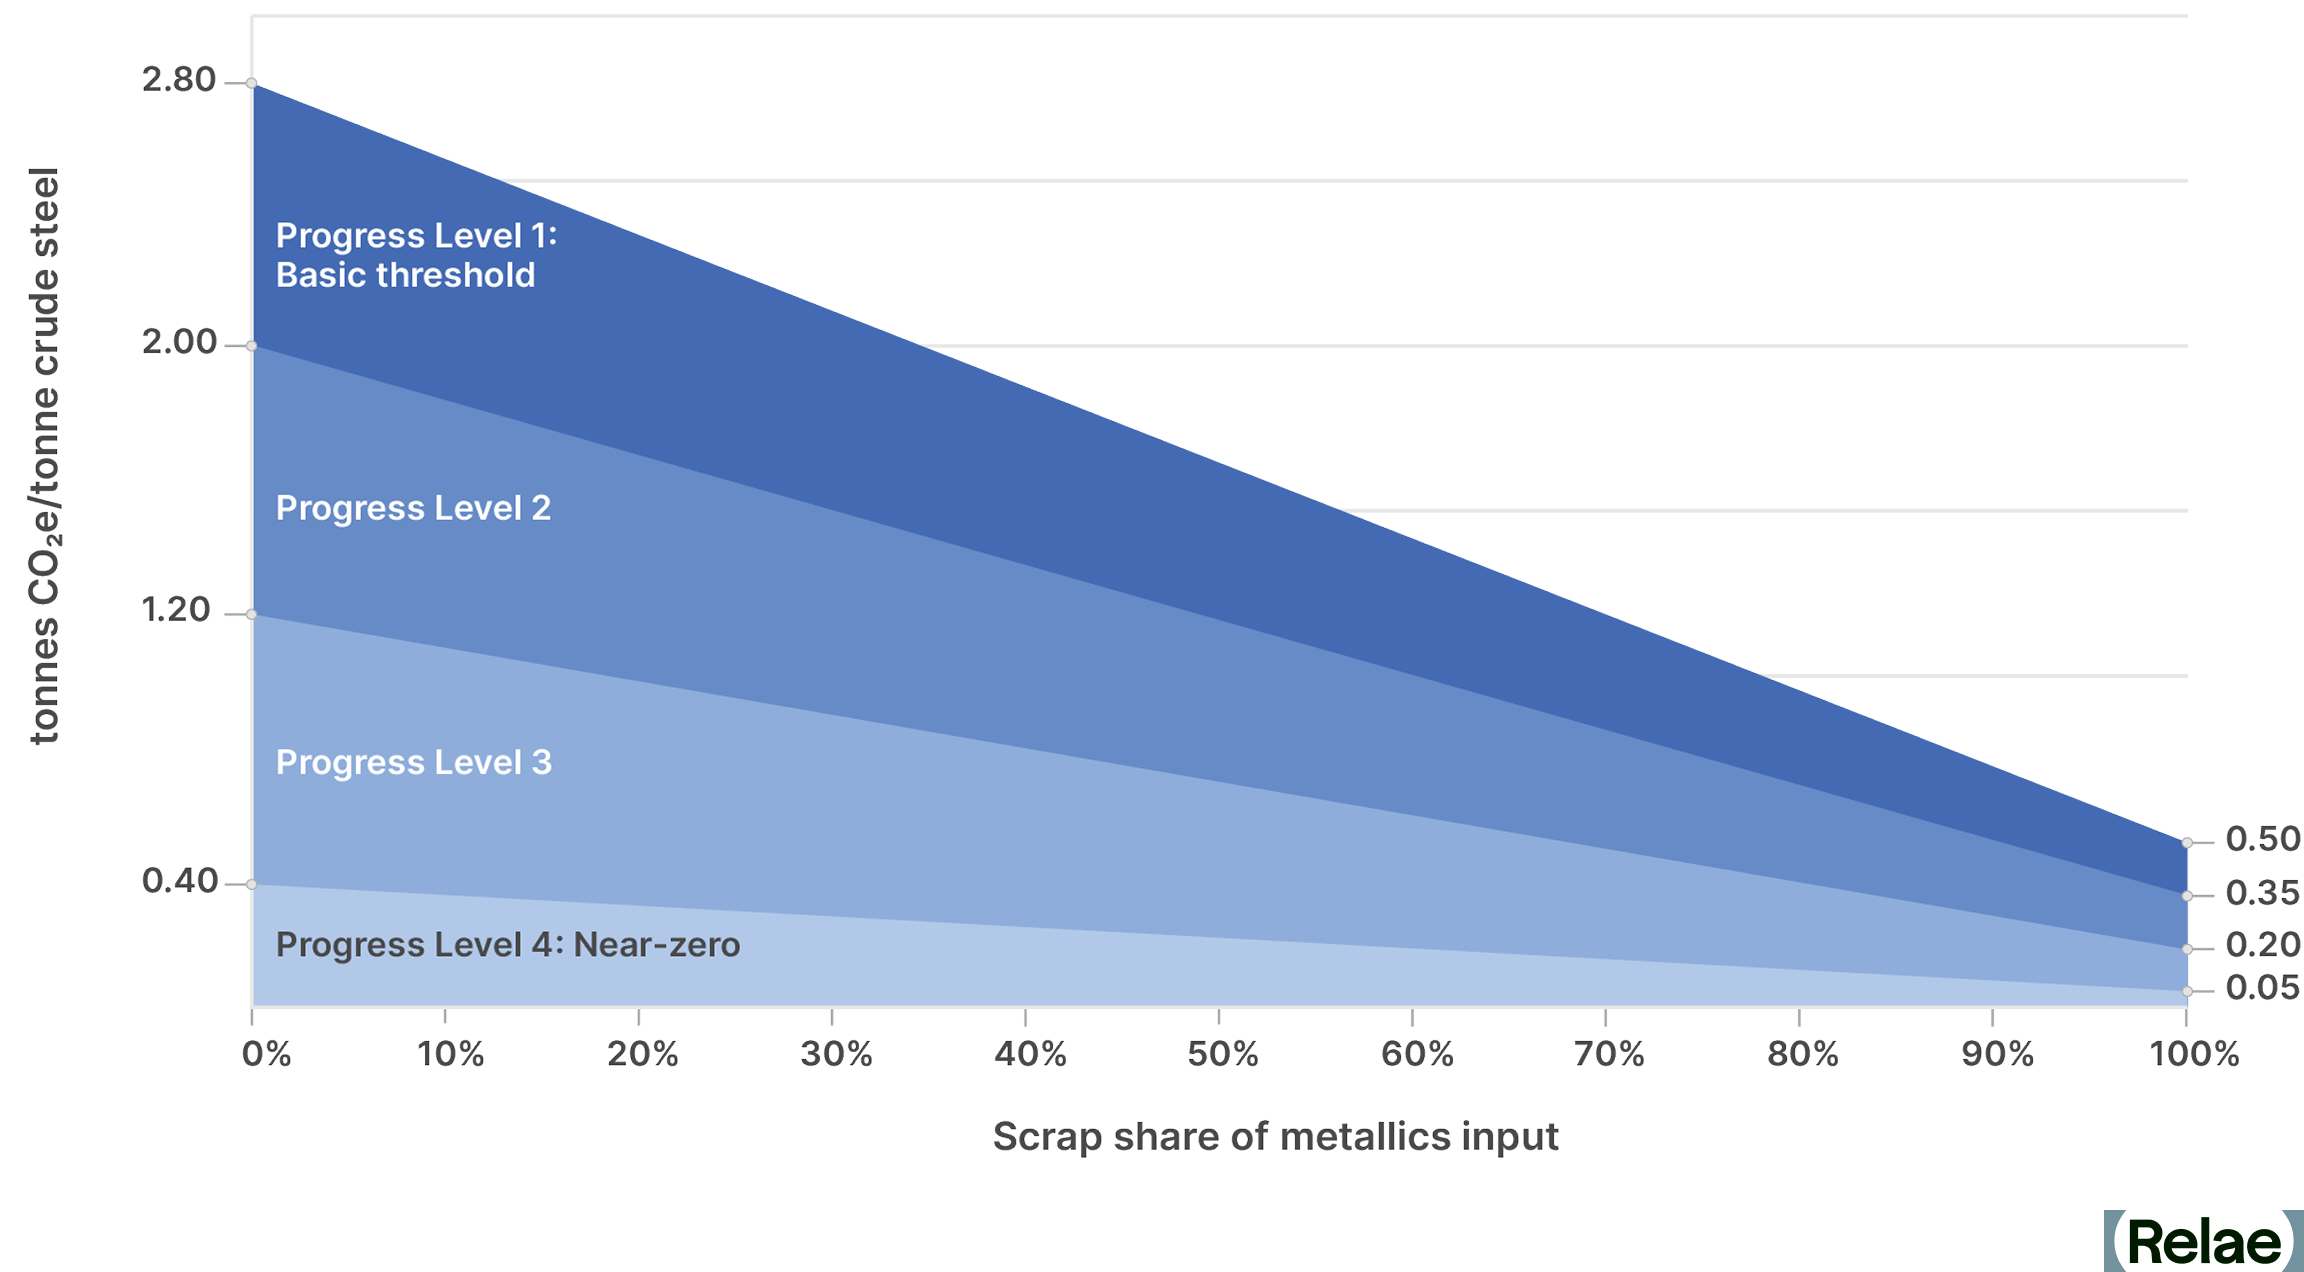
A primary objective of the Criteria for High-Quality Environmental Attribute Certificates in the Concrete and Steel Sectors, jointly developed by Relae (formerly Carbon Direct) and Microsoft, is to establish high-integrity standards for the EAC market in these sectors. For steel EACs, that means demonstrating significant emissions reduction performance by reaching at least Progress Level 2 in the ResponsibleSteel Decarbonization Progress Levels framework, and aiming to achieve Progress Level 3 by 2030. ResponsibleSteel’s scrap-variable benchmark provides a technology-neutral mechanism to evaluate emissions reduction performance by accounting for the specific proportion of scrap used.
EACs for steel are designed to be catalytic. Rather than supporting incremental improvements that are already becoming cost-competitive, they should target transformative capital changes, such as replacing BF-BOF routes with DRI-EAF, adopting low-carbon hydrogen in DRI processes, or deploying novel ironmaking technologies. Multi-year purchase agreements are particularly powerful because they provide the investment certainty that first-of-a-kind projects need to access capital at a lower cost.
What this Means for Buyers and Suppliers of Low-Carbon Steel
Whether you are producing or procuring steel, EACs are only one part of a broader decarbonization strategy. For buyers with significant emissions from steel, and other building materials such as cement and concrete, EACs can be a powerful tool to help advance scope 3 reduction goals where supply for physical low-carbon materials is limited. Suppliers can complement commercialization strategies for low-carbon materials by using EACs to monetize emissions reductions, generate additional revenue to support decarbonization investments, and help scale markets for low-carbon materials. Navigating the steel market requires decisions at the intersection of technical feasibility, greenhouse gas accounting, and capital strategy. Key considerations include:
- Greenhouse gas accounting and reportability: Cradle-to-gate emissions for steel production must be tracked using life cycle assessments and should strive for interoperability with environmental product declarations (EPDs). EAC transactions must be reported transparently, especially given the absence of formal market standards at this stage.
- Additionality and catalytic impact: EAC purchases must demonstrably support projects that would not proceed without financial support from the EAC market mechanism, and projects should have a credible pathway toward the near-zero (Progress Level 4) threshold on the ResponsibleSteel framework.
- Avoiding double counting: EAC buyers must verify that the environmental attributes they purchase are not also being claimed by the physical product buyer via an EPD.
FAQs
What is an environmental attribute certificate (EAC) for steel?
An EAC represents the environmental attributes of low-carbon steel, unbundled from the physical material itself, so a producer can quantify a verified reduction in carbon intensity per tonne and sell that value as a separate, tradeable certificate. Buyers can purchase EACs to support low-carbon steel production while still working toward their own emissions targets.
How is an EAC different from a carbon credit?
An EAC reflects the intrinsic carbon intensity of the material itself, measured through a life cycle assessment. That's different from a carbon credit, which represents carbon dioxide actively avoided, reduced or removed from the atmosphere relative to a baseline.
How are AI data centers impacting the demand for low-carbon steel?
Data centers use roughly 20,000 tonnes of steel each, and as hyperscalers build out AI infrastructure, that steel use counts toward their scope 3 emissions and public climate targets. That's turned data center construction into a meaningful driver of demand for low-carbon steel, even though supply remains limited.
What makes an EAC credible enough to count toward a company's emissions goals?
A credible steel EAC needs to meet criteria like additionality (the project wouldn't happen without the EAC revenue), verifiability through life cycle assessment, and catalytic impact toward transformative technology rather than incremental gains. Relae (formerly Carbon Direct) and Microsoft jointly developed criteria for high-quality EACs in the steel and concrete sectors, which set a threshold of at least Progress Level 2 on the ResponsibleSteel Decarbonization framework today, rising to Progress Level 3 by 2030.
Can a producer sell an EAC and also get credit for the physical steel elsewhere?
No. EAC producers need to confirm the environmental attributes they're selling aren't also being claimed by whoever buys the physical steel through an environmental product declaration; otherwise the same emissions reduction gets counted twice.
Shifting Playbook for Corporate Power Procurement
Key Takeaways
- The Greenhouse Gas (GHG) Protocol’s proposed scope 2 revisions would shift many large power buyers from annual renewable energy certificate (REC) accounting to 24/7 hourly matching and reveal a larger emissions gap than most inventories currently report.
- Of all the US grid regions modeled, the emissions gap between annual and 24/7 hourly matching is widest in PJM Interconnection (PJM) and the Electric Reliability Council of Texas (ERCOT), the markets where data center load is growing fastest.
- Relae's modeling quantifies the shift from annual to 24/7 hourly matching: serving a 4-gigawatt (GW) data center load at 100% hourly carbon-free energy requires 9.6 GW of additional clean capacity in ERCOT and 10.5 GW in PJM, a roughly 800-megawatt premium in PJM that translates directly into cost and siting strategy.
- Closing that gap requires investments in clean, firm generation technologies, like natural gas with carbon capture and storage (CCS), battery storage, and geothermal. The optimal mix varies by market and load profile, which means modeling current and future emissions positions under 24/7 accounting to understand the best procurement options for a specific portfolio.
Annual REC Accounting No Longer Holds at Data Center Scale
For years, large corporate energy buyers have relied on a straightforward approach: purchase renewable energy certificates (RECs) or sign virtual power purchase agreements (VPPAs) to offset market-based scope 2 emissions. Under the current GHG Protocol guidance, these instruments allow companies to claim low or zero emissions regardless of when or where clean energy is actually generated. When corporate clean energy demand was modest, this fueled new renewable project development while aggregate grid emissions were trending down.
That approach worked, until now. Energy demand from data centers and hyperscalers is surging. The Federal Energy Regulatory Commission (FERC) reported more than 50 GW of data center capacity operating in the US at the end of 2025, much of it concentrated in regions where local clean generation cannot keep pace. When corporate clean energy demand was modest, the gap between contractual claims and physical generation was small enough that few questioned this argument. At hyperscaler levels, with load concentrated in a handful of grids, that gap is becoming too large to ignore.
From a climate perspective, well-designed renewable procurement has created real impact by channeling corporate capital into new clean generation, and reducing CO2 emissions anywhere to benefit the climate everywhere. From a grid perspective, power consumption and generation must balance in real time, and the flow of electricity is constrained by the physics of the transmission system. Some regulators, investors, and standard-setters argue that corporate clean energy claims should be grounded in this second, engineering perspective rather than the first. The GHG Protocol's proposed revisions reflect that view, and would force buyers to defend their claims against it.
Relae’s modeling of this 24/7 framework in PJM and ERCOT helps quantify its costs and emissions implications in the markets where the stakes are highest.
What Does 24/7 Hourly Matching Mean for Scope 2 Accounting?
The biggest proposed change to the GHG Protocol’s current Scope 2 Guidance is the move from annual power reporting and matching to a 24/7 approach. Instead of calculating emissions with an annual emissions factor (EF) based on their independent system operator (ISO) or eGRID region for each megawatt-hour (MWh) consumed, companies would need to use hourly-specific EFs.
Companies would still be able to retire RECs to reduce their market-based emissions. However, companies would need to show that these RECs came from clean energy that was generated on the same grid, in the same hour as their facilities consumed power. This makes annual, location-agnostic REC retirement, currently the dominant practice, insufficient for 24/7 market-based accounting.
Both the time restriction (hourly matching) and the location restriction (generation on the same grid as consumption) will make it more difficult for companies to retire RECs. For example, because today's methodology is location-agnostic, a New York-based company can retire RECs from a Texas wind farm (purchased unbundled or via a VPPA) to reduce its reported market-based scope 2 value. This has allowed renewable development to follow the best resource sites rather than the load. Similarly, the time of day that the wind farm generates energy is irrelevant, as long as it is approximately in the same calendar year.
Under the proposed revisions, retiring these RECs would no longer be acceptable for the New York company, since they would fail both location- and hourly-matching requirements. As a result, companies with large REC portfolios today may no longer be able to retire them in order to reduce their market-based scope 2 emissions, if the proposed revisions take effect. These companies may face significant unmatched consumption under 24/7 accounting, especially during evening peaks or grid stress events when fossil-based generation fills the gap.
Annual Matching vs 24/7 Hourly Matching
The figure below illustrates the gap between what a representative large buyer reports under the current annual location- and market-based methodologies, versus what an hourly 24/7 analysis reveals.
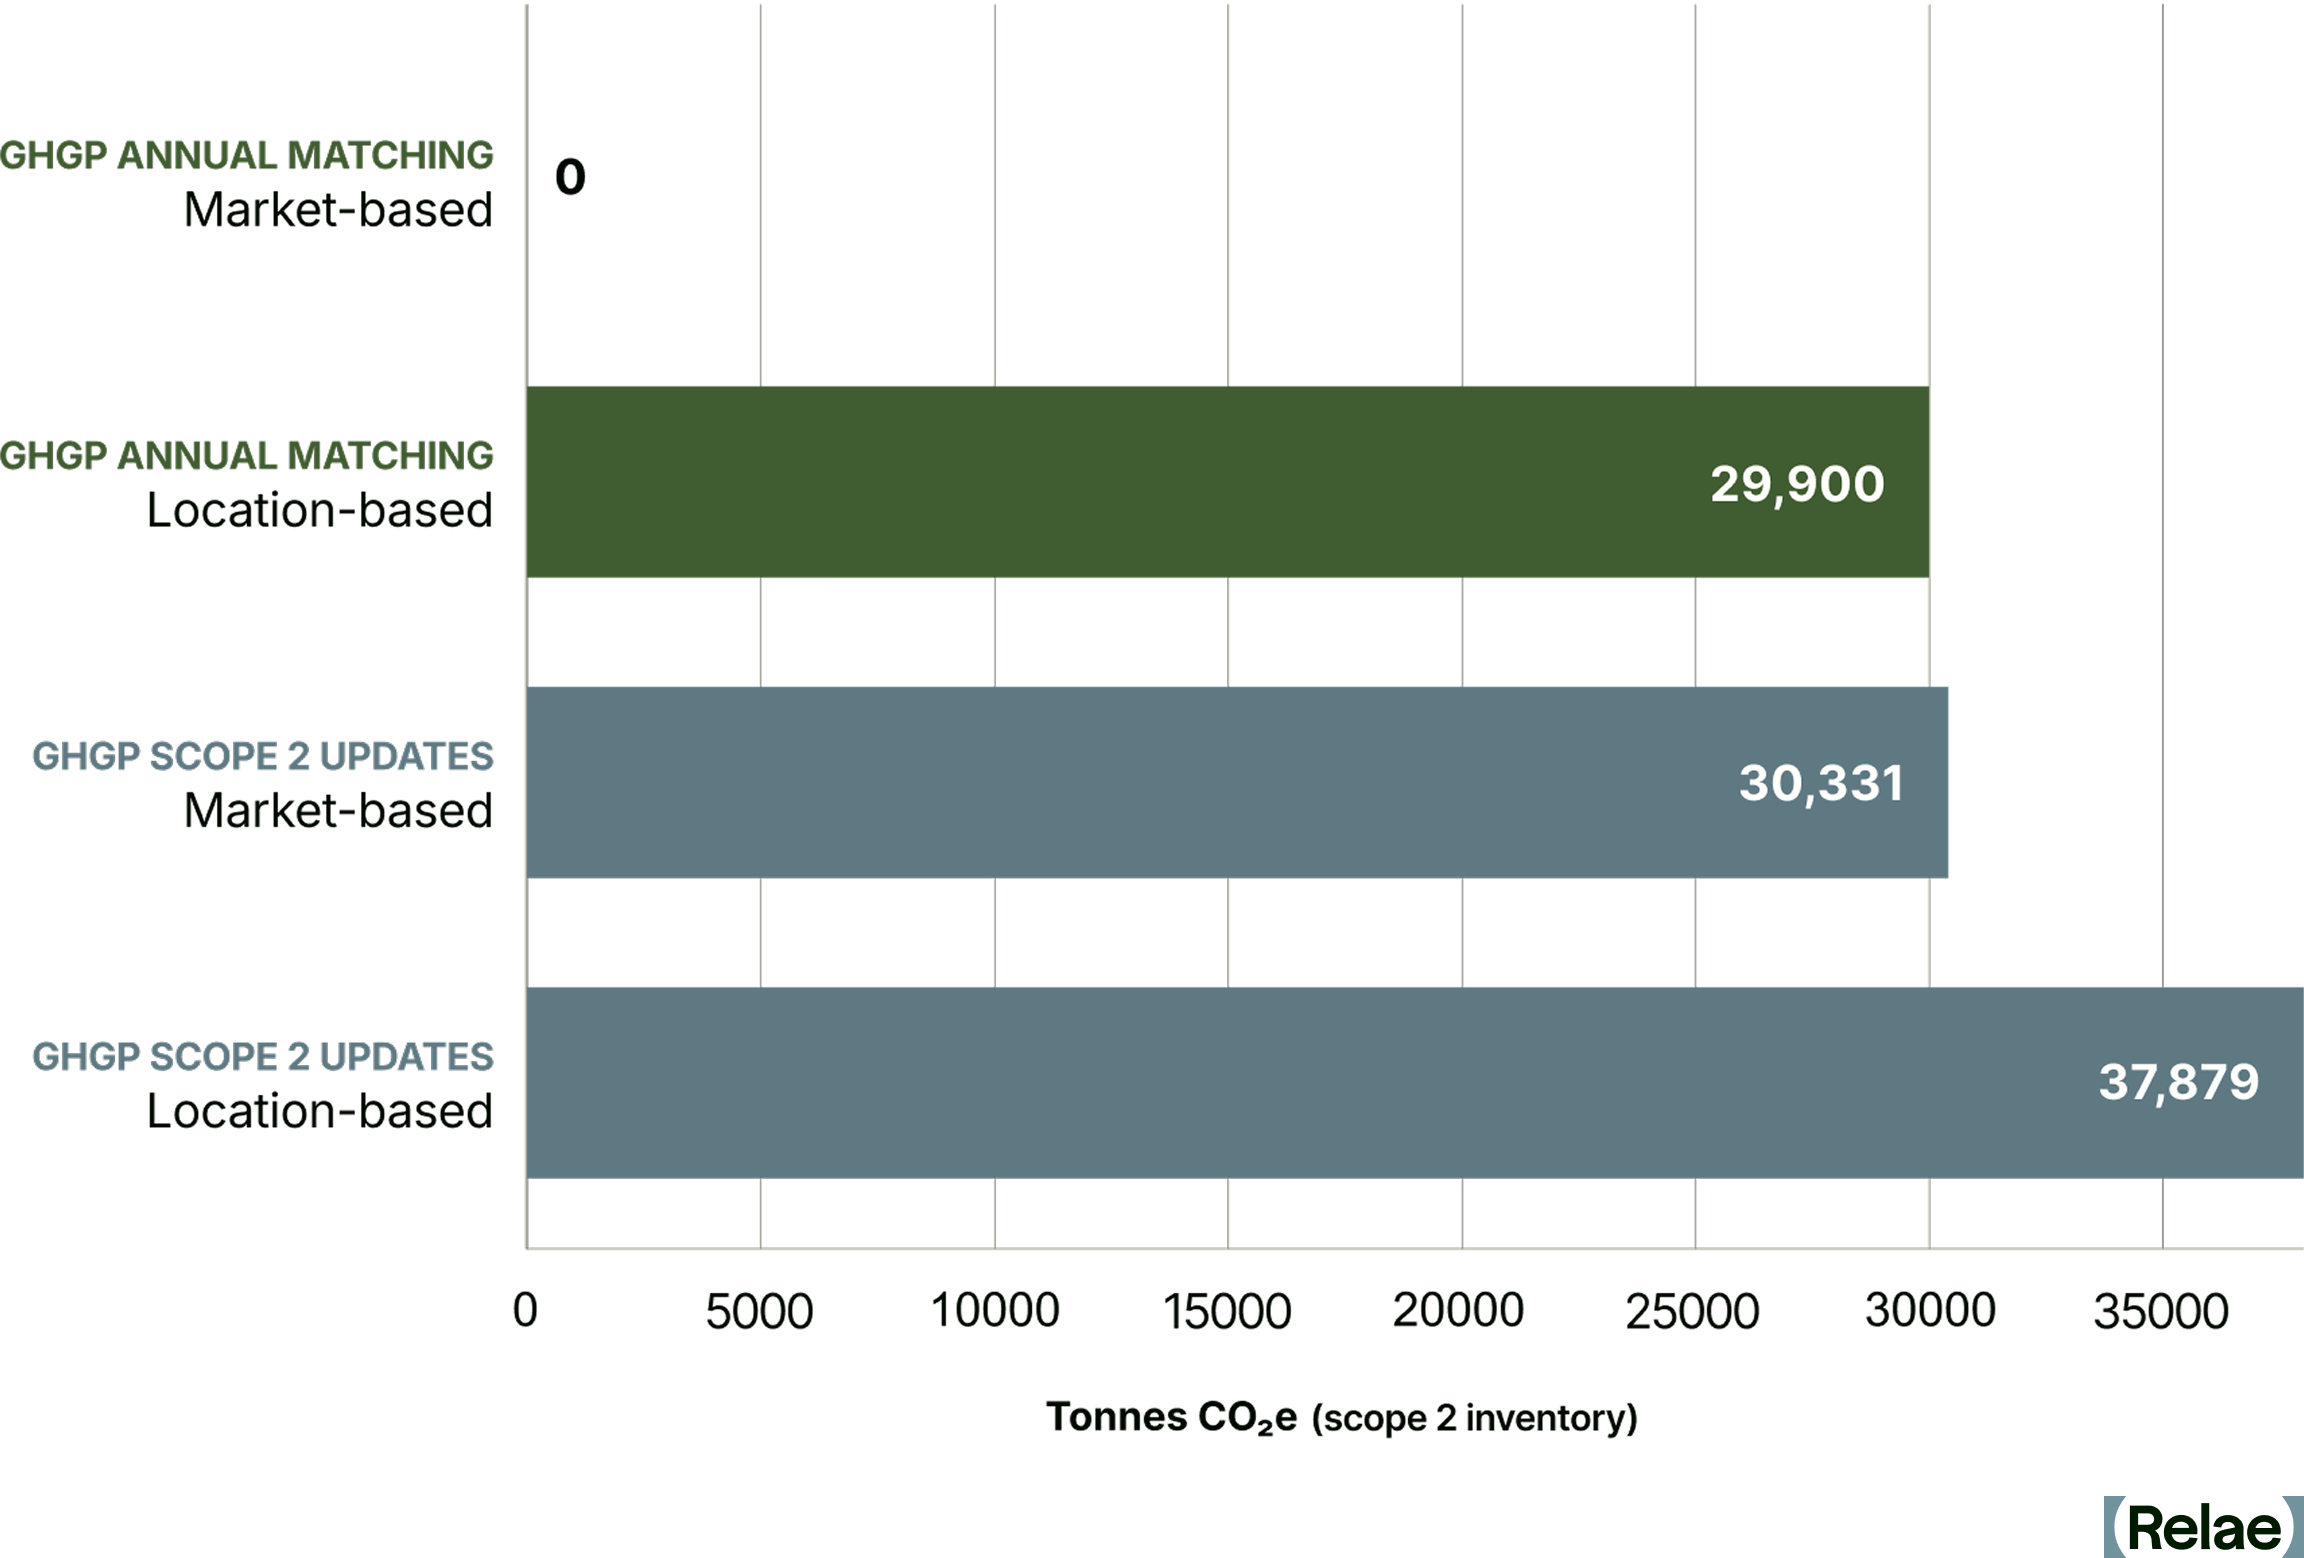
Understanding this emissions gap is the essential first step for buyers to make informed decisions about which instruments to retain, which contracts to renegotiate, and where new investment will matter most. If the proposed scope 2 revisions are enacted, companies procuring clean energy will be disincentivized from buying RECs sourced from variable renewables in distant locations, and instead will find it more favorable to invest in same-grid clean, firm generation, such as geothermal, nuclear, and renewables plus storage. RECs from these projects would qualify to be retired against market-based scope 2 emissions under the proposed revisions, where today's distant-wind or off-peak-solar RECs would not.
Where Pressure Is the Highest: ERCOT and PJM
Two markets stand out for projected hyperscaler load growth: PJM, which covers the extended mid-Atlantic region, and ERCOT in Texas. Both are on track to absorb massive increases in data center demand over the next decade, and both expose the limits of annual REC accounting in ways that will be hard to ignore under the new proposed framework.
PJM: 60% Fossil Generation Means High Marginal Emissions
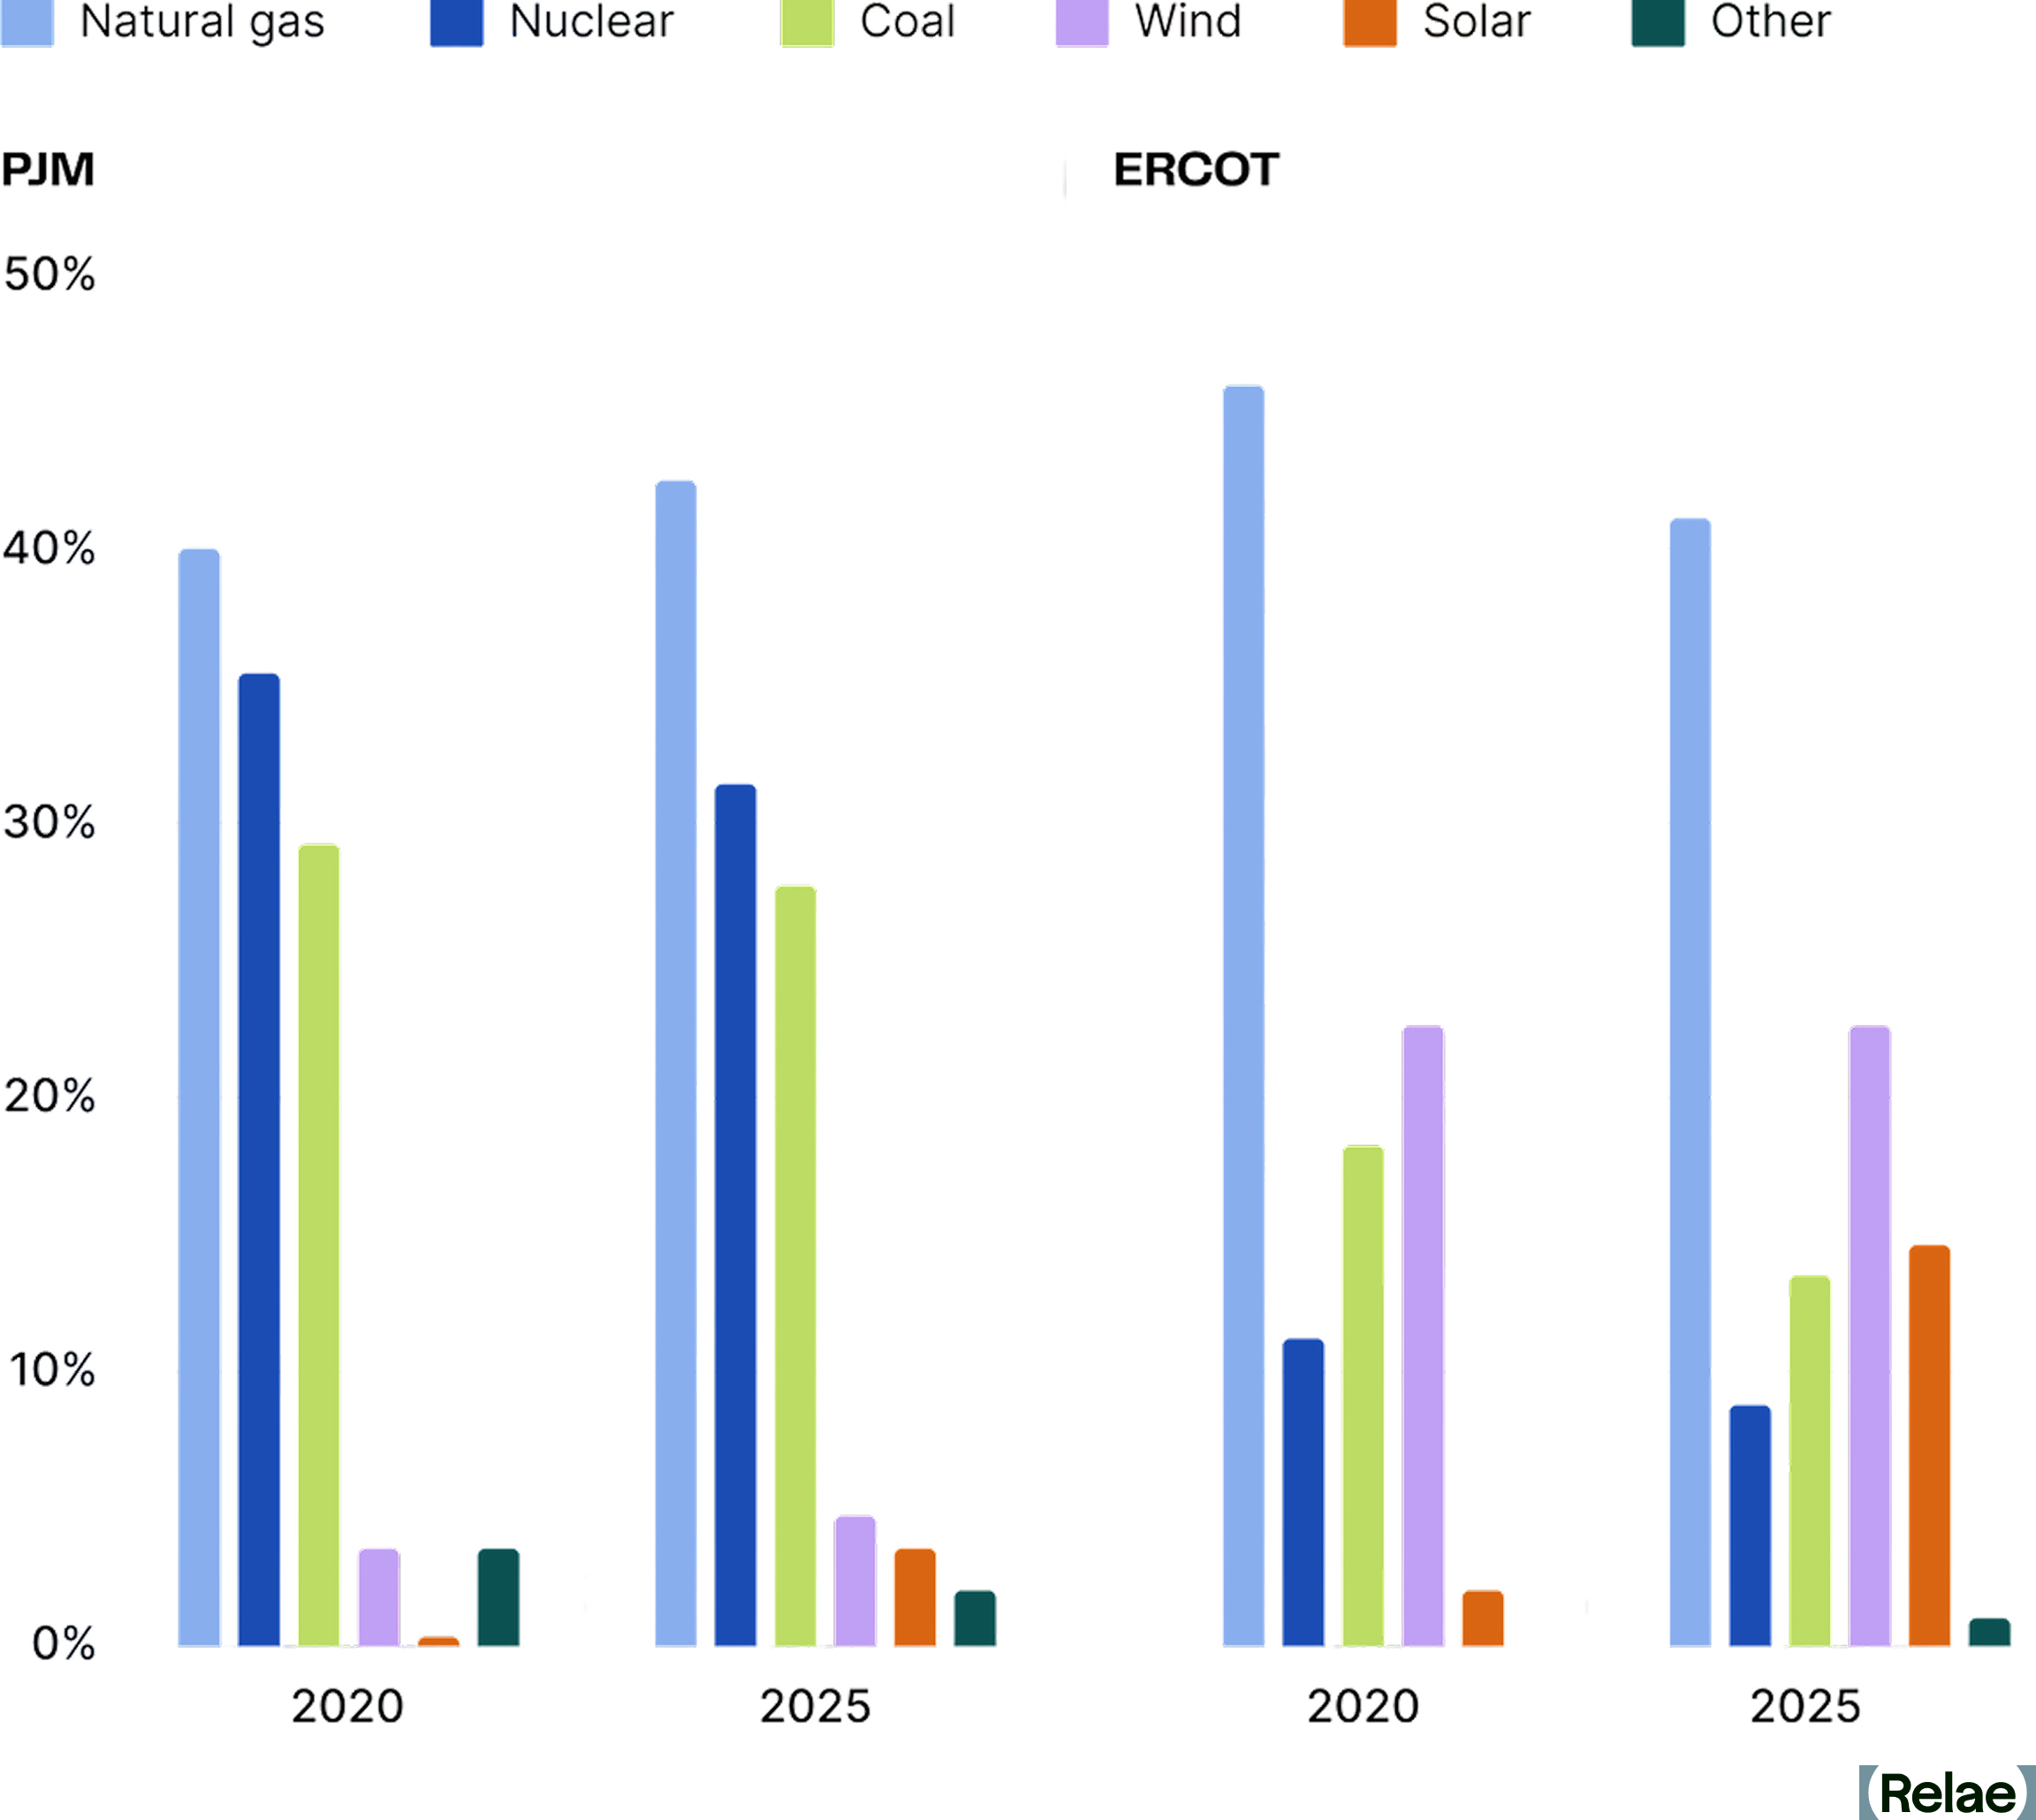
PJM is one of the largest and most complex wholesale electricity markets in the world. Its generation mix still includes 60% coal and natural gas, which means hourly emissions intensity remains high, particularly during evening peaks and grid stress events when fossil generation dominates the dispatch stack.
Buyers relying solely on annual REC retirement may show low market-based scope 2 emissions today, but a 24/7 analysis tells a different story. For PJM-based buyers, this means hourly matching gaps will be largest during evening and overnight hours, when nuclear and storage become disproportionately valuable relative to additional solar.
ERCOT: Solar and Wind Don’t Peak When Demand Does
Texas has abundant wind and solar, with solar generation growing nearly 7x since 2020, but those resources don’t always run when demand peaks. While fossil-based generation has declined since 2020, it still comprises more than half of ERCOT’s generation. Solar dominates midday, wind peaks in the evening, and natural gas fills the gaps, especially during high-demand evenings or extreme weather events.
Buyers with large ERCOT footprints may find that VPPA portfolios, which generate most of their clean energy in off-peak hours, already satisfy the proposed location-based test but fail on hourly matching. Battery storage and demand flexibility could help bridge the gap.
Figure 3 below quantifies that gap in both markets by showcasing the carbon-free energy (CFE) score in ERCOT and PJM, as well as the additional capacity required for a 4 GW load to achieve a 100% CFE target. The CFE score is the share of grid-supplied electricity in a given hour that comes from carbon-free sources, and is the metric the proposed scope 2 revisions would use to evaluate hourly matching. A 100% CFE target means electricity consumption is matched to carbon-free generation in every hour of the year.
In the left panel, a representation1 of each market's 2030 hours are sorted by grid (CFE) score, from the dirtiest hour on the left to the cleanest on the right. Neither grid approaches 100% carbon-free on its own, and the shaded areas represent the unmatched hours a buyer claiming 100% clean energy through annual instruments would actually carry under 24/7 accounting. The gap is the maximum unmatched hours a buyer might be exposed to, as some RECs procured through annual matching may qualify under the new rules, if satisfying the locational and hourly requirements.
The right panel translates that gap into action. The additional co-located clean generation and storage required to serve a representative 4 GW load (roughly 5% of the forecast 2030 C&I load in ERCOT and 4% in PJM) at a 100% hourly CFE target, on top of what the underlying grid already provides.
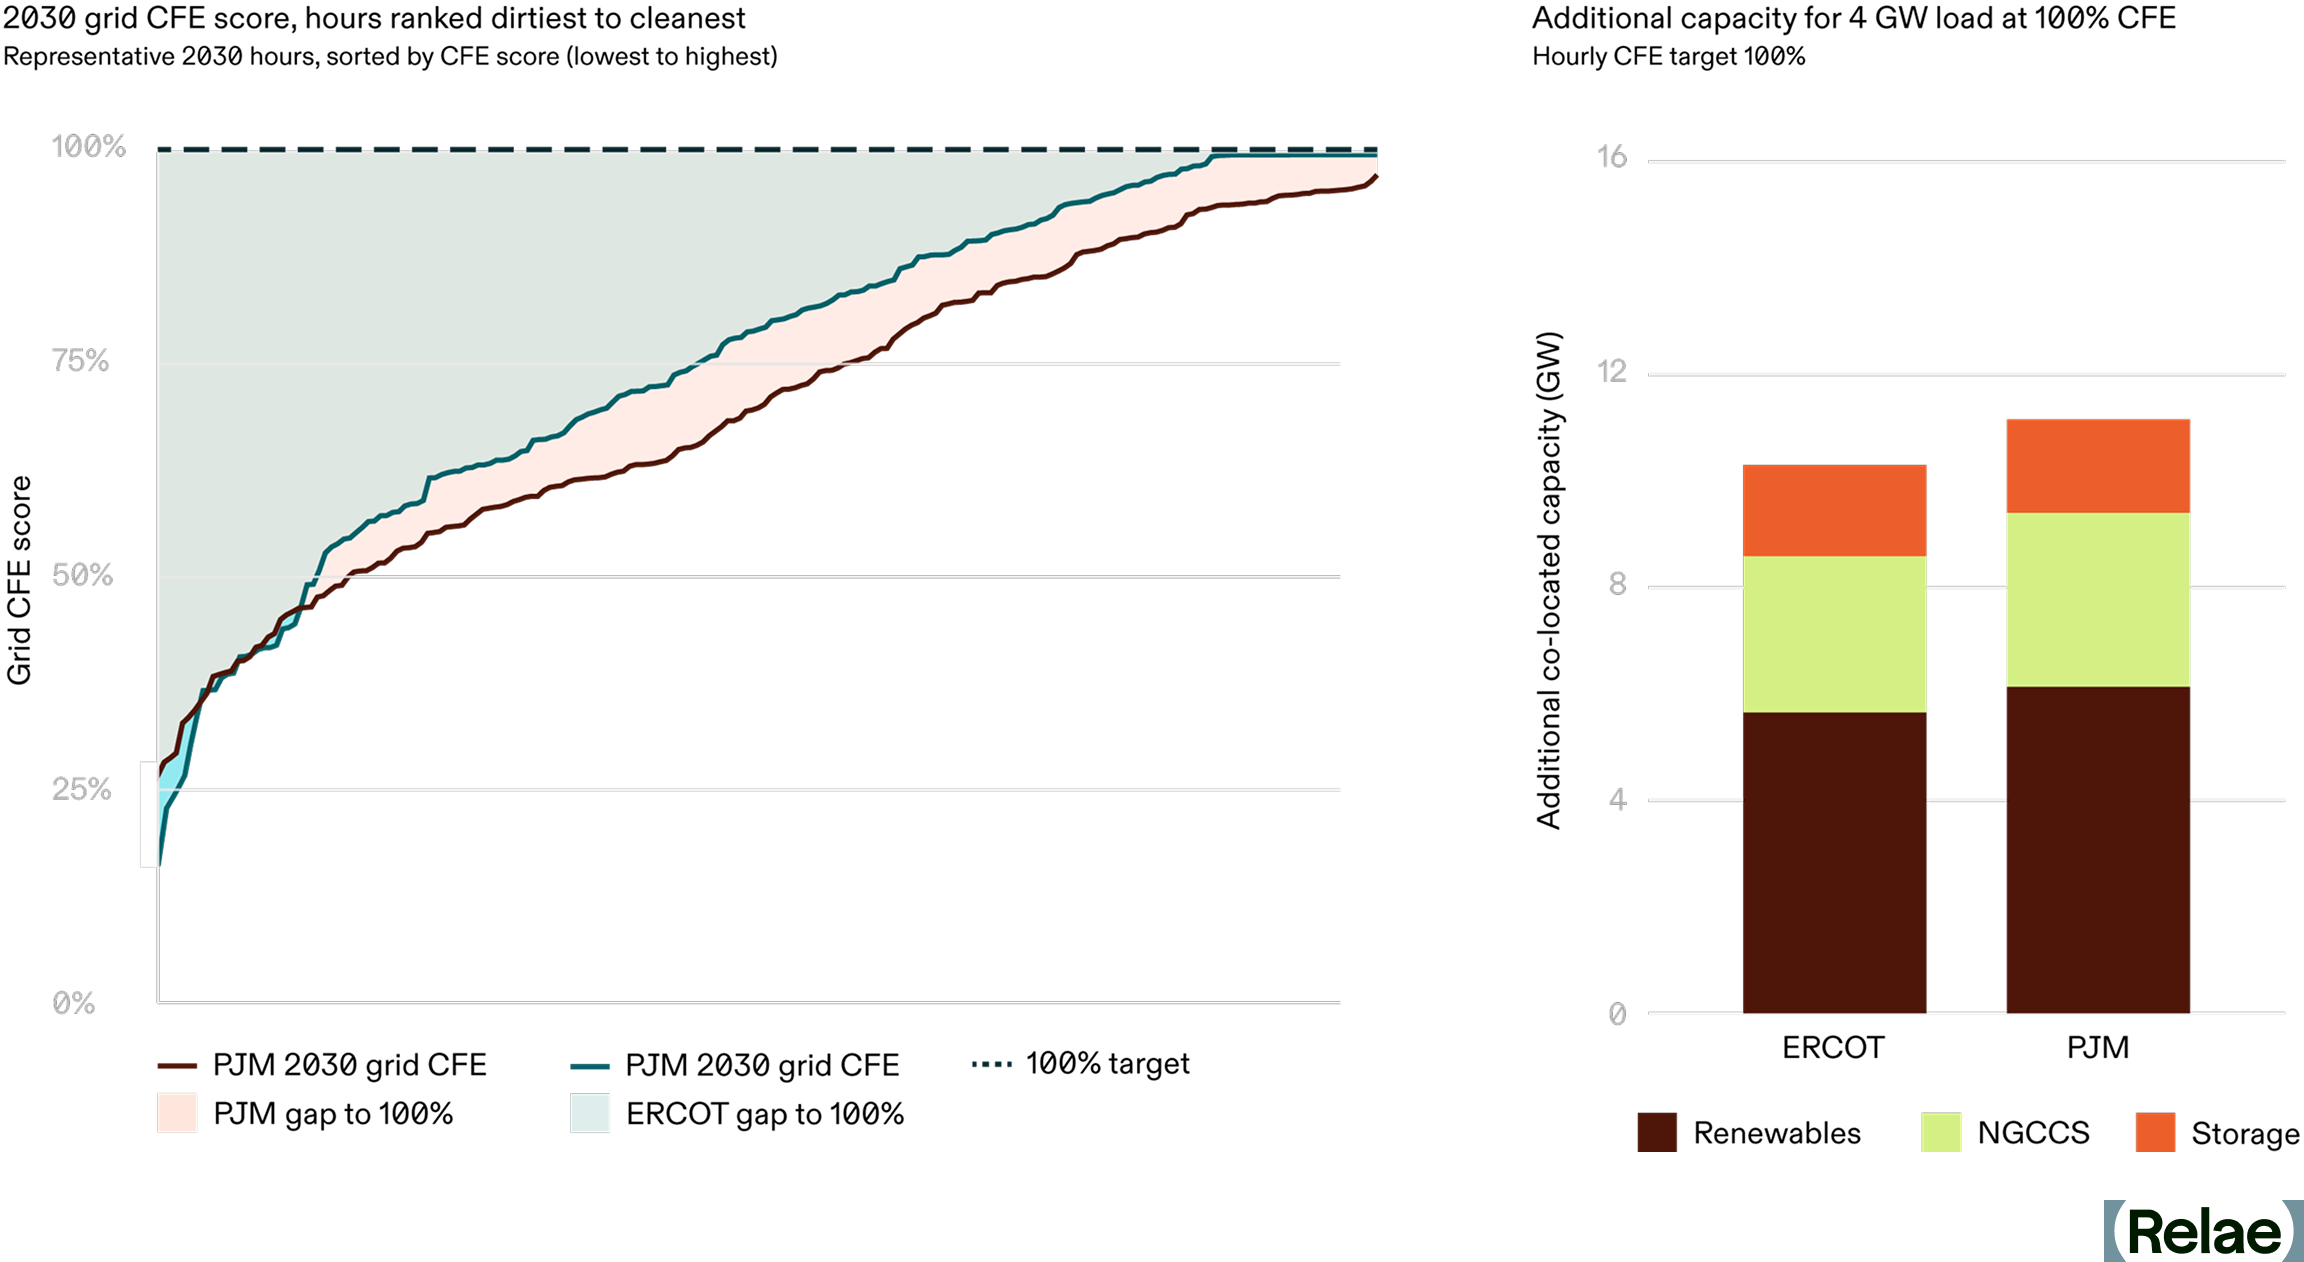
A few patterns are worth highlighting. First, the left panel confirms that PJM’s grid will still spend materially more hours below 100% carbon-free than ERCOT’s in 2030, a direct consequence of the coal- and gas-heavy generation mix described above. Notably, ERCOT's curve reaches 100% in a meaningful share of hours (windows when the grid is running entirely on carbon-free resources), while PJM's never does, meaning some fossil generation is dispatched in every hour.
Second, the ISO a buyer operates in drives a meaningful difference in build-out: hitting 100% hourly CFE for a 4 GW load takes 9.6 GW of additional capacity in ERCOT and closer to 10.5 GW in PJM. This indicates the advantage of achieving hourly and locational matching in already clean grids, which may influence a buyer choosing where to site new workloads.
Renewables have the largest share of the additional capacity in both markets (5-6 GW), paired with significant long-duration energy storage (~2 GW), while natural gas with CCS provides meaningful clean, firm capacity (~3 GW). ERCOT’s storage share of capacity is slightly larger, reflecting the midday-solar/evening-load mismatch, while PJM leans a bit more on natural gas with CCS, where clean, firm generation does more of the heavy lifting due to lower wind speeds and solar irradiance than Texas.
The right panel also illustrates why clean, firm technologies (natural gas with CCS, advanced nuclear, and enhanced geothermal) are likely to be included alongside renewables and batteries in any serious 24/7 portfolio. With only renewables and batteries, hitting the same target requires about double the total generation and storage capacity. In both markets, targets that look achievable today on an annual REC basis will require materially more capital and a different mix of resources, under 24/7 accounting.
Top Questions Large Power Buyers Need to Model Before the Rules Change
The GHG Protocol revisions are not finalized, and the timing of any mandate remains uncertain, which is exactly why modeling cannot wait.
A useful self-test for any large power buyer is: can your team answer the following today with defensible numbers?
- What is your hourly CFE score across your largest load centers, and how far does it sit from your reported market-based emissions?
- Which of your existing VPPAs and REC contracts hold value under 24/7 accounting, and which become effectively stranded?
- What mix of resources delivers the incremental clean, firm capacity that closes your gap in PJM, ERCOT, or wherever your load is concentrated at the lowest cost?
- If your next gigawatt of load were sited in a different ISO, how would your emissions position change?
Clean firm projects do not appear off the shelf. Advanced nuclear, enhanced geothermal, and natural gas with CCS all carry multi-year development timelines, and corporate offtake agreements are often what get these projects financed in the first place. Buyers who engage now help shape the project pipeline that will be available in their target markets in 2030, and can lock in offtake terms before competition for the most valuable sites tightens. Buyers who wait until the methodology is final will be working with shorter lead times, fewer development partners, and less leverage to specify projects that fit their load profiles and hourly matching needs.
Frequently Asked Questions
What is 24/7 hourly matching, and how does it differ from today's REC accounting?
Today's scope 2 accounting lets companies retire renewable energy certificates (RECs) from any grid, at any time of year, to offset their emissions. The GHG Protocol's proposed 24/7 hourly matching would require RECs to come from clean generation on the same grid, in the same hour a facility consumes power, making most of today's location-agnostic RECs ineligible for market-based accounting.
Why are PJM and ERCOT under the most pressure from this shift?
Both markets are absorbing the fastest-growing data center load in the country, and both still lean on fossil generation to meet demand outside peak renewable hours. PJM's generation mix is 60% coal and gas, while ERCOT's solar and wind often don't peak when demand does, so buyers in these markets face the largest gaps between their annual REC claims and their actual hourly carbon-free energy score.
How much additional clean capacity does it take to close the gap?
Relae's modeling finds that serving a 4 GW data center load at 100% hourly carbon-free energy requires 9.6 GW of additional clean capacity in ERCOT and 10.5 GW in PJM. That capacity mix leans on renewables and long-duration storage in both markets, with natural gas with CCS playing a larger role in PJM, where wind and solar resources are weaker.
What should power buyers do before the GHG Protocol revisions are finalized?
Start modeling now. Buyers should know their hourly carbon-free energy score, understand which existing VPPAs and REC contracts hold value under 24/7 accounting, and identify the lowest-cost mix of clean, firm resources that closes their gap. Clean firm projects like advanced nuclear, enhanced geothermal, and natural gas with CCS take years to develop, so buyers who engage early have more influence over the project pipeline and better offtake terms.
Modeling the 24/7 Emissions Gap with Relae
For large power buyers assessing what the proposed GHG Protocol revisions mean for their power procurement portfolio, Relae's Advanced Power Emissions Analysis solution models the gap between current market-based reporting and what 24/7 accounting would reveal—by market, load profile, and technology stack.
How SAF Mandates in the EU and UK Are Reshaping Aviation Fuel Markets
Key Takeaways
- SAF and e-SAF mandates are reshaping the aviation fuel market. The EU and UK impose steep non-compliance penalties, turning regulatory requirements into a strategic lever for those who act early.
- Non-compliance is costly. Penalties run roughly 3 times the cost of compliance in the EU and from about 2 to 13 times in the UK, making long-term planning essential to mitigate risk.
- e-SAF producers have a unique opportunity. Mandates and penalties are shifting the economics of aviation fuel, making e-SAF more attractive despite historically high production costs.
How SAF Compliance Stacks Up
Airlines and fuel suppliers operating in Europe and the UK face growing economic uncertainty due to stringent mandates requiring the adoption of sustainable aviation fuels (SAF) with carve-outs for SAF produced from renewable hydrogen, also known as Power-to-Liquids (PtL) or e-SAF.1 These mandates, aimed at reducing aviation emissions, carry steep penalties (up to 13 times the cost of compliance) for fuel suppliers who fail to meet required quotas. While this creates cost uncertainty for airlines and passengers, it opens a strategic opportunity for e-SAF producers. These producers are challenged by high production costs relative to other SAF on the market and a limited set of buyers that can afford the premium on a voluntary basis.
This piece explores the cost implications for aviation being shaped by these EU and UK SAF mandates and outlines how airlines and suppliers can respond strategically to minimize risk and maximize opportunities. By understanding these dynamics, industry stakeholders can turn regulatory compliance into a source of competitive advantage.
Understanding SAF Mandates in the EU and UK
The EU Commission’s ReFuelEU Aviation regulation, part of the European Green Deal, sets binding targets for aviation sustainability. Beginning in 2025, ReFuelEU mandated that aviation fuel suppliers offer a minimum percentage of SAF and e-SAF at EU airports. By 2030, suppliers must blend at least 6% SAF, including 1.2% e-SAF. To discourage tankering practices (carrying excess fuel for return trips, increasing emissions), ReFuelEU Aviation requires airline operators to refuel at least 90% of their annual aviation fuel needs at a given EU airport before departure.
In parallel, the UK Department for Transport (DfT) mandates a higher SAF blend of 10% by 2030 and places greater emphasis on reducing reliance on hydrogenated esters and fatty acids (HEFA) SAF fuels, which face eventual limitations on feedstock supply. HEFA’s allowable share will decline annually from 100% in 2025 to 42% in 2040. The UK also includes a sub-mandate specifically for PtL SAF.
The Real Cost of Falling Behind on SAF Mandates
The financial impact of these mandates is significant. Each year, the European Union Aviation Safety Agency (EASA) publishes regulatory reference prices for SAF, e-SAF, and conventional jet fuel (CJF) that anchor non-compliance penalties in the EU, most recently the 2025 Aviation Fuels Reference Prices for ReFuelEU Aviation. Using these reference prices for current-year costs and projected production costs or prices for SAF, e-SAF, and CJF from 2030–2050, the following analysis compares EU and UK compliance versus non-compliance penalties, converting all figures to US$/gallon.2
The price gap between SAF and fossil jet fuels remains wide. In 2025, SAF is approximately three times the price of CJF, while e-SAF is nearly twelve times more expensive. Projections indicate this price gap narrows by 2030, but far more for SAF than for e-SAF. The projected price of SAF in 2030 is US$5.46/gallon, more than double the estimated US$2.41/gallon for CJF. The price difference is even greater for e-SAF: with no traded e-SAF market yet, projected 2030 prices span US$5.70/gallon to US$33.00/gallon, with a central estimate around US$18/gallon, or roughly seven times the price of CJF.
Estimated Jet Fuel Prices 2025-2050 (US$/Gallon)
Source: European Union Aviation Safety Agency. 2025 Aviation Fuels Reference Prices for ReFuelEU Aviation. (link); UK Department for Transport. SAF Mandate: Final-stage Cost Benefit Analysis. (link); EUROCONTROL. Aviation Outlook 2050: Main Report. (link)
The mandates carry strict penalties for non-compliance. Penalties for non-compliance in the EU are set at a minimum of two times the price difference between SAF and CJF per gallon of unmet obligation. Additionally, fuel suppliers must supply any unmet fuel obligations in subsequent reporting periods, which pushes the cost of non-compliance in the EU to three times the cost of compliance.
In the UK, penalties work differently: fuel suppliers must pay a fixed buy-out price per megajoule (MJ) of unmet obligation, which translates to US$24.64/gallon of unmet SAF obligation and US$26.08/gallon of unmet e-SAF obligation.3 Because the buy-out is fixed while compliance costs vary, UK penalties range from about 2 times the cost of compliance for e-SAF to 13 times for SAF in later years. The intent is clear: regulators are serious about pushing aviation towards sustainable fuels.
Cost-Comparison of Compliance vs Non-Compliance (US$/Gallon)
Note: The cost of compliance under both mandates is calculated as the price premium of SAF/e-SAF over CJF per ton, using region-specific SAF prices: the EU SAF price reflects HEFA-based supply (ReFuelEU imposes no HEFA cap), while the UK SAF price is a weighted average of HEFA and higher-cost advanced pathways based on the UK's declining HEFA cap. The e-SAF (PtL) price is the same in both regions.
Cost-Comparison of Complicance vs Non-Compliance (US$/Gallon)
e-SAF Has a Policy-Driven Market Opportunity
These price differentials present risk and opportunity. Airlines and fuel suppliers that fall short of compliance will face steep penalties. Those who comply strategically, can mitigate those risks and benefit from financial incentives that help offset higher fuel costs.
Incentive structures support SAF and e-SAF production. For example, the EU’s Emissions Trading System (ETS) has allocated allowances to offset SAF costs, especially for renewable fuels of non-biological origin (or e-SAF). Similarly, the UK offers tradable certificates and has now legislated a Revenue Certainty Mechanism (Sustainable Aviation Fuel Act 2026) that will guarantee SAF producers a set strike price through contracts-for-difference-style agreements, funded by a levy on fuel suppliers, with the first allocation round expected in 2027. The UK’s ETS also provides an indirect incentive as SAF use by airlines lowers compliance costs through reducing required allowances.
Strategic Recommendations for Airlines and Suppliers
To navigate this shifting landscape, airlines and fuel suppliers must think strategically about procurement and compliance, potentially including:
- Proactive procurement: Airlines and fuel suppliers should prioritize securing long-term contracts with SAF and e-SAF producers. Early engagement can help ensure access to limited supply and stable pricing.
- Leverage incentive programs: Actively participate in available incentive schemes, such as the EU ETS and UK tradable certificates, to minimize compliance costs.
- Invest in e-SAF production: Consider strategic investments or partnerships in e-SAF production to align sustainability goals with regulatory requirements and financial incentives.
- Plan for volatility: Develop robust risk mitigation plans, using flexible procurement strategies and financial instruments to buffer against supply chain disruptions and price swings.
Turning Mandates into Market Momentum
As 2030 approaches, the pressure on airlines and fuel suppliers to comply with SAF mandates will intensify. Those who proactively respond to and embrace the mandates can transform regulatory requirements into strategic opportunities. Rather than viewing mandates as burdens, forward-looking stakeholders can use them to drive sustainable innovation and long-term resilience.
The EU and UK mandates for SAF and e-SAF represent an emerging shift in aviation fuel markets. Stakeholders that act now, by engaging with incentives and investing in sustainable fuel solutions, will emerge as industry leaders. Now is the time for airlines, fuel suppliers, and e-SAF producers to act decisively, transforming regulatory compliance from a costly obligation into a clear competitive advantage.
Frequently Asked Questions
What happens if an airline or fuel supplier misses its SAF mandate quota?
Fuel suppliers—the obligated parties—pay a penalty on every unmet tonne: in the EU, twice the price gap between SAF and jet fuel, plus supplying the shortfall in a later period; in the UK, a fixed buy-out price (£0.137/MJ for SAF, £0.145/MJ for e-SAF). Combined, non-compliance runs roughly 3 times the cost of complying in the EU and from about 2 to 13 times in the UK.
What is e-SAF, and how is it different from other SAF?
e-SAF, also called Power-to-Liquid (PtL) fuel, is made from renewable or low-carbon electricity, hydrogen, and captured CO₂ rather than biomass feedstocks. It costs more to produce than conventional SAF today, but both the EU (from 2030) and UK (from 2028) mandates carve out a specific, growing sub-quota for it.
What is the UK's Revenue Certainty Mechanism?
It is a UK government scheme, modeled on the Contracts for Difference structure used in the power sector, that guarantees SAF producers a set strike price for up to 10 years, funded by a levy on aviation fuel suppliers. It became law through the Sustainable Aviation Fuel Act 2026, and the first contract allocation round is expected in 2027.
Is the EU considering changes to its SAF mandate timeline?
The EU has scheduled a formal review of ReFuelEU Aviation for 2027, following calls from airline groups to delay the 2030 e-SAF sub-target. No delay has been adopted, and the European Commission has said it remains "fully committed" to both the SAF and e-SAF mandates and that the 2027 review will evaluate the regulation rather than revise it.
Can corporate buyers still claim SAF benefits from fuel used to meet these mandates?
No, mandated volumes are claimed in the compliance market, so to avoid additionality concerns, voluntary corporate scope 3 claims (typically made through SAF certificates and book-and-claim) must come from supply beyond what the mandates require. As mandate demand grows, the pool available to voluntary buyers tightens, which is why early procurement locks in both supply and price.
Carbon Removal, Reduction, and Avoidance Credits Explained
Key Takeaways
- Trust in carbon credits remains low. In part, this is because many mistakenly treat every credit type as interchangeable.
- Reduction, removal, and avoidance credits are verified against fundamentally different baselines, so credit quality must be judged based on type and project specifics, never with one blanket standard.
- The Integrity Council for the Voluntary Carbon Market's Core Carbon Principles now give buyers an independent bar to check against, including 44 methodologies approved across 13 eligible crediting programs, as of August 2026.
- Removal credits still make up only 5–6% of the market, even as compliance-driven demand accelerates, per our 2026 State of the Voluntary Carbon Market report.
Three Types of Carbon Credits: Reduction, Removal, and Avoidance
A carbon credit is a mechanism that allows one party to compensate another for their carbon mitigation activities. Based on their net emissions impact, there are three types of carbon credits: reduction, removal, and avoidance.
- Reduction credits reflect activities that decrease greenhouse gas emissions, compared to prior practices.
- Removal credits reflect activities that remove carbon dioxide already present in the atmosphere and oceans and lock it away for decades, centuries, or millennia.
- Avoidance credits reflect activities that prevent greenhouse gases from being emitted in the first place. For all three types, credits are assessed and issued by measuring or estimating how much carbon is reduced, removed, or avoided as a result of a credit purchase and its associated activities.
While credits are assessed in different ways depending on the type, one of the most important indicators of quality is a project's baseline - the emissions that would be present in a business-as-usual scenario, without action being taken to reduce, remove, or avoid them. Project developers use baselines as a means of comparison to assess the net emissions impact of a project.
- Baselines must be accurately set and data-driven.
- Emissions impacts of a project must be correctly calculated against its baseline.
Reduction, removal, and avoidance projects involve very different activities and, for some types of projects, it may be more challenging to establish an accurate baseline. However, without accurate baselines, climate impacts cannot be reliably determined.
Across the voluntary carbon market, Reduction credits represent roughly 20% of the purchases. Removal credits represent roughly 5% of the purchases. The remainder, roughly 75%, are avoidance credits.
Carbon Reduction Credits
Carbon reduction must drive the majority of our push to net zero, but translating carbon reduction activities into carbon credits that can be purchased is challenging. Examples of activities represented by carbon reduction credits include reducing fossil fuel use by improving fuel efficiency, or programs that reduce the methane that is generated from farms or municipal waste processing.
Reduction credits are measured and quantified against the baseline emissions of an existing technology or process. Some reduction credits are easy to track and measure, such as efficiency investments or destruction of fugitive methane. Other projects are more complex. For example, low-emission cookstove projects in developing regions rely on tracking patterns of cookstove use and quantifying emission factors for various fuel and stove combinations, both of which are hard to do. The result, as studies have shown, sometimes leads to overcrediting in reduction projects.
Superpollutant Credits
One class of reduction credit, superpollutant credits, has garnered recent attention. These credits involve the reduction of non-CO2 greenhouse gases with very strong radiative forcing, such as methane, nitrous oxides, or fluorinated gases like chlorofluorocarbons. These are not a substitute for CO2 removal, but can provide rapid and profound reductions at modest cost. Many different kinds of superpollutants exist in today’s market, worth roughly $60M today. Recent purchases by tech companies and others have highlighted the potential of these reduction credits.
Another class of reduction credit, transition credits, involves the deliberate early closure of emitting assets like coal-fired power plants or heavy manufacturing facilities. Early efforts by governments, banks, and companies around the world under the Just Energy Transition Partnership agreement jump-started transition credits as a concept at COP26. The Kinetic Coalition, in partnership with many groups including Relae, has launched work to bring transition credits to market with several pilot efforts, including closing a coal plant in the Philippines 10 years early.
Carbon Removal Credits
Projects that remove carbon come from a diverse set of solutions, from nature-based solutions like reforestation, to hybrid solutions like biochar, to engineered solutions such as direct air capture and storage. Roughly 5–6% of credits on the voluntary carbon market today are classified as removals, up from roughly 3% a few years ago.
Carbon removal baselines are determined differently depending on whether a project uses an engineered, hybrid, or nature-based solution. For engineered removals, the baseline is zero, because no carbon removal was occurring in the absence of the project. The credited removal will be the difference between the quantity of carbon removed and any emissions that occur to facilitate the removal (determined through a carbon credit life cycle assessment). Baselines for hybrid and nature-based removals can be more challenging. In natural systems, changes in carbon stocks created by removals must be measured and approximated over time, and creditable removals represent the additional carbon removed by the intervention relative to the baseline (e.g., fallow land versus a reforestation project).
Another important consideration for carbon removal credits is project durability, a measure of the likely duration of carbon storage. Stored carbon can re-enter the atmosphere either through deliberate actions (e.g., deforestation) or accidental ones (e.g., wildfires). Nature-based removals are especially vulnerable to being re-released and are usually considered less durable (i.e., stored for less than 50 years). In contrast, engineered solutions offer high durability (i.e., stored for hundreds to thousands of years), and hybrid removals also offer durability periods that are typically longer than those of nature-based removals.
While less durable, nature-based solutions are effective, cost-effective, and widely available today. They made up over 95% of all carbon removal credits issued in 2025. Engineered and hybrid solutions are more expensive and scarce but offer longer durability. Prices of engineered carbon removal are likely to fall with innovation and increased market participation, but are currently much higher than most nature-based credits. With SBTi's finalized Corporate Net-Zero Standard V2.0, this balance is likely to shift. Large companies must now purchase removal credits covering 1–100% of scope 1, scope 2, and scope 3 emissions between 2035 and their net-zero year, with an explicit focus on more durable CO2 removal credits.
Carbon Avoidance Credits
Examples of carbon avoidance include avoiding deforestation that would result in the release of carbon dioxide into the atmosphere or clean energy projects that avoid the release of emissions from burning fossil fuels in possible facilities. This can be confusing, since many avoided credits are called reduction credits, as is the case with projects under the Reducing Emissions from Deforestation and Forest Degradation (REDD+) framework. Avoidance credits make up roughly 75% of certified credits on the voluntary carbon market today - an overwhelming majority - in part due to high availability and low price.
Avoiding emissions is an important goal with numerous environmental, climate, community, and other benefits. Relae works with clients and customers across industries on developing and implementing strategies to avoid emissions within their value chain. However, there are significant challenges with the way that many carbon avoidance credits are created.
- Carbon avoidance credits are based on an estimate of the emissions that might have existed had a project not been funded. Because it is impossible to observe what might have happened in the absence of a project, carbon avoidance estimates are determined by considering historic data and contextual information. Statistical models can be used to create a presumed baseline that represents what would have happened in the absence of the project.
- Because the baseline is not observed in an avoided emissions project, there is uncertainty in calculating the number of carbon credits it produces. If the baseline is not set accurately, a project can overcredit. While the lack of a directly observed and measured baseline means avoidance credits will always have some degree of uncertainty, high-quality avoidance projects present compelling evidence to support their baselines, greatly reducing uncertainty.
New datasets, statistical techniques, and methodologies are providing opportunities for developing avoidance credits with more certainty. Three REDD+ methodologies have now cleared the Integrity Council for the Voluntary Carbon Market (ICVCM) assessment for its Core Carbon Principles (CCPs), a concrete sign that credit quality standards for avoidance projects are maturing.
Defining and Standardizing Quality in the Voluntary Carbon Market
Carbon credits are intended to reduce, remove, or avoid emissions. They pay for an environmental service that must be delivered. Companies working to generate climate benefits through credit purchases must grapple with the differences and uncertainties of credit quality to ensure that the intended benefits are realized.
While high-quality credits exist for all types of projects, a rich understanding of the differences in methodologies, geographies, physics, and ecology is required to identify high-quality projects and understand varied certainty, durability, and risk terms. Identifying high-quality carbon projects demands extensive and project-specific diligence beyond carbon market certification.
Our own diligence work reveals that high-quality projects can be hard to find. Fewer than 10% of the carbon removal projects we assessed for our 2026 State of the Voluntary Carbon Market report met our quality criteria. This diligence work now has an additional, independent backstop. As of August 2026, the ICVCM has approved 44 methodologies across 13 programs, as eligible for its CCP label, including ACR, Gold Standard, and VCS. For buyers, considering projects that are CCP-eligible should be used as a first filter—not a substitute for project-level diligence, but representing a legitimate floor.
While realized emissions impacts may be difficult to prove in some cases, it is important to remember that some projects provide additional co-benefits. REDD+ projects, for example, may have a positive impact on conservation and biodiversity, and cookstove projects may offer clear human health and social welfare benefits. However, these benefits should be assessed separately from carbon reduction, removal, or avoidance benefits.
Frequently Asked Questions
What's the difference between a carbon credit and a carbon offset?
A carbon credit represents one verified tonne of emissions reduced, removed, or avoided. A carbon offset describes how a buyer uses that credit, typically to counterbalance emissions it has not yet accounted for. The credit itself does not change type based on how it's claimed.
Which type of carbon credit—reduction, removal, or avoidance—is highest quality?
No single type is inherently highest quality. Each project, regardless of type, is verified against a defined baseline. Quality depends on how rigorously that specific baseline was set and how well the project meets other quality criteria. Removal credits from engineered sources have the most straightforward baseline (zero), and avoidance credits carry the most baseline uncertainty by design, but these are only one determinant of credit quality.
Do carbon removal credits automatically meet the ICVCM’s Core Carbon Principles?
No. The ICVCM assesses methodologies and programs, not individual projects. If a project uses a methodology that is eligible for the CCP label, this can be a useful floor but is not a guarantee of high quality.
How does SBTi's near-term removal mandate change which credits I should buy now?
SBTi's finalized Corporate Net-Zero Standard V2.0 doesn't require removal purchases until 2035, but it sets the ramp now (i.e., 1% of scope 1, scope 2, and scope 3 emissions in 2035, scaling to 100% by the net-zero year). This means the highest-durability removal supply that is scarcest and most in demand today is the same supply that many companies will need later. The SBTi guidelines are still changing, so buyers and project developers must track them closely.