Every Climate Action Counts: GHG Protocol's AMI Proposal Explained
Key Takeaways
- The GHG Protocol's Actions and Market Instruments (AMI) proposal introduces a four-statement reporting framework that will give companies an official place to report carbon dioxide removal (CDR), book-and-claim environmental attribute certificates (EACs), and financed reductions, actions that cannot currently count toward scope 1, 2, or 3 emissions reporting.
- The AMI proposal’s four-statement framework will put current emissions and mitigation efforts side by side in the same report, in the same units, giving sustainability teams a clear, defensible way to make a business case for every major decarbonization investment.
- A full draft standard is expected in 2027/2028. Companies that audit their portfolios against emerging quality criteria and engage now will have time to identify gaps and be best positioned when the standard takes effect.
What Problem Does the AMI Proposal Solve?
Companies that have purchased carbon dioxide removal (CDR) credits, invested in book-and-claim environmental attribute certificates (EACs) for low-carbon materials, or funded a carbon capture and storage (CCS) project outside of their value chain have probably heard some version of the same question from their board, employees, or investors: "Where does this show up in our GHG Protocol Scopes?" Until now, the answer has been: it doesn’t.
The current GHG Protocol Corporate Standard was built around a single organization’s emissions inventory. It has no recognized home for CDR, EACs for materials, or financed reductions that occur outside of a company’s operational boundaries (they must be “reported separately”). Companies making real climate investments, therefore, have had no standard way to show it within the Corporate Standard.
The GHG Protocol's Actions and Market Instruments (AMI) proposal aims to fundamentally change that.
What Is the AMI Proposal's Four-Statement Framework?
The GHG Protocol's AMI proposal will replace the single corporate inventory with four distinct Statements, all housed within a single GHG Report:
- Statement 1: A company’s traditional GHG inventory, including operational emissions across scope 1, scope 2 (location-based only), and scope 3.
- Statement 2: Market-based emissions accounting across scopes 1, 2, and 3 using EACs for energy, materials, and other purchased goods. While this is well established for electricity, it will be the first time that similar book-and-claim arrangements for low-carbon steel, concrete, sustainable aviation fuel (SAF), and renewable natural gas can be directly recognized.
- Statement 3: Beyond-value-chain mitigation and CDR. This is the reporting home for CDR credits, superpollutant credits, and financed reductions that mitigate emissions outside a company’s value chain.
- Statement 4: Co-benefits and additional climate impacts, capturing non-GHG benefits arising from corporate action and value that do not fit neatly into emissions accounting.
This change is more than just a rearrangement of reporting - it’s a fundamental expansion of scope. The introduction of Statements 2 and 3 will allow companies to report their mitigation activities in tonnes of CO2e - the same unit as their emissions. For the first time, a company will be able to show its emissions and its climate investments side by side, in the same language, in the same report.
Why Does This Matter Now?
Today, companies investing in CDR, book-and-claim EACs (other than electricity), and financed emissions reductions face a persistent credibility gap. The investments are real. The climate impact is real. However, since no recognized reporting framework captures them, they are functionally invisible within corporate disclosures. This makes it harder to justify the spend internally and harder to communicate the value externally.
The AMI framework will remove that barrier across every major decarbonization category:
- A company purchasing a book-and-claim EAC for the low-carbon attribute of low-carbon concrete or steel would report the carbon intensity benefit in Statement 2 under scope 3.1. Statement 2 is the appropriate reporting location, rather than Statement 1, because the physical low-carbon concrete/steel product is not actually used by the company.
- An airline or corporate traveler using SAF via a book-and-claim arrangement could report the emissions benefit in Statement 2. Similarly, the airline could now report biogenic emissions from SAF if applicable in Statement 2, scope 1. Corporate travelers would report improvements in Statement 2, scope 3, category 6. Since the SAF does not physically enter the airline’s planes, the benefit is reportable only in everyone’s Statement 2 reports. If the airline can prove physical delivery of SAF onto its airplanes, then the benefits are shifted into everyone’s Statement 1 reports.
- A technology company funding a third-party carbon capture and storage project that receives verified reduction credits would report them in Statement 3, because the CCS project is outside of the technology company’s value chain and the technology company is not buying any goods or services from the CCS project. The third party that operates the CCS project would report lower scope 1 emissions in Statement 1 than they did pre-CCS, since the project impacts their direct emissions.
- A company buying CDR credits from CDR projects outside of their own value chain would report the removals in Statement 3, directly alongside the company’s Statement 1 and 2 emissions. This differs from the previous example because the company is not funding a project; it is buying a service - a CDR credit.
The practical effect will be significant. When clients ask whether a given investment "counts" under the GHG Protocol, the answer will shift from "probably not" to "yes, and here is which statement it belongs in."
What Does This Mean for Hard-to-Abate Sectors?
For sectors like cement, steel, chemicals, shipping, and aviation—where full decarbonization will be extremely challenging—the AMI proposal’s framework offers something that has not previously existed: a multi-faceted reporting strategy.
Companies in these sectors will be able to combine Statement 2 (EAC-based carbon intensity swaps for purchased goods) with Statement 3 (financed reduction credits) to demonstrate near-term progress, while long-term abatement technology matures. A cement buyer, for example, would procure low-carbon cement EACs under a book-and-claim arrangement and report the emissions benefit in Statement 2, while simultaneously funding a CCS project and reporting the resulting reduction credits in Statement 3.
For data centers and large power consumers, the framework adds a new layer to existing scope 2 electricity strategies: the ability to report the embodied carbon benefits of low-carbon materials used in construction and infrastructure, via Statement 2. Lower-carbon natural gas for power procured with EACs would also now be reportable in Statement 2.
For financial institutions and asset managers, the new statements create a richer disclosure environment for both internal reporting and structuring sustainability-linked financial products tied to Statement 2 and 3 performance.
How to Prepare Now
A full draft standard is expected in 2027/2028. Between now and then, the GHG Protocol will define the eligibility and quality guardrails that determine what activities qualify for Statements 2 and 3. Those criteria will matter enormously: they will shape which CDR credits, EAC programs, and financed reduction projects meet the bar for official reporting recognition.
Companies should not wait for final rules to begin preparing. Here are the most important steps to take now:
- Review existing portfolios against the emerging quality criteria for Statements 2 and 3. Not every credit or EAC program will qualify, and identifying the gaps early creates time to act.
- Map current decarbonization investments to the four statements. This exercise alone will reveal reporting opportunities and gaps that are not visible under the current single-inventory framework.
Frequently Asked Questions
What is the AMI proposal, and how does it work?
The GHG Protocol’s Actions and Market Instruments (AMI) proposal would allow organizations to report: their emissions (statement 1); their market-based emissions across all scopes (statement 2); GHG emissions reductions, avoidance, and removals resulting from their actions (statement 3); and other relevant metrics (statement 4).
How does AMI compare to the TCAT and/or AIM framework?
The AMI proposal is very similar to the Task Force for Corporate Action Transparency (TCAT) Mitigation Action Accounting and Reporting Guidance and the Advanced and Indirect Mitigation (AIM) Standard & Guidance. The AMI standard is not finalized, but many concepts from TCAT and AIM (including sector association tests) could be included in the final standard.
Can any climate action really count for the AMI proposal?
As of September 2026, the AMI standard is not finalized. However, if the final standard adopts the proposed structure, then any verified, high-quality climate action is reportable. Look for guidance from the GHG Protocol to determine verification and quality requirements.
Climate Strategy
Relae helps you turn energy and climate ambition into fit-for-purpose strategies grounded in current science, real-world operating conditions, market and policy intelligence, social considerations, and commercial objectives. Our work connects emissions analytics, market insight, policy expertise, and execution strategy to help you quantify trade-offs and defend high-stakes decisions with regulators, investors, and internal stakeholders.
Ready to Navigate What Comes Next?



Daniel Garcia, PhD

Daniel Garcia, PhD

Daniel has previous experience working in industry and government. He most recently supported the Department of Energy’s Advanced Research Projects Agency - Energy (ARPA-E) as a consultant with Booz Allen Hamilton, leading the LCA team there. Prior to that, he was a member of the LCA and Optimization team at ExxonMobil Research & Engineering.
Supported by a background in chemical engineering and process systems engineering, he has analyzed and optimized many energy systems to minimize environmental impact while maintaining profitability, including electricity and power, bioenergy systems, petrochemical systems (from extraction through refining and upgrading), carbon-negative building materials, agriculture, iron and steelmaking, EV batteries, and CO₂ removal technologies - specifically biomass carbon removal and storage (BiCRS).
Presidential Fellow
Northwestern University, 2017-2019
AIChE Sustainable Engineering Forum Student Paper Award
AIChE, 2018
Fellow
Institute for Sustainability and Energy at Northwestern (ISEN), 2015-2016
Ryan Fellow
International Institute for Nanotechnology, 2013-2015
Low-Carbon Fuels Get a Market-Based Reporting Home
What to Read Next
Scope 3.1 Emissions: How to Measure and Reduce Value Chain Impact
Key Takeaways
- Scope 3.1 emissions, purchased goods and services, can account for up to 67% of a company’s total carbon footprint, making them a critical category for measurement and action.
- Companies can reduce risk, meet stakeholder demands, and strengthen supply chain resilience by proactively managing scope 3.1 emissions.
- Relae empowers organizations to take meaningful action on scope 3.1 through science-based measurement, practical emissions management strategies, and deep supplier engagement.
What Are Scope 3 Emissions and Why Do They Matter?
Scope 3 emissions include all indirect greenhouse gas (GHG) emissions that occur across a company’s value chain. While scope 1 emissions are from directly owned or controlled activities, and scope 2 are indirect emissions from the generation of purchased electricity, heat, or steam, scope 3 emissions encompass upstream and downstream activities throughout the value chain.
Within scope 3, there are 15 categories, including activities such as raw material extraction, purchased services, shipping, business travel, product use, and end-of-life treatment. Critically, scope 3 emissions usually make up the majority of a company's total carbon footprint. Across sectors, CDP finds supply chain emissions average 26 times a company's operational emissions, and in supply-chain-heavy sectors like apparel, the share exceeds 95%.
Category 3.1 (purchased goods and services) is often the largest contributor. For many organizations, it can be as much as 67% of their total corporate footprint. Despite being outside a company’s direct operational control, scope 3 emissions are increasingly scrutinized by regulators, investors, and customers alike, making them essential to measure, manage, and reduce.
What Is Included in Scope 3.1 Emissions?
Scope 3.1 emissions capture all cradle-to-gate emissions associated with products and services procured by an organization. These include emissions from the extraction of raw materials, energy usage, manufacturing processes, waste, and transport and travel up to the point of delivery to the reporting company. As such, the types of activities within this category are quite extensive and disparate.
Examples of scope 3.1 items include:
- Raw materials (e.g., limestone, copper ore, lumber)
- Intermediate products (e.g., steel, electronic components, platform chemicals)
- Packaging materials
- Office supplies and equipment
- Professional services
- Cloud computing and software services
The size of scope 3.1 emissions varies widely by industry. For example, a consumer goods manufacturer sourcing large volumes of physical products may see a larger share of emissions in this category than the supplier providing the raw materials. For data centers that run on very low-carbon electricity, equipment and construction can account for 40% of lifetime emissions. For many organizations that are service-based or contract out manufacturing, scope 3.1 can be the most significant emissions category.
What Is the Strategic Value of Scope 3.1?
While scope 3.1 emissions fall outside a company’s direct operational control, they are not beyond its influence. Addressing emissions from purchased goods and services may open up a range of strategic benefits:
- Innovation opportunities through lower-carbon materials and production processes.
- Enhanced supplier relationships and engagement on shared sustainability goals.
- Improved resilience and risk mitigation across supply chains.
By assessing and acting on scope 3.1 emissions, companies can drive meaningful reductions and catalyze change throughout the entire supply chain.
What Are the Methods for Calculating Scope 3.1 Emissions?
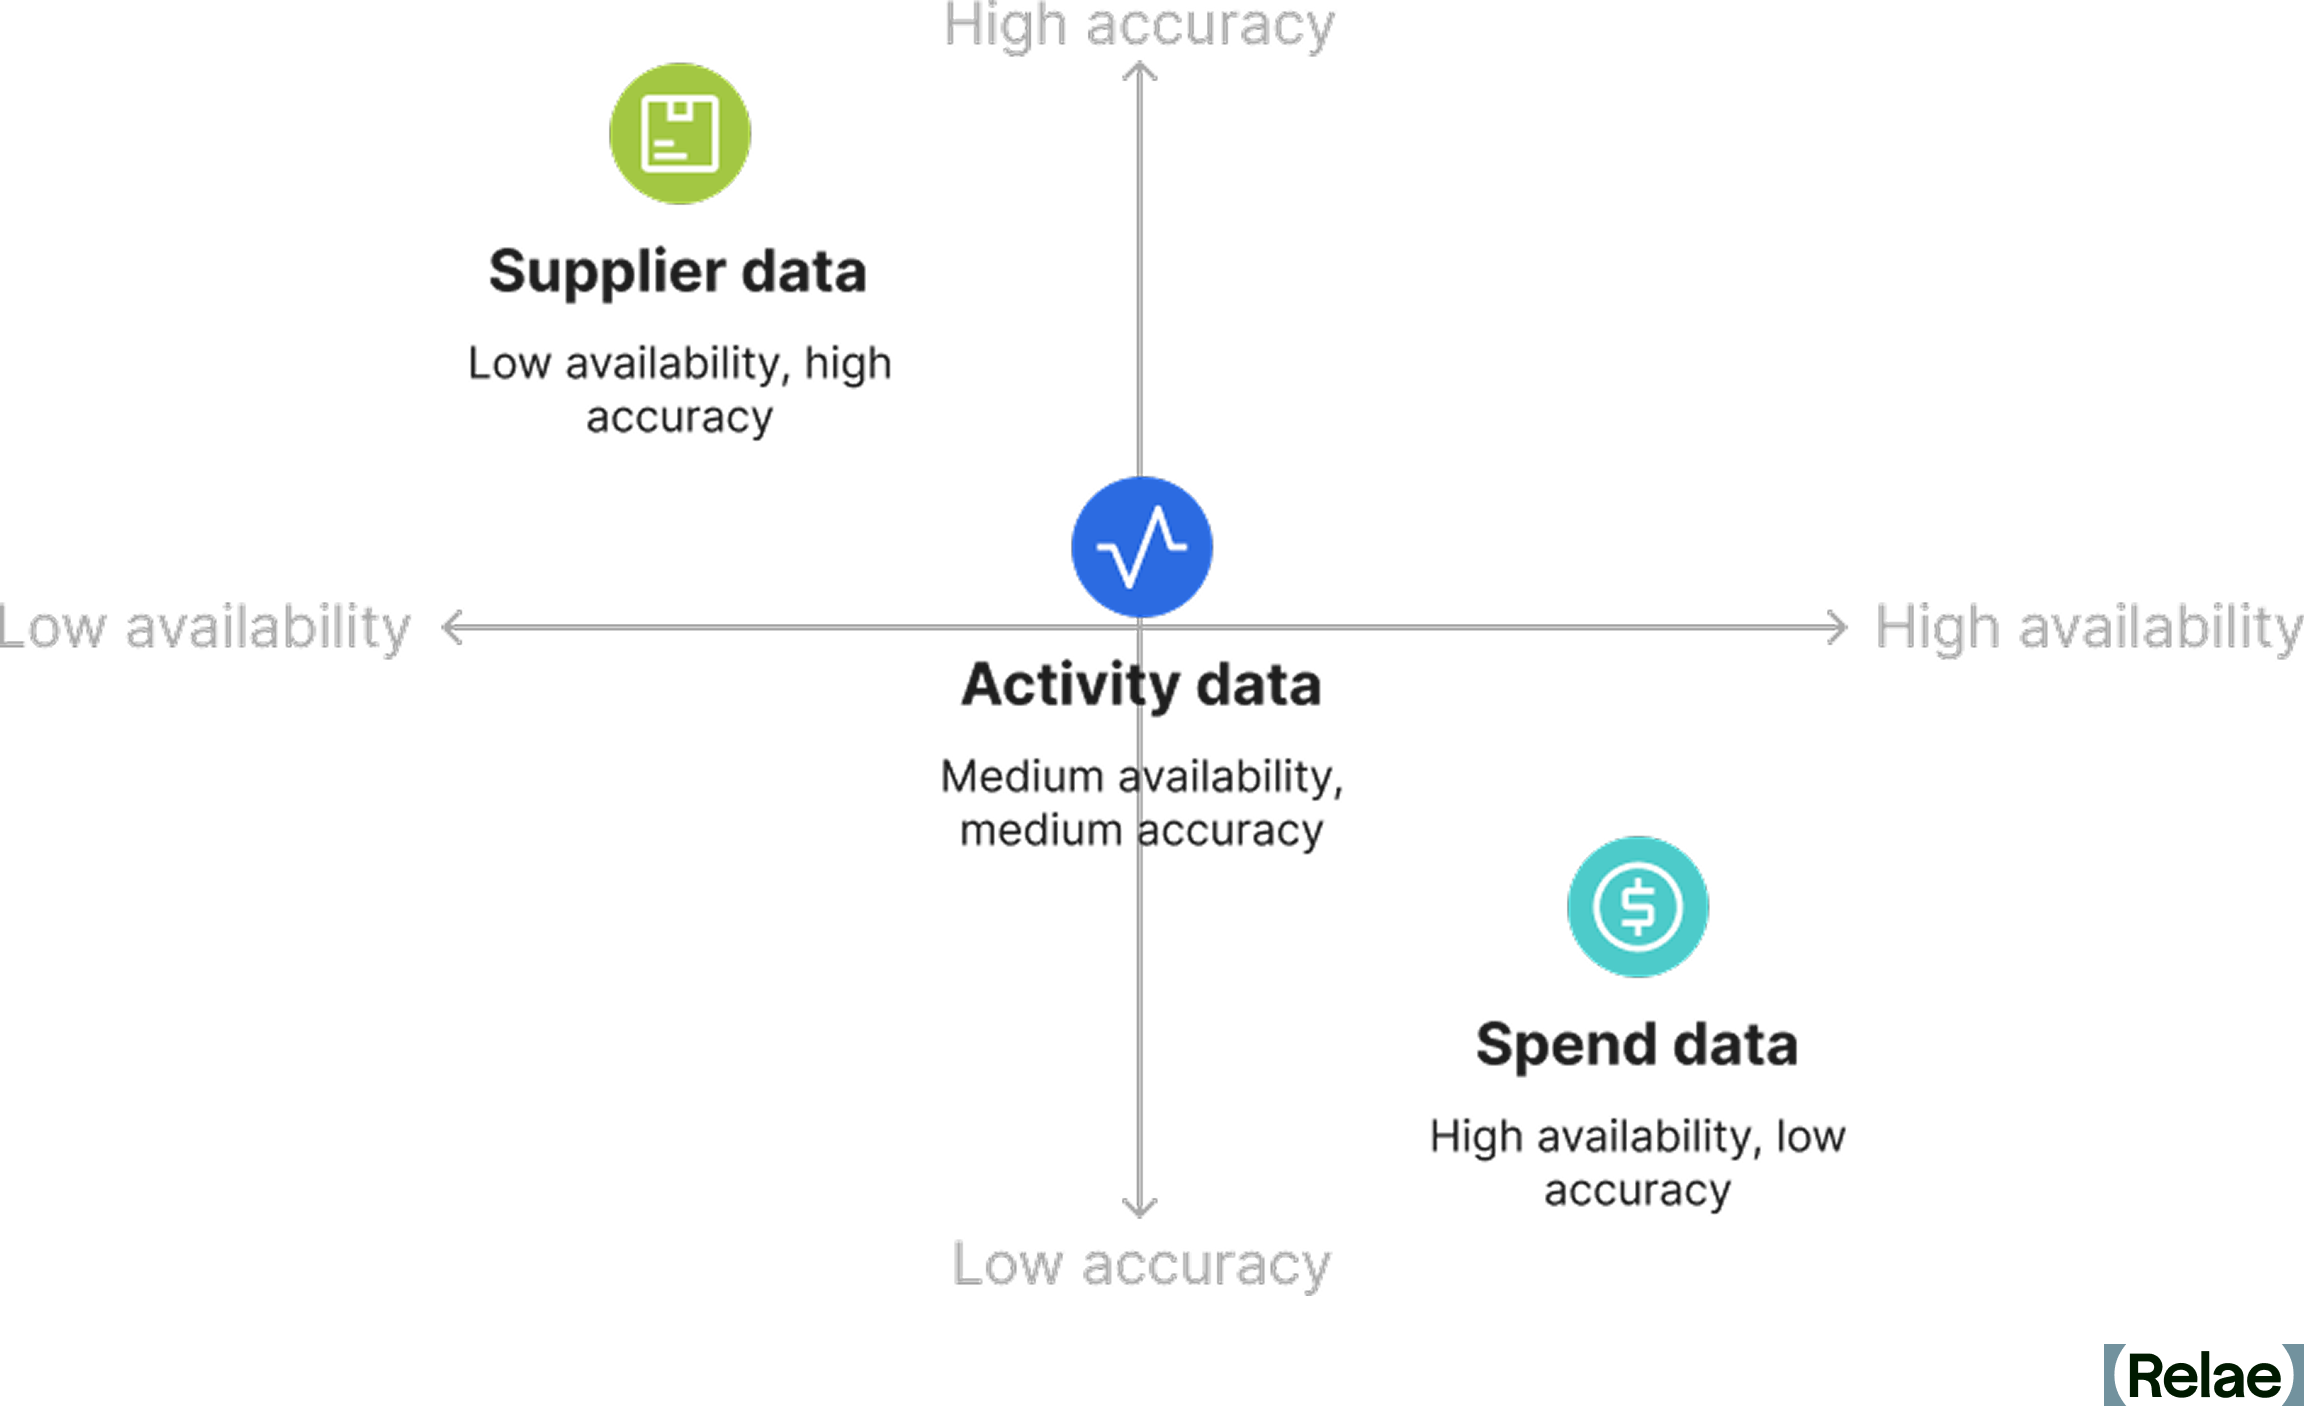
There are four methods to calculate scope 3.1 emissions based on the data collected. Each offers a different balance of speed, accuracy, and scalability.
1. The Spend-Based Method
This approach multiplies the amount of money spent on a good or service by an economic emissions factor (e.g., kg CO₂e per dollar spent). Most companies use this approach as a starting point but transition to more accurate methods as they advance in their sustainability journey.
Advantages
- Fast and scalable across categories
- Useful for initial hotspot identification
- Helps fill data gaps when activity data is unavailable
Limitations
- Lower accuracy, especially during periods of inflation or economic volatility
- Cannot reflect actual emissions reductions by suppliers
- Misalignment between price and emissions (e.g., high-cost items may not be high-emission)
2. The Average Data Method
This method uses average emissions factors for goods or services, based on industry datasets. For instance, industry life cycle assessments (LCAs) might be used to estimate the emissions associated with a kilogram of steel purchased.
Advantages
- More accurate than spend-based
- Suitable for companies refining emissions data to enable targeted reductions
Limitations
- Lack of raw data granularity
- Geographic variation limited
3. The Supplier-Specific Method
The supplier-specific method is the most accurate approach and involves collecting actual emissions data directly from suppliers. This includes LCAs, environmental product disclosures (EPDs), product carbon footprints (PCFs), supplier emissions reports, or Environmental, Social, and Governance (ESG) reports.
Advantages
- High accuracy and granularity
- Builds engagement with suppliers
- Enables tracking of supplier improvements over time
Limitations
- Challenging to scale across many suppliers
- Data may be confidential, inconsistent, or incomplete
- Requires continuous updating of supplier information
4. The Hybrid Approach
Adopting a hybrid approach allows many companies to maximize their data collection efforts by applying the supplier-specific method for high-impact purchases and using average or spend-based methods elsewhere. This tiered approach enables efficient use of resources while maintaining data quality for critical emission sources.
Where Can You Find Scope 3.1 Data?
Data for scope 3.1 emissions typically resides in procurement and finance functions. Purchase orders, invoices, and supplier contracts often contain critical information such as volume, product category, and spend. However, collecting, organizing, and analyzing this data can be resource-intensive, especially for companies with complex and global supply chains. Data type and availability play a key role in determining the method used for calculating emissions, impacting the accuracy and ability to reduce emissions.
What Are the Challenges in Measuring Scope 3.1 Emissions?
As most organizations will attest, measuring scope 3.1 has many challenges, from resource constraints to data availability. As organizations intensify their climate commitments, they are increasingly confronted with a range of technical, logistical, and strategic barriers that make accurate measurement and consistent reporting difficult. Understanding these roadblocks is critical to developing more resilient and impactful scope 3.1 measurement practices.
- Data availability and quality: Collecting high-quality data is often a bottleneck, with many organizations lacking the systems to track product-level or supplier-specific emissions. Without the proper tracking in place, emissions calculations rely on less accurate methods, making it difficult to reflect or meet reduction efforts.
- Supplier inconsistencies and allocation complexities: Even when suppliers share emissions data, the methodologies, boundaries, and underlying assumptions across them will vary widely. This adds an extra layer of difficulty to data aggregation. Additionally, the allocation of supplier emissions may vary based on the supplier’s chosen method, such as economic (based on spend and supplier revenue/emissions) or service-level (based on units purchased and supplier output/emissions). These inconsistencies can significantly affect reported totals, making it challenging to compare suppliers.
- Complex, multi-tiered supply chains: Upstream emissions can span multiple suppliers across different geographies and industries. Visibility often becomes cloudier beyond Tier 1 suppliers, making it difficult to account for emissions generated deeper in the value chain.
- Timing and synchronization: Aligning procurement, emissions calculation, and reporting cycles can be challenging. Delays in supplier disclosures or emissions factor updates can create reporting lags and misalignment.
Top Five Strategies to Reduce Scope 3.1 Emissions
Reducing scope 3.1 emissions requires balancing precise measurement with targeted action. This means identifying high-impact categories, collaborating with key suppliers, and harnessing available emissions data to improve accuracy and accountability. Here are five strategies organizations can use to start driving impact:
- Prioritize key categories and suppliers: Not all purchases contribute equally to emissions. Conduct a hotspot analysis to identify the highest-emitting goods or services and prioritize the top suppliers for engagement. Consider prioritizing the share of emissions, the share of procurement spend, and the current methodology type.
- Engage suppliers and set expectations: Encourage suppliers to measure and disclose their emissions, invest in LCAs or PCFs, and set their own science-based targets. Collaborative initiatives, such as supplier engagement programs, can support progress.
- Leverage readily available supplier reports: Many electronic companies, cloud providers, and industrial products provide detailed emissions data through EPDs, LCAs, and specific service emissions reports. For example, AWS and Google offer detailed emissions reports for data hosting and services. Leveraging these can help reduce uncertainty and improve accounting accuracy in software-heavy organizations. However, they should be utilized with caution, as some providers have faced scrutiny in 2026 for reporting efficiency gains without disclosing cloud-specific energy use or the growth in embodied hardware emissions behind it.
- Identify opportunities for low-carbon inputs: The same reports that help improve reporting accuracy can also provide more detail on the material inputs of purchased goods. This level of information can enable organizations to pursue opportunities for lower-carbon inputs to reduce emissions.
- Invest in centralized data systems: A centralized platform for carbon accounting data management can streamline emissions tracking, improve visibility, and enable scenario modeling. Several of the other strategies cannot be as effective without the right tools in place to manage this key information.
Turning Complexity Into Opportunity
Tackling scope 3.1 emissions may feel daunting, but it’s also where some of the biggest climate opportunities lie. By investing in better data, fostering supplier collaboration, and integrating sustainability into procurement practices, companies can unlock innovation, resilience, and long-term value. Organizations that lead on scope 3.1 will not only meet emerging disclosure standards but will shape the low-carbon supply chains of the future.
Frequently Asked Questions
What are scope 3 emissions, and why do they matter?
Scope 3 emissions are all the indirect greenhouse gas emissions in a company's value chain, everything from raw material extraction and purchased services to product use and disposal. They matter because they're usually the majority of a company's footprint. They also fall outside a company’s direct control, which makes them the hardest to measure and the most scrutinized by regulators and investors.
What is included in scope 3.1 emissions?
Scope 3.1 covers the cradle-to-gate emissions of everything a company buys, i.e. all emissions generated up to the point of delivery. That includes raw materials, intermediate goods like steel and electronic components, packaging, office equipment, professional services, and cloud computing. It captures the supplier's extraction, energy use, manufacturing, waste, and transport. It does not include emissions from using or disposing of your own products, which sit in other scope 3 categories.
What are the methods for calculating scope 3.1 emissions?
There are four. The spend-based method multiplies spend by an emissions factor per dollar, which is fast, scalable, and the usual starting point. The average-data method applies industry emissions factors to physical quantities, like kilograms of steel. The supplier-specific method uses actual supplier data such as LCAs, EPDs, or product carbon footprints, and is the most accurate. Most companies land on a hybrid, the final method, which takes supplier-specific data for high-impact purchases and uses estimates elsewhere.
How can companies reduce scope 3.1 emissions?
Start with a hotspot analysis to identify where emissions are coming from. This will usually show that a small share of suppliers and categories drives most of the footprint. From there, engage those suppliers on measurement and targets, use supplier reports and EPDs to replace estimates with real data, and use that detail to identify lower-carbon inputs. Centralized carbon accounting data makes each of these repeatable rather than a one-off exercise.
Do AI data centers' hardware purchases count as scope 3.1 emissions?
Yes, for a data center operator, servers and chips are purchased goods, and therefore count in scope 3.1.
Electricity Emissions Accounting: GHG Protocol and LCA Explained
Key Takeaways
- The GHG Protocol Corporate Standard and life cycle assessment (LCA) offer distinct frameworks for measuring electricity-related emissions, one for annual corporate reporting and one for detailed cradle-to-grave analysis, leading to different emissions results.
- Renewable energy certificates (RECs) are accepted under the GHG Protocol's market-based approach to reduce reported scope 2 and scope 3: category 3 emissions, but are not explicitly addressed in ISO LCA standards, where transparent disclosure is essential.
- Using both the GHG Protocol and LCA together, while recognizing their different scopes, boundaries, and purposes, can give organizations a more complete and strategic view of electricity-related emissions and decarbonization opportunities.
Electricity-Related Emissions: Why Measurement Methods Matter
In the era of AI-driven power demand, scrutiny over electricity-related emissions is intensifying. With this increased attention comes growing confusion around how to measure and report these emissions. The GHG Protocol Corporate Standard and life cycle assessment (LCA) are two widely used methods for measuring and reporting electricity-related emissions, but each follows its own complex and often incompatible, set of rules.
This piece will examine the differences between these approaches and answer common questions such as:
- What are the differences between the GHG Protocol Corporate Standard and LCA?
- Why do they result in different emissions for the same type and amount of electricity?
- Can renewable energy contracts reduce electricity-related emissions under both methods?
- When should you use each approach?
Both the GHG Protocol Corporate Standard and LCA are powerful tools that, if used in complementary ways, can help organizations identify emissions hotspots and develop more effective pathways for decarbonization.
What Is the GHG Protocol Corporate Standard?
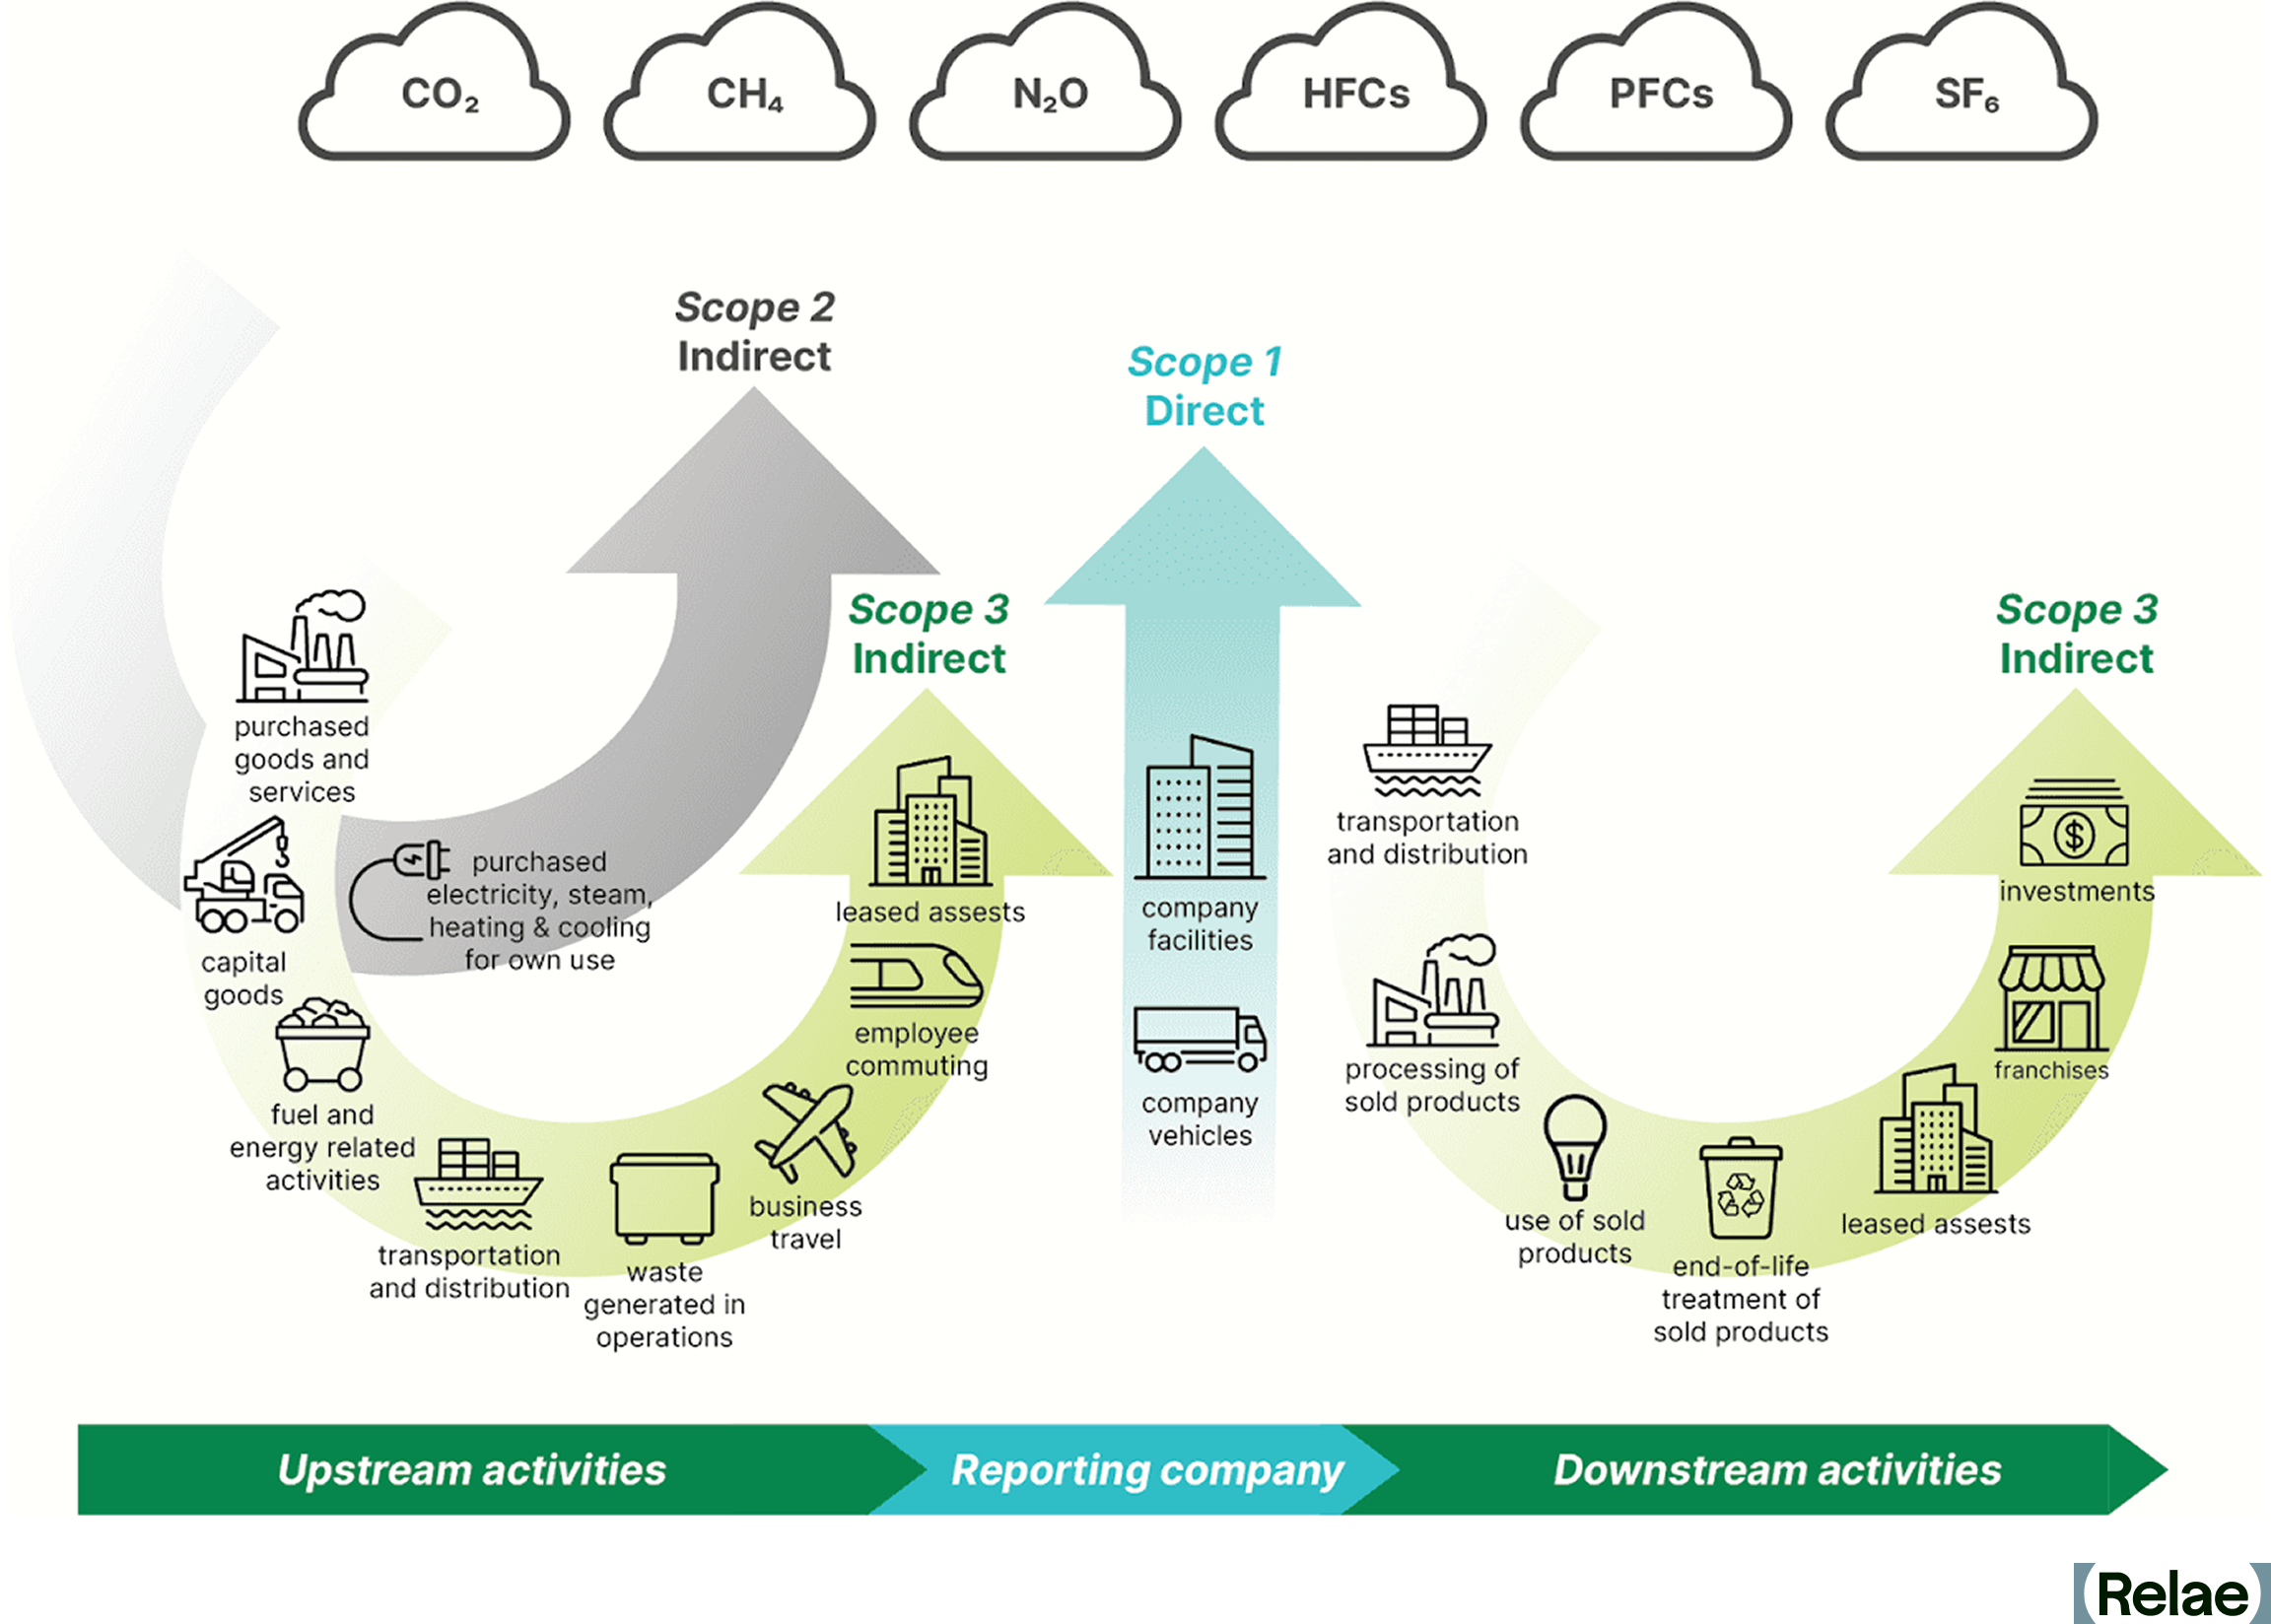
The GHG Protocol Corporate Standard is a globally recognized framework for corporate entities to publicly report GHG emissions throughout their value chain. It divides emissions into three scopes:
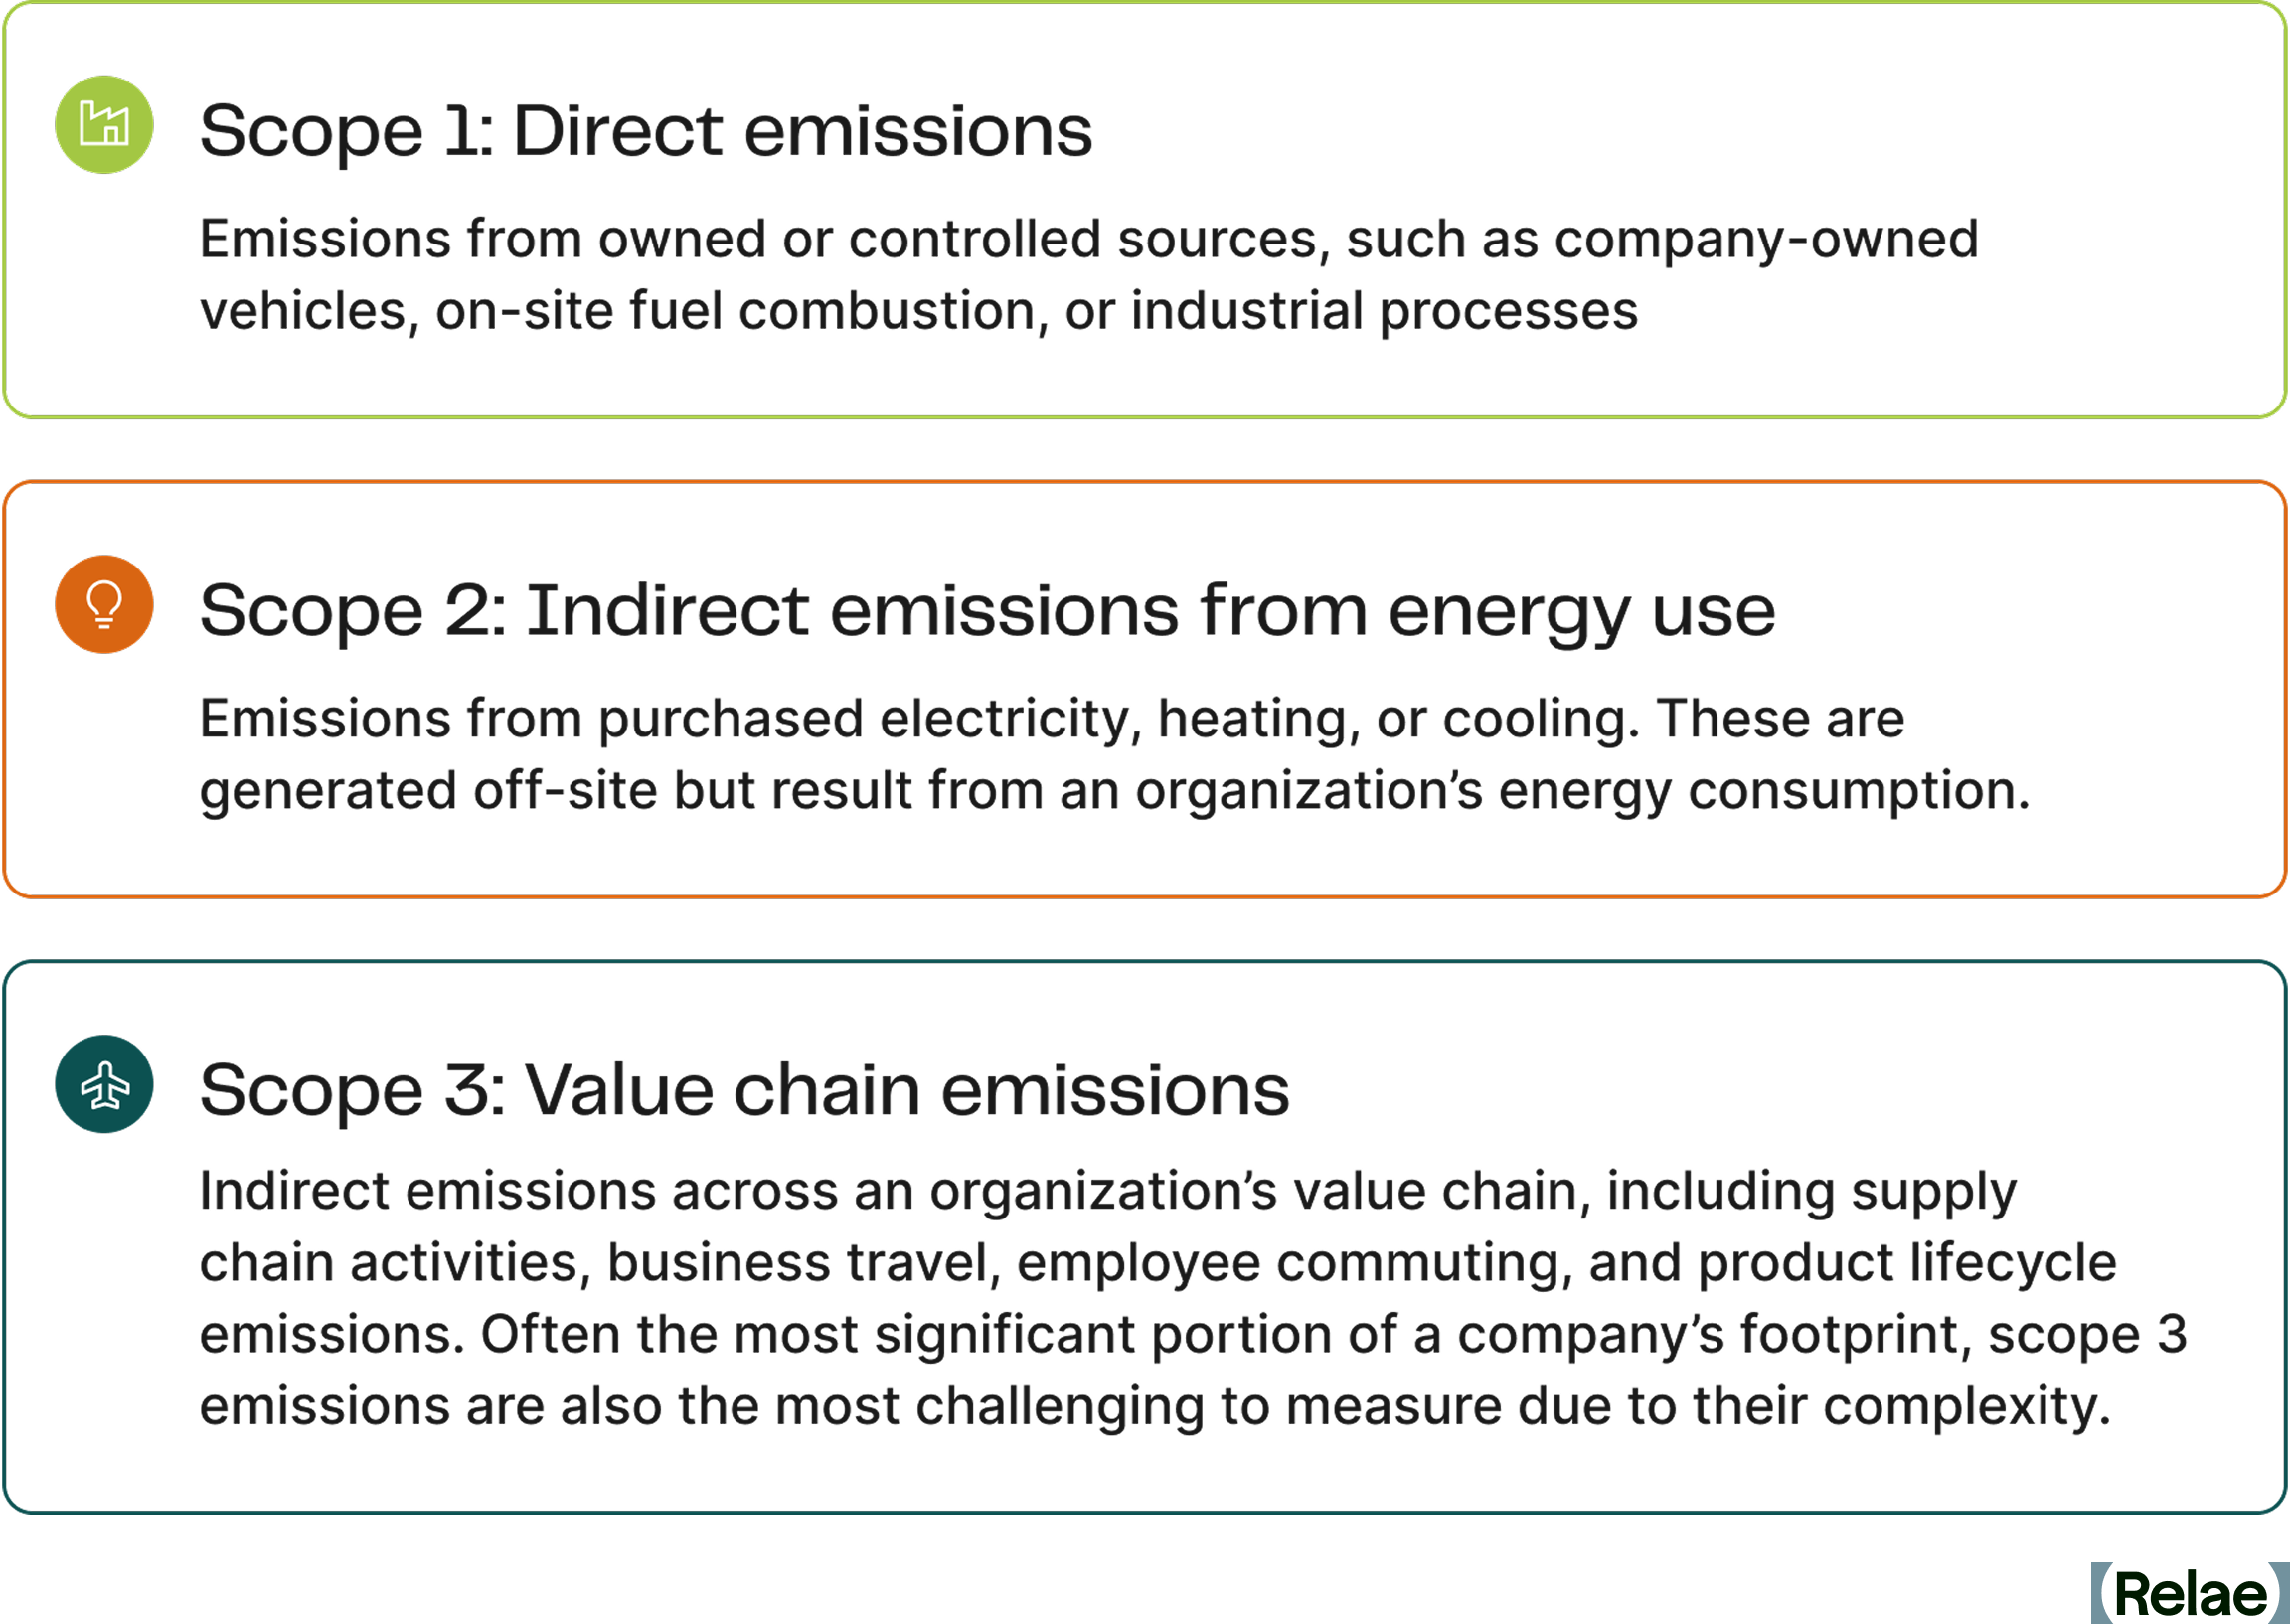
- Scope 1: Direct emissions from owned or controlled sources, such as company-owned vehicles, on-site fuel consumption, or industrial processes.,
- Scope 2: Indirect emissions from the generation of purchased electricity, heat, steam, or cooling. These emissions are generated off-site, but result from an organization's energy consumption.
- Scope 3: Indirect emissions across an organization's value chain. Scope 3 is divided into 15 categories, including a company's supply chain activities, business travel, employee commuting, investments, and product life cycle emissions.
This piece focuses on emissions associated with electricity consumed by a reporting entity. These electricity-related emissions primarily fall under scope 2 and scope 3: category 3 (fuel- and energy-related activities, or FERA).
Scope 2: Electricity Generation Emissions
Scope 2 emissions account for the generation of electricity a company purchases or uses. Hypothetically, if a company were powered by a single solar project, it would report zero scope 2 emissions. In reality, a company is powered by a combination of power generation assets and must report them under scope 2 emissions. These emissions can be reported using two methods:
- Location-based method: Reflects the average emissions intensity of the local electricity grid where the consumption occurs. This approach is mandatory under various reporting frameworks and does not take into account a company's procurement choices.
- Market-based method: Reflects an organization's actual procurement decisions and energy-sourcing strategies. It accounts for specific contracts, such as power purchase agreements (PPAs), renewable energy certificates (RECs), and green tariffs, which allow businesses to claim lower emissions from their purchased electricity.
Scope 3: Category 3 FERA
Scope 3: category 3 FERA reports on non-generation electricity emissions associated with:
- Upstream emissions: Emissions associated with the production and transportation of fuels needed for electricity generation
- Transmission and distribution losses: Emissions associated with the loss of electricity while delivering it from the generator to the consumer.
The GHG Protocol Corporate Standard does not include emissions associated with the manufacturing, construction, and end-of-life phases of electricity generation equipment; however, some datasets used for reporting may include manufacturing emissions. While scope 3: category 3 guidance may not require these emissions to be included, if possible, companies reporting on their electricity-related emissions should include these additional sources of emissions in order to more completely represent their total emissions impact. The GHG Protocol Scope 2 Guidance allows for the reduction of some of the reported scope 3 FERA emissions by contracting renewable energy (see Appendix B).
What is an LCA?
An LCA is a systematic method used to quantify the environmental impacts of a process, product, or project throughout its full life cycle. A life cycle includes everything from raw material extraction ("cradle") to manufacturing/production ("gate") through disposal ("grave").
LCAs primarily follow a standard published by the ISO organization (ISO 14040/14044). The ISO standards establish industry-wide rules for which processes are included and how to assign environmental burdens to products.
An LCA can be used for any product, process, or project, and can estimate multiple different environmental impacts (i.e., climate change, human health, ecotoxicity, eutrophication, ozone depletion).
Electricity-Related Emissions Can Be Different Using the GHG Protocol and an LCA
The GHG Protocol Corporate Standard and an LCA (as per ISO standards) generally include different life cycle stages of electricity use when estimating GHG emissions. Therefore, the approaches can result in different reported emissions.
Key Differences in Reporting Electricity-Related Emissions
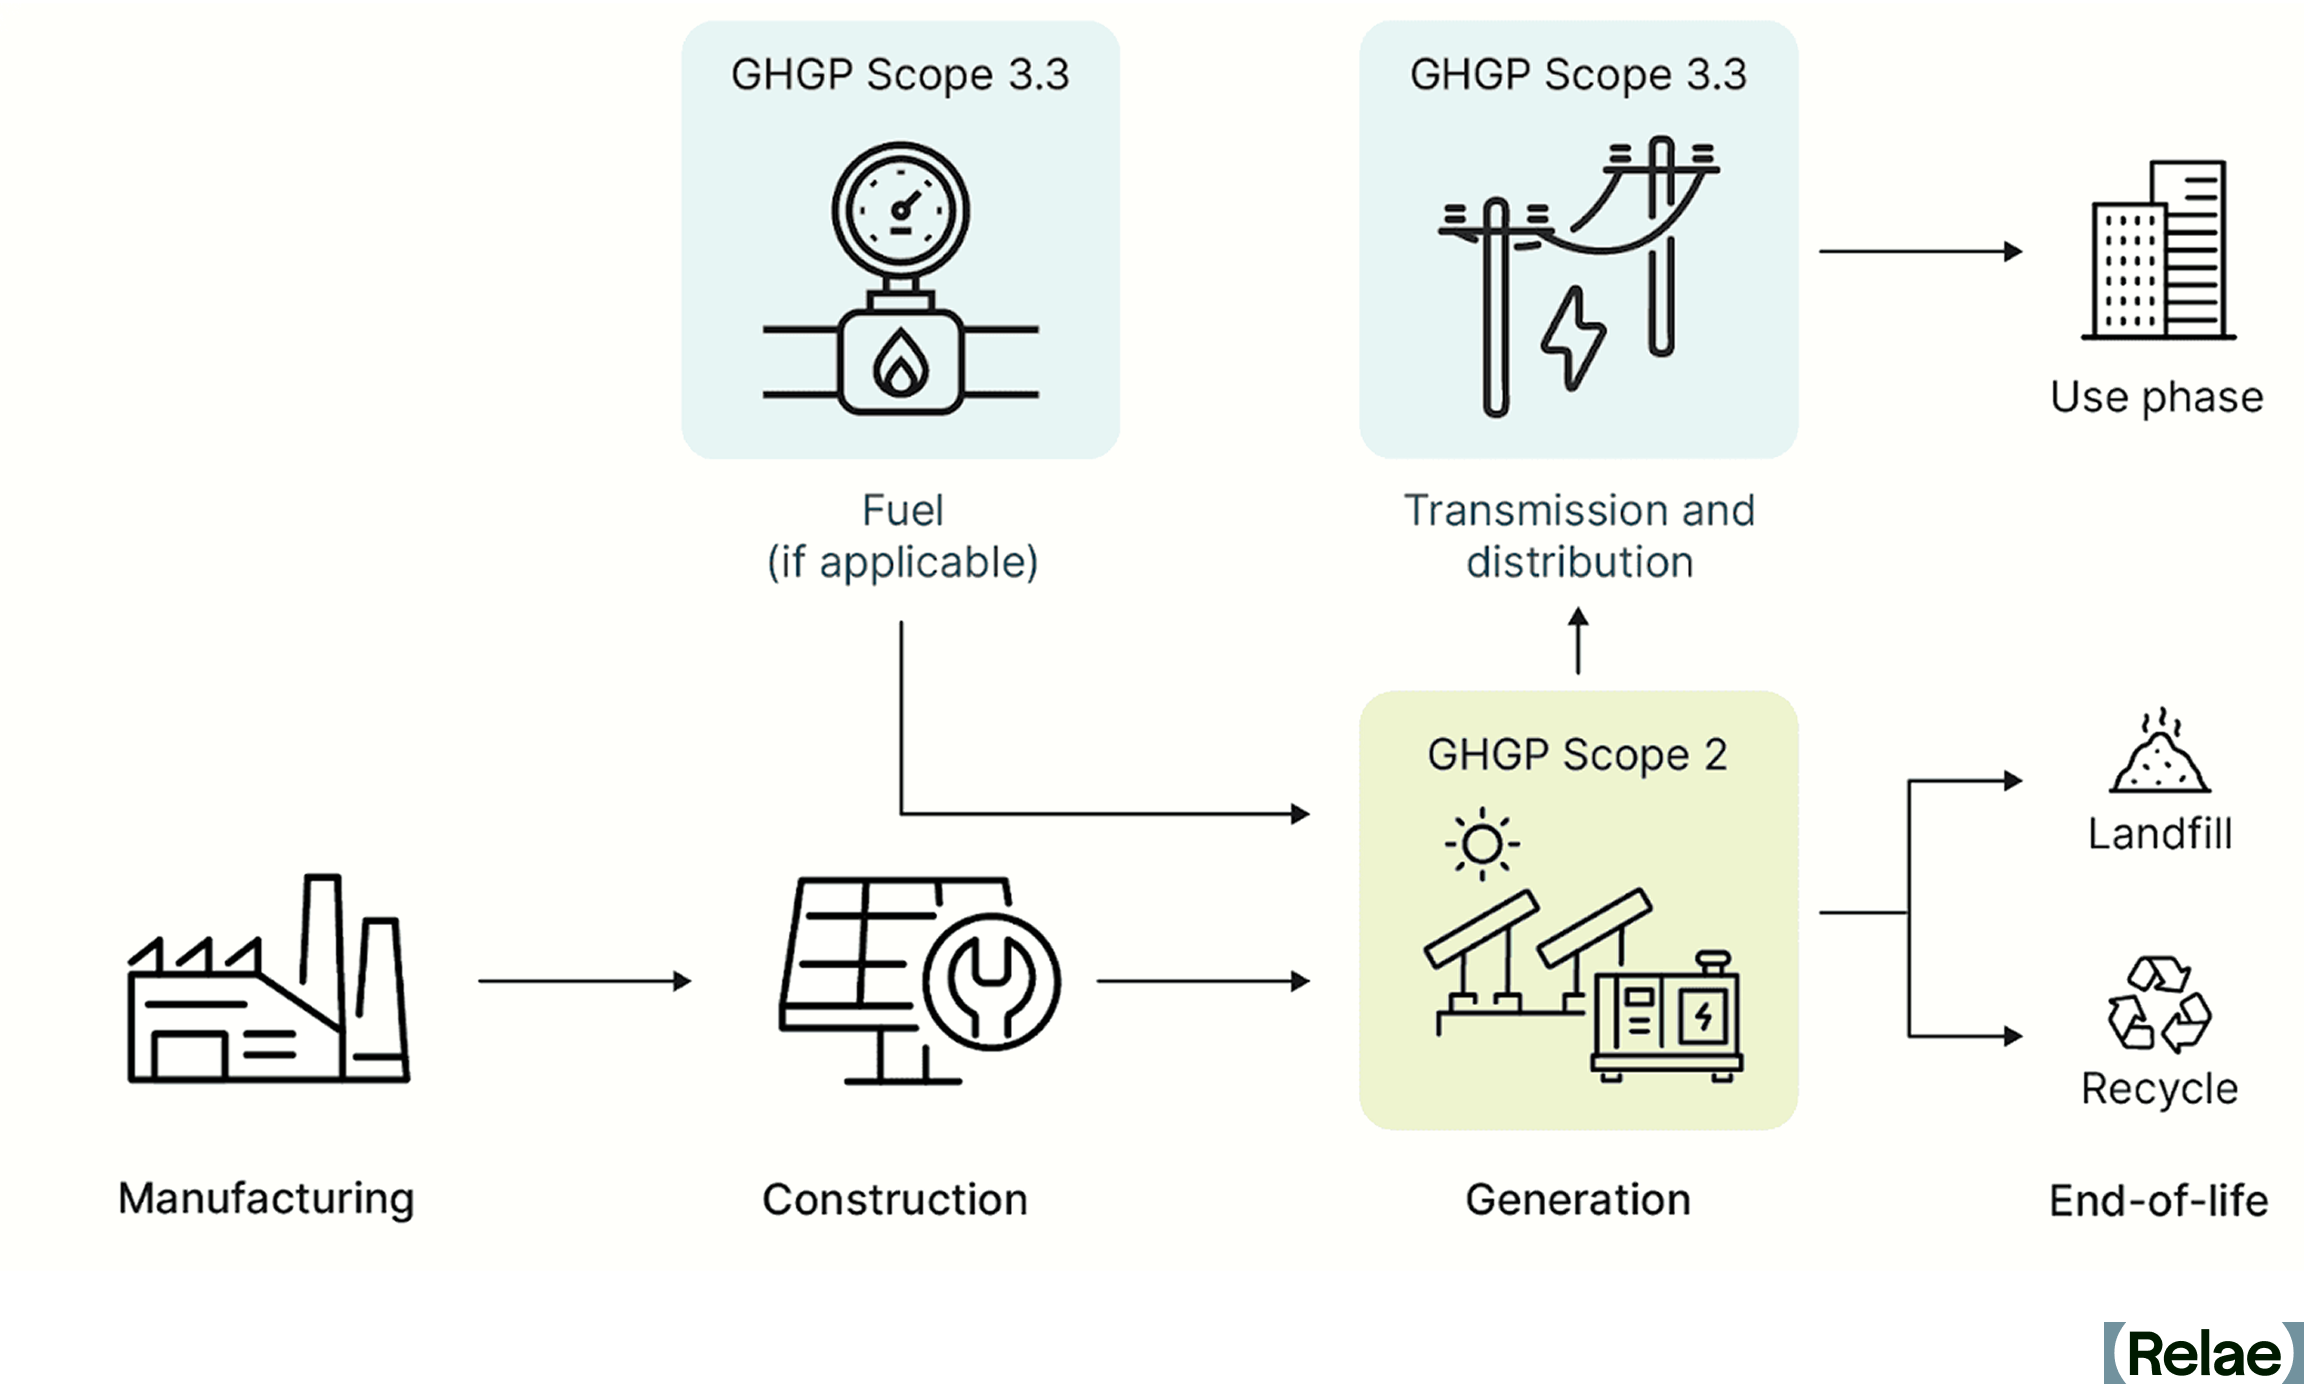
The GHG Protocol Corporate Standard includes emissions in the following phases:
- Generation (scope 2)
- Transmission and distribution losses (scope 3: category 3)
- Fuel, if applicable (scope 3: category 3)
A “cradle-to-grave” LCA considers emissions from all activities associated with power generation, including:
- Manufacturing
- Construction
- Generation
- Fuel, if applicable
- Use-phase, if applicable
- End-of-life
Use-phase electricity-related emissions are emissions generated by electricity-consuming equipment used or sold by the reporting company (representing additional scope 1 or scope 3 emissions, respectively). Examples include sulfur hexafluoride (SF6) emissions from electrical transformers or refrigerant leakage from air conditioners with high global warming potential. Please note that both the ISO and GHG Protocol Corporate Standard provide guidelines for reporting these emissions. However, due to the equipment-specific nature of these emissions, they are excluded from the following table. The table compares electricity-related emissions associated with different electricity sources using the GHG Protocol Corporate Standard approach and the LCA approach.
Reporting Electricity-Related Emissions
* US average transportation and distribution loss rate (4.2%) times US average grid carbon intensity (410 gCO2e/kWh). Note: gCO2e/kWh = grams of carbon dioxide equivalent per kilowatt-hour. Source: GREET 2024 (US grid average. 10% fuel- and energy-related activities; 1% construction, facilities, maintenance, and end-of-life; 89% fuel combustion).
Reducing Electricity Emissions with Renewable Energy
Renewable Energy Mechanisms Under the GHG Protocol
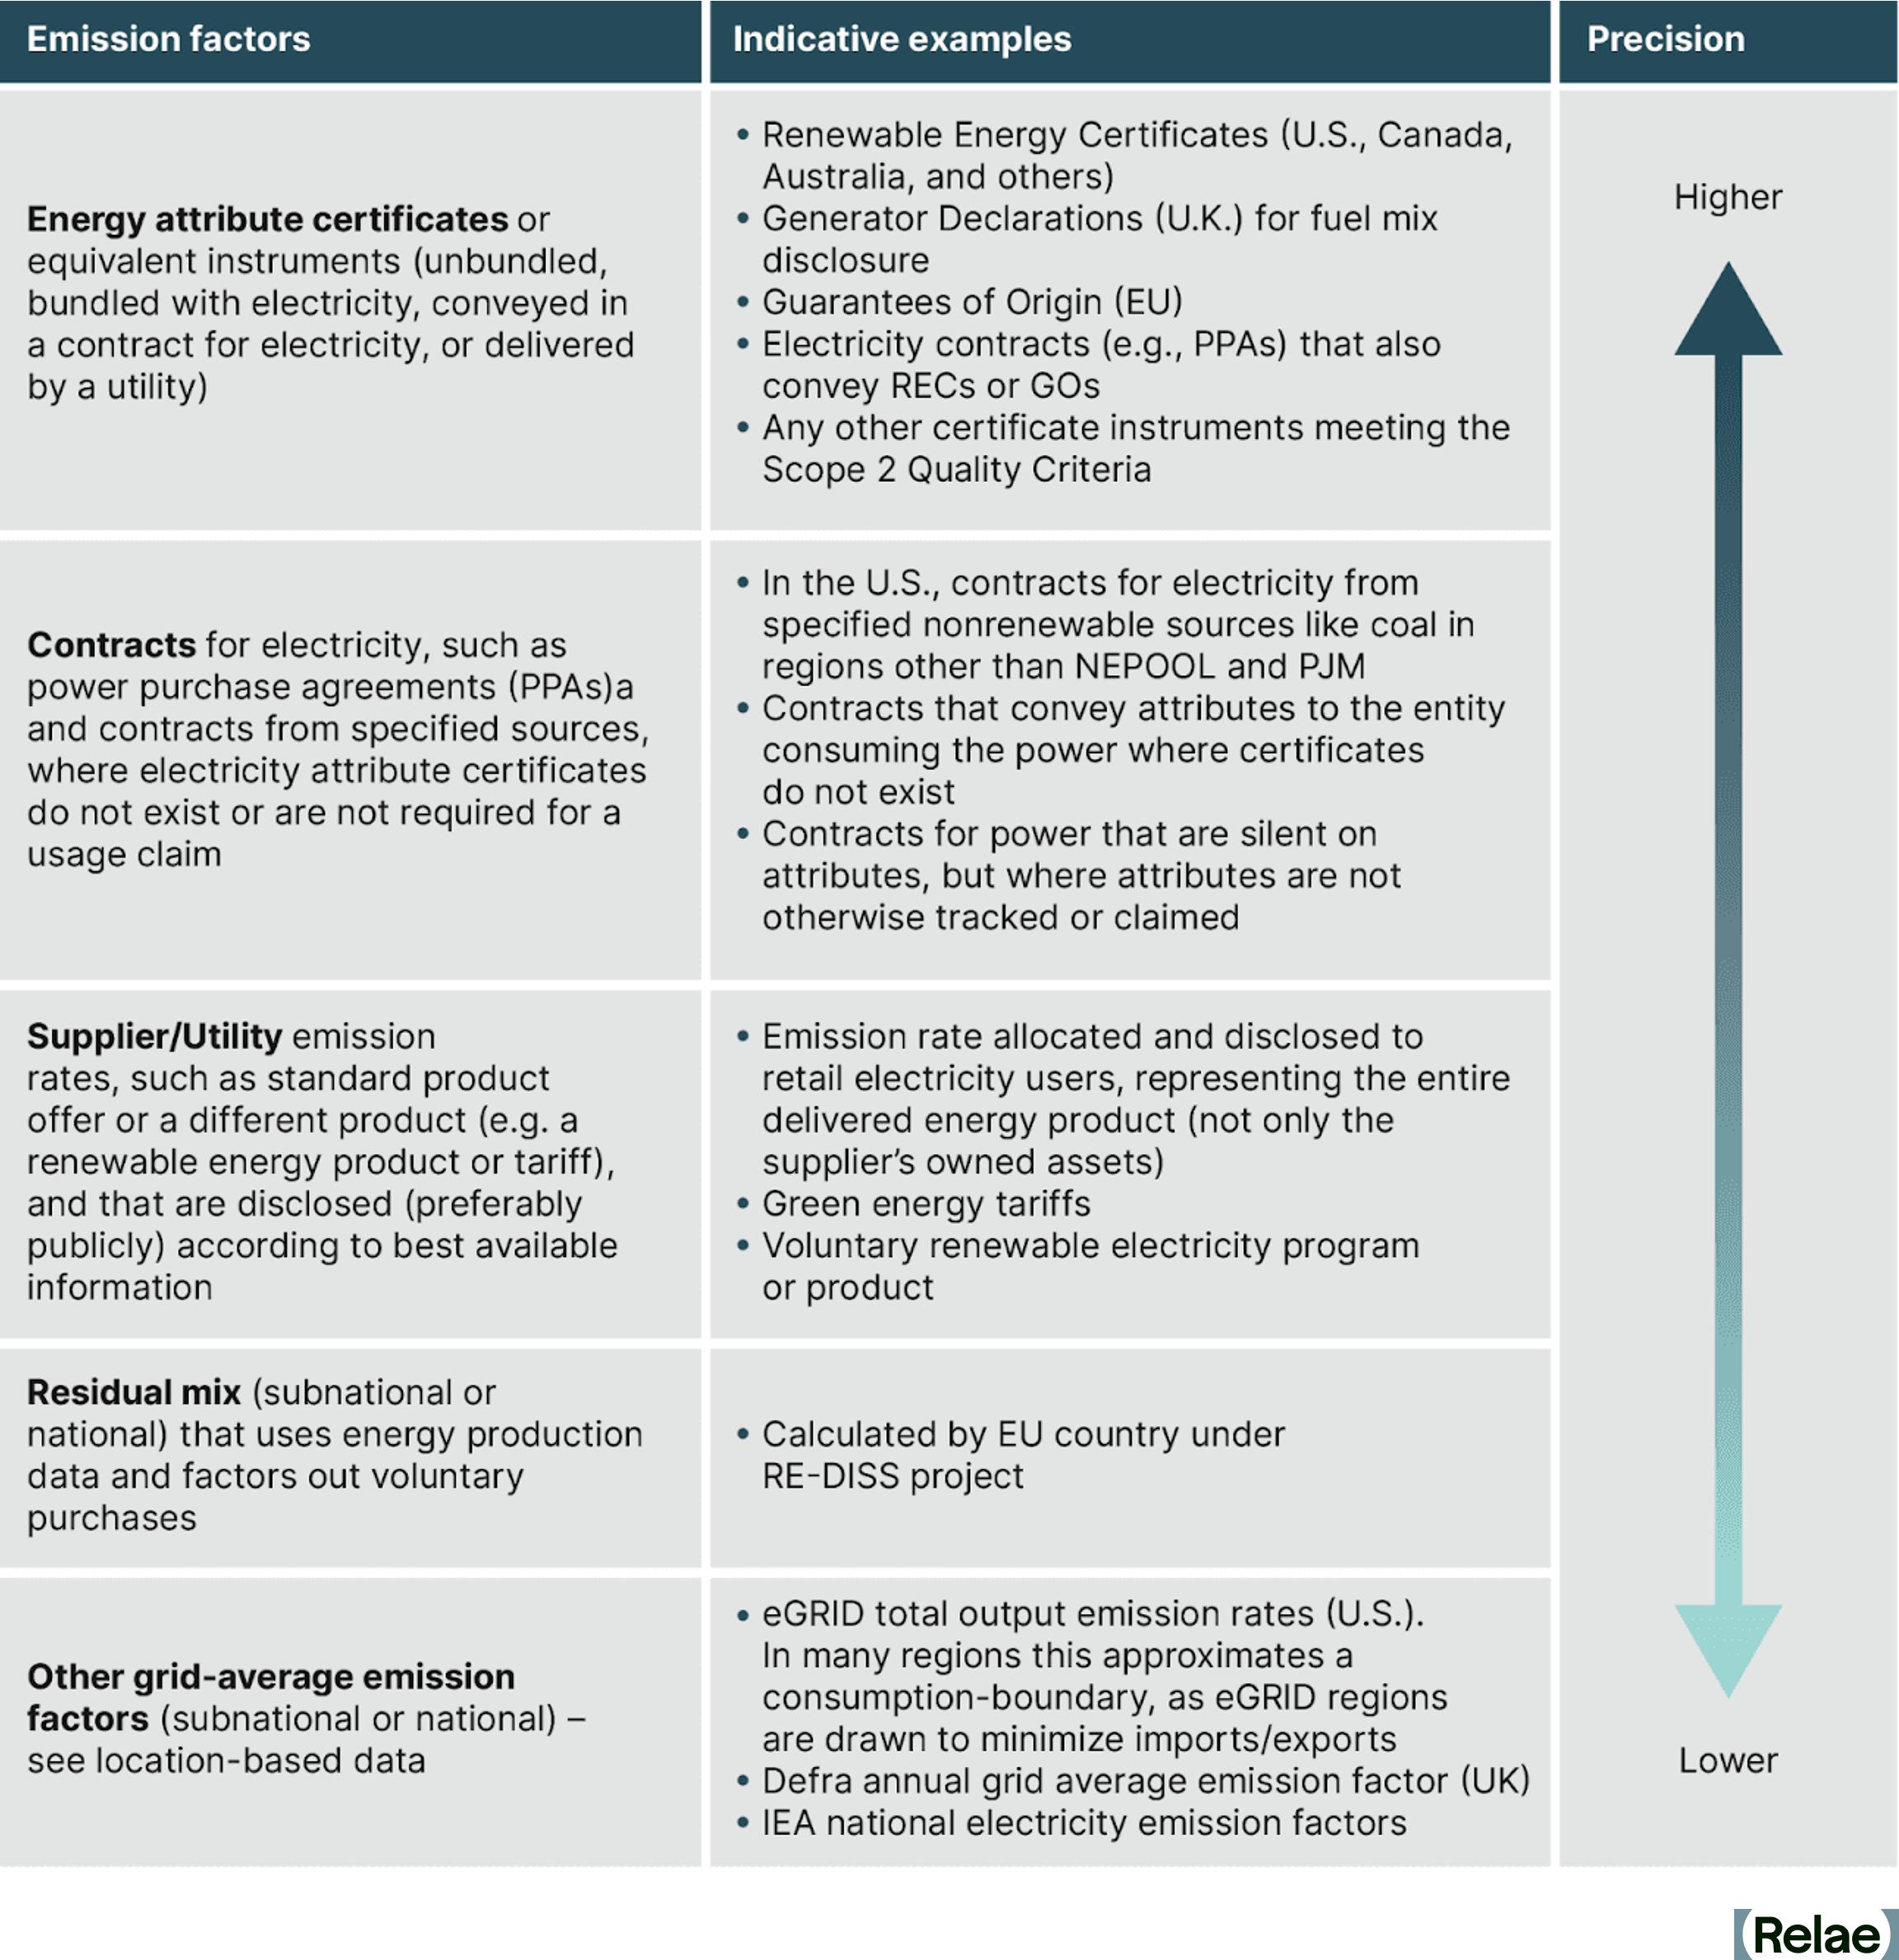
The GHG Protocol Corporate Standard allows companies to contract for renewable electricity as a mechanism to reduce reported emissions. The GHG Protocol Corporate Standard defines allowable energy contracts that can be used to reduce emissions associated with electricity consumption (market-based reporting).
In North America, one of these allowable contracts is RECs, each of which represent one megawatt-hour of renewable generation. Analogous instruments used in other locations, such as Guarantees of Origin in Europe and green electricity certificates in China, are also permissible under the GHG Protocol Corporate Standard.
RECs were developed as a contractual mechanism for renewable electricity in response to the fundamental structure of "a power grid." In a power grid, it is impossible to link a single generator to a single load. Power is injected at a point in the grid and withdrawn at a different point in the grid; there is no traceable pathway.
RECs were created to track the attributes of electricity generation entering into a power grid for the entity that consumes the power at a different point. The GHG Protocol Corporate Standard allows buyers to claim exclusive use of renewable electricity with RECs even if they are actually consuming a mixture of electricity from the grid.
Renewable Energy Mechanisms Under the LCA ISO Standard
The ISO 14040 standard does not address the use of renewable electricity contracts. However, the ISO 14044 standard provides the following guidance:
"When determining the elementary flows associated with production, the actual production mix should be used whenever possible, in order to reflect the various types of resources that are consumed. As an example, for the production and delivery of electricity, account shall be taken of the electricity mix, the efficiencies of fuel combustion, conversion, transmission and distribution losses."
It does not explicitly define whether RECs can or cannot be used in the determination of the "actual production mix." In the event an organization does procure a renewable energy contract to reduce the emissions reported within the LCA, it should disclose that clearly in order to communicate the impact of the contract on the carbon intensity of the LCA with and without the use of RECs.
Powerful Tools for Different Use Cases
The GHG Protocol Corporate Standard and LCAs following the ISO Standard are both powerful tools that can provide insight into emissions associated with electricity use. The GHG Protocol Corporate Standard allows companies to use a standardized framework to report emissions associated with electricity use and interventions on an annual basis. The LCA ISO standard is a detail-driven analysis that allows a deep dive into specific processes, projects, or products. This detailed analysis allows for deeper insights into areas where a company may have more ability to address specific interventions for emission hot spots. Using these tools together, while understanding the boundaries of each, can provide companies with a more effective and impactful approach to decarbonization.
Frequently Asked Questions
What are the differences between the GHG Protocol Corporate Standard and LCA?
The GHG Protocol is an annual corporate reporting framework covering scope 2 (generation) and scope 3: category 3 (transmission and distribution losses, fuel), while a cradle-to-grave LCA is a detailed analysis governed by ISO 14040/14044 standards that also includes manufacturing, construction, use-phase, and end-of-life emissions. LCA can also be applied to any product or process and multiple environmental impacts, not just greenhouse gas emissions.
Why do they result in different emissions for the same type and amount of electricity?
They include different life cycle stages. The GHG Protocol excludes manufacturing, construction, and end-of-life emissions of generation equipment, while an LCA includes them.
Can renewable energy contracts reduce reported electricity-related emissions under both methods?
Under the GHG Protocol, renewable energy contracts (e.g., RECs, PPAs) are explicitly allowed to report zero market-based scope 2 emissions, though scope 3 FERA emissions remain. Under ISO LCA standards, these contracts aren't explicitly addressed. Organizations may choose to apply them, but should transparently disclose LCA results both with and without the contract's impact.
When should you use the GHG Protocol vs an LCA?
Use the GHG Protocol for standardized, annual corporate-wide emissions reporting and tracking procurement interventions; use an LCA for a detailed, process- or product-specific deep dive to identify specific emissions hotspots. Relae recommends using both together for a more complete, strategic view of electricity-related emissions.
Scope 1 Emissions Explained: How to Track, Report, and Reduce Operational Carbon
Key Takeaways
- Scope 1 emissions are direct and controllable, making them a powerful starting point for decarbonization.
- Reducing scope 1 emissions can improve energy efficiency and lower operating costs.
- Reporting on scope 1 emissions is now required under new climate regulations, and companies that act now will gain an edge.
Why Scope 1 Emissions Matter Now
When we talk about corporate decarbonization, scope 2 and scope 3 emissions tend to take up the headlines, with a focus on renewable energy certificates (RECs) or challenges like complex supply chains. But scope 1 emissions, those produced directly from sources a company owns or controls, don’t get as much airtime. This is a missed opportunity.
As AI data center growth pushes companies towards on-site power, more organizations are confronting scope 1 boundaries for the first time. Scope 1 emissions enable companies to take immediate, tangible action to cut carbon, drive operational efficiencies, and get ahead of growing regulatory pressure.
What Are Scope 1 Emissions?
Scope 1 emissions are the direct greenhouse gas (GHG) emissions from sources that a company owns or controls. They mostly come from activities where fuels are combusted on-site within an organization’s operations. For industries that combust high amounts of fuels within their operations (e.g., oil and gas, chemicals, manufacturing), scope 1 can represent a significant share of the company’s emissions. For industries that outsource most of their production, scope 1 can be a smaller share of the overall footprint.
Scope 1 emissions typically fall into four categories:
- Stationary combustion: Emissions from burning fuels on-site for heating, manufacturing, or electricity generation. This includes boilers, furnaces, and turbines at company facilities.
- Mobile combustion: Emissions from company-owned or operated vehicles and equipment, such as cars, aircraft, delivery fleets, ships, or construction machinery.
- Fugitive emissions: Unintentional leaks or releases of gases, often from refrigeration and air conditioning systems. These can have an outsized impact because many refrigerants have global warming potentials (GWPs) hundreds or even thousands of times greater than carbon dioxide.
- Self-produced energy: Emissions from electricity, heat, or steam generated on-site, such as through natural gas-fired generators or cogeneration plants, even when the energy is used internally.
Identifying and categorizing scope 1 emissions correctly are the first steps toward uncovering potential operational improvements and carbon reduction approaches.
On-Site Power for AI Data Centers
As AI pushes data center operators toward on-site (“behind-the-meter”) power, a high-stakes accounting question follows: are those behind-the-meter emissions scope 1 or scope 2? The answer comes down to control, not location.
Under the GHG Protocol, emissions from on-site generation are scope 1 only when the reporting company owns or financially controls the generating asset (i.e., the self-produced energy category above). In most data center power deals, a third party owns and operates the generator and sells the electricity to the data center. In that structure, the company buying the power reports the emissions as scope 2, and the company generating the power reports the combustion as scope 1. Given the growth in emissions from the scale of AI infrastructure, getting the boundary right matters for corporate credibility.
Why Scope 1 Emissions Are a Strategic Priority
While scope 3 is often talked about as the largest source of emissions for corporations, that isn’t the case for all industries. For heavy sectors like oil and gas, chemicals, and manufacturing, scope 1 emissions aren't just significant - they are the bedrock of the emissions story. Other industries depend on these sectors' outputs to operate their own businesses, meaning that decarbonizing heavy industries’ scope 1 emissions can also drive reductions across other organizations’ scope 3 emissions.
Since scope 1 emissions are typically within a company’s direct operational control, they present a great starting point for decarbonization. Unlike scope 3 emissions, which require influencing suppliers, customers, or partners, companies can take immediate action on scope 1 sources. Even for industries with relatively small scope 1 footprints, reductions can often happen more quickly through internal decisions, such as equipment upgrades, process improvements, or fuel switching.
Regulatory momentum is also making scope 1 management increasingly urgent. Policies like the European Union’s Corporate Sustainability Reporting Directive (CSRD), California’s Climate Corporate Data Accountability Act (SB 253), and global ISSB-aligned frameworks are requiring companies to measure and publicly disclose their scope 1 emissions. Even within voluntary frameworks, reporting on scope 1 emissions is getting tighter. Within the Science-Based Targets Initiative (SBTi)’s new draft Net Zero Standard, scope 1 emissions must now have a separate target from scope 2 emissions, and the boundary must cover 100% of scope 1 emissions whereas previously the boundary was 95% of emissions. These market shifts highlight the importance of reducing scope 1 emissions.
Operationally, reducing scope 1 emissions offers business value. Many scope 1 reduction strategies, such as upgrading to more efficient equipment or reducing fuel waste can lower energy bills, improve asset performance, and reduce maintenance costs. For companies focused on both sustainability and profitability, targeting scope 1 emissions delivers a strong return on investment.
How to Calculate Scope 1 Emissions
To reduce scope 1 emissions, companies need to know exactly what and how much they are emitting. Calculating scope 1 emissions starts with gathering the right data at the facility level and understanding the activities that generate emissions.
What to Measure
Scope 1 emissions come from activities such as fuel combustion in boilers or vehicle fleets, refrigerant leaks from cooling systems, and on-site energy generation. Ideally, companies should collect activity data, like gallons of diesel used, cubic meters of natural gas consumed, or kilograms of refrigerant leaked and replaced. In cases where direct measurement isn’t possible, companies often rely on estimations, using financial spend data or industry intensity metrics as a proxy for fuel consumption.
Where to Find the Data
Facility-level data is the backbone of comprehensive and comparable scope 1 accounting. Much of the required data can be sourced from utility bills, fuel receipts, maintenance logs for HVAC and refrigeration systems, and reports from on-site equipment operators. Increasingly, companies are deploying sensors to capture real-time data on fuel consumption, refrigerant leaks, and on-site energy generation, improving both accuracy and responsiveness.
How to Calculate the Emissions
Emissions are calculated by applying the emissions factors (i.e., the amount of greenhouse gases emitted per the quantity of fuel or refrigerant) to the collected activity data. Many companies use carbon accounting software to automate calculations, track emissions over time, and ensure consistency with recognized standards like the GHG Protocol. Expert support is often critical, especially for sectors with complex operations. Carbon accounting experts help ensure the data is complete, auditable, and aligned with evolving regulatory requirements.
Accurate scope 1 data builds a strong foundation for compliance as well as for setting credible reduction targets and tracking long-term performance.
How to Reduce Scope 1 Emissions
With scope 1 emissions data in hand, companies can begin identifying and implementing reduction strategies. Because these emissions are within the organization’s operational control, companies often have multiple levers they can pull.
Operational Strategies
- Fuel switching: Replacing fossil fuels like natural gas or diesel with lower-carbon alternatives, like green hydrogen or renewable electricity, can significantly reduce direct emissions from stationary and mobile combustion. Depending on the switch, this could result in higher scope 2 emissions, but these can be more readily addressed through market-based instruments, thus lowering the overall footprint.
- Equipment upgrades: Modernizing boilers, generators, fleets, and other combustion-based equipment can improve energy efficiency and cut emissions. Newer technologies often perform better and emit less.
- Process innovation: In emissions-intensive industries like cement and steel production, rethinking industrial processes can yield dramatic reductions. Low-carbon production methods are increasingly becoming commercially viable.
- Leak detection and repair: Methane leaks from oil and gas operations and refrigerant leaks from cooling systems are major contributors to scope 1 emissions. Deploying monitoring technologies and maintaining rapid-response repair programs can fix leaks before they lead to large amounts of emissions.
Strategic Procurement
- Vendor selection: Companies can prioritize suppliers that offer lower-emissions alternatives for fuels, materials, and services.
- Fleet electrification: Procuring electric vehicles for delivery, service, and logistics fleets reduces both emissions and long-term fuel and maintenance costs.
- Equipment design: Working with suppliers to source modular, emissions-efficient machinery can reduce on-site fuel use and improve flexibility over time.
Driving Innovation Through R&D
- Low-carbon products: Research and development teams can design products and processes that inherently require less energy, or lower-carbon energy, to produce, lowering scope 1 emissions at the source.
- Material innovation: Developing new chemistries or alternative materials can avoid high-emission production methods, contributing to broader decarbonization goals.
- Closed-loop systems: Designing circular, waste-reducing systems can minimize both raw material use and the on-site emissions associated with production and disposal.
Reducing scope 1 emissions often requires up-front investment, whether it’s upgrading equipment, switching to alternative fuels, or embedding low-carbon principles into procurement and R&D strategies. While the initial costs can be substantial, they deliver long-term value through improved operational efficiency, reduced regulatory risk, lower energy expenses, and enhanced brand value in a marketplace that increasingly rewards climate leadership.
Frequently Asked Questions
What are the main categories of scope 1 emissions?
Scope 1 emissions fall into four categories: stationary combustion (fuels burned on-site in boilers, furnaces, or turbines), mobile combustion (company-owned or -operated vehicles and equipment), fugitive emissions (leaks of refrigerants or methane, which often carry outsized global warming potential), and self-produced energy (electricity, heat, or steam generated by equipment the company owns or controls).
Which regulations require companies to report scope 1 emissions, and when do they take effect?
The EU’s Corporate Sustainability Reporting Directive (CSRD) already requires scope 1 disclosure for companies in its first reporting waves. In the US, California’s SB 253 requires companies with over $1 billion in annual revenue doing business in California to report scope 1 and scope 2 emissions, with first reports due November 10, 2026. ISSB-aligned disclosure rules are extending similar requirements across other jurisdictions.
What’s the fastest way for a company to start reducing scope 1 emissions?
Start by measuring at the facility level, since this activity data shows where emissions concentrate. From there, the quickest wins are usually operational, such as repairing refrigerant and methane leaks, upgrading inefficient combustion equipment, and electrifying vehicle fleets, because they sit within the company’s direct control and often pay back through lower fuel and maintenance costs.
Is behind-the-meter power scope 1 or scope 2?
It depends on who controls the generating asset. If a company owns or financially controls its on-site generation, the emissions are scope 1. If a third party owns and operates the generator and sells the power- the structure behind most data center power deals- the buyer reports those emissions as scope 2 under the GHG Protocol’s Scope 2 Guidance.
Why Behind-the-Meter Power Emissions Belong in Scope 2
Key Takeaways
- Larger power users are securing behind-the-meter (BTM) power to bypass grid constraints, pairing data centers with third-party-owned generation assets that deliver electricity through a private line rather than the grid.
- BTM power arrangements can create confusion about electricity emissions classification: the power users neither own the generating asset nor purchase electricity from the grid, leading some to misclassify those emissions as scope 3 in their corporate GHG inventories. But the GHG Protocol's Corporate Standard is clear: BTM electricity emissions belong in scope 2.
- Misclassifying BTM emissions can create reputational and regulatory risk. Relae can help organizations get this right before the contract closes.
Why Large Power Users Are Turning to Behind-the-Meter Power
Large power users are consuming more electricity due to data center growth and are looking to add capacity faster than the grid can support, which is having a direct impact on corporate emissions. For example, between 2020 and 2024, Microsoft’s location-based scope 2 emissions rose 130%, and Google’s rose 92%, driven almost entirely by soaring electricity demand from AI infrastructure.
To bypass grid congestion and long interconnection queues, many are turning to behind-the-meter (BTM) power. It’s a pragmatic solution to a real supply problem, but it’s opening an urgent carbon accounting question: when the BTM asset is owned and operated by a third party, where should we account for those emissions?
There has been some confusion that has resulted in companies pursuing an interpretation that would place those emissions in scope 3. The GHG Protocol’s Corporate Standard says otherwise, and the stakes of getting this wrong are high.
What Is Behind-the-Meter Power Generation?
Behind-the-meter refers to electricity generated on the power consumer’s side of the utility meter, bypassing the grid, and typically located on or near the site where the power is consumed.
In most BTM arrangements for a data center, a third-party developer builds and operates a generation asset, such as natural gas, geothermal, or renewable energy, and delivers electricity directly to the facility through a private transmission line. There is no utility meter, no grid connection, and no standard energy invoice.
This structure allows companies to access large, reliable blocks of power without waiting years for grid interconnection approvals. Since the company does not own or operate the generation asset and is not purchasing electricity through a conventional utility relationship, this arrangement has created some uncertainty around how to account for the associated emissions.
Can BTM Electricity Emissions Be Classified As Scope 3?
In this scenario, no. The GHG Protocol's Corporate Standard is unambiguous: BTM electricity emissions belong in scope 2, not scope 3. Yet, some companies have been confused about this classification.
There is broad agreement that since the power users do not own or operate the generating asset, those emissions do not belong in scope 1. Divergence starts when we consider that the company is purchasing BTM power, i.e., not from the grid. Since no electricity is acquired from the grid, some argue that rather than accounting for these emissions in scope 2, they are better placed in scope 3, category 8: emissions from leased assets.
The appeal is obvious for BTM power consumers. Scope 3 emissions face less scrutiny from investors, auditors, and regulators who focus most of their attention on scopes 1 and 2. Classifying BTM emissions as scope 3 would reduce near-term pressure to act. However, the GHG Protocol is unambiguous in its stance.
What the GHG Protocol Actually Says
The GHG Protocol’s Scope 2 Guidance states that “organizations must quantify emissions from the generation of acquired and consumed electricity, steam, heat, or cooling (collectively referred to as ‘electricity’).” The method of delivery, whether grid or BTM, does not change the classification.
If a company consumes electricity from a BTM source, the emissions from generating that electricity belong in scope 2. Section 5.4 of the Scope 2 Guidance addresses BTM power generation directly: “the company with operational or financial control of the energy generation facility reports those emissions in scope 1, following the operational control approach, while the consumer of the energy reports the emissions in scope 2.”
This resolves the question completely. The emissions sit in scope 1 if the company has operational or financial control of the asset, or in scope 2 if a third party controls it.
The GHG Protocol’s Corporate Value Chain (Scope 3) Accounting and Reporting Standard reinforces this conclusion. “Category 8 includes emissions from the operation of assets that are leased by the reporting company in the reporting year and not already included in the reporting company’s scope 1 or scope 2 inventories.”
Because BTM electricity emissions are captured by the Scope 2 Guidance, the scope 3 category 8 does not apply.
Get the Accounting Right Before the Contract Closes
The GHG Protocol is unambiguous: behind-the-meter electricity emissions belong in scope 2 for companies that consume, but do not control the generating asset. This means that BTM contract terms are crucial to determining how the emissions will be classified, since the GHG Protocol assigns scope based on who holds operational or financial control of the generating asset.
Companies that move fast on BTM capacity without understanding this distinction risk locking in a scope 1 or scope 2 obligation they didn't anticipate or building a reporting strategy around a scope 3 interpretation the GHG Protocol doesn't support. This can become a reputational or even a regulatory liability that is far harder to address after the contract is signed.
[cta]
Reconciliation Bill Dramatically Shifts the Clean Energy Landscape
Key Takeaways
- Accelerated phase-out schedules for key clean energy and decarbonization tax credits will shorten the runway for project development, which could stall or cancel projects.
- Urgency is paramount, and qualified projects should expedite construction and operational timelines to secure eligibility for existing credits.
- A more complicated policy landscape requires concerted effort to navigate, including with the support of policy professionals.
Reconciliation Rolls Back Much of the IRA
On Friday, July 4, 2025, the President signed a sweeping reconciliation bill, H.R. 1, that will add at least $3.3 trillion to the national debt and marks a pivotal, contentious moment for US clean energy policy. The law was enacted through the complex legislative process known as budget reconciliation, requiring only a simple majority of votes in the House and Senate. The new law substantially modifies or terminates many of the Inflation Reduction Act of 2022 (IRA)'s clean energy incentives and has extensive implications for the economic viability of American energy and manufacturing projects.
In the Senate, three Republicans crossed party lines to vote against the bill, requiring Vice President JD Vance to break the tie. In the House, only two Republicans broke ranks to vote against final passage. While some of the more complex provisions of the bill, such as new foreign entity of concern (FEOC) restrictions, will require more time to fully assess, we've prepared a rapid run-down of key alterations to IRA incentives for carbon management, hydrogen, and clean fuel technologies.
What Is the 2025 Reconciliation Bill?
While the 2025 reconciliation bill is staggering in length, scope, and severity, containing provisions to cut Medicaid, reduce nutrition assistance, raise the debt limit, and cut taxes primarily for the wealthy, some of the most drastic sections of the bill modify tax incentives and other public funding for clean energy and emissions reductions.
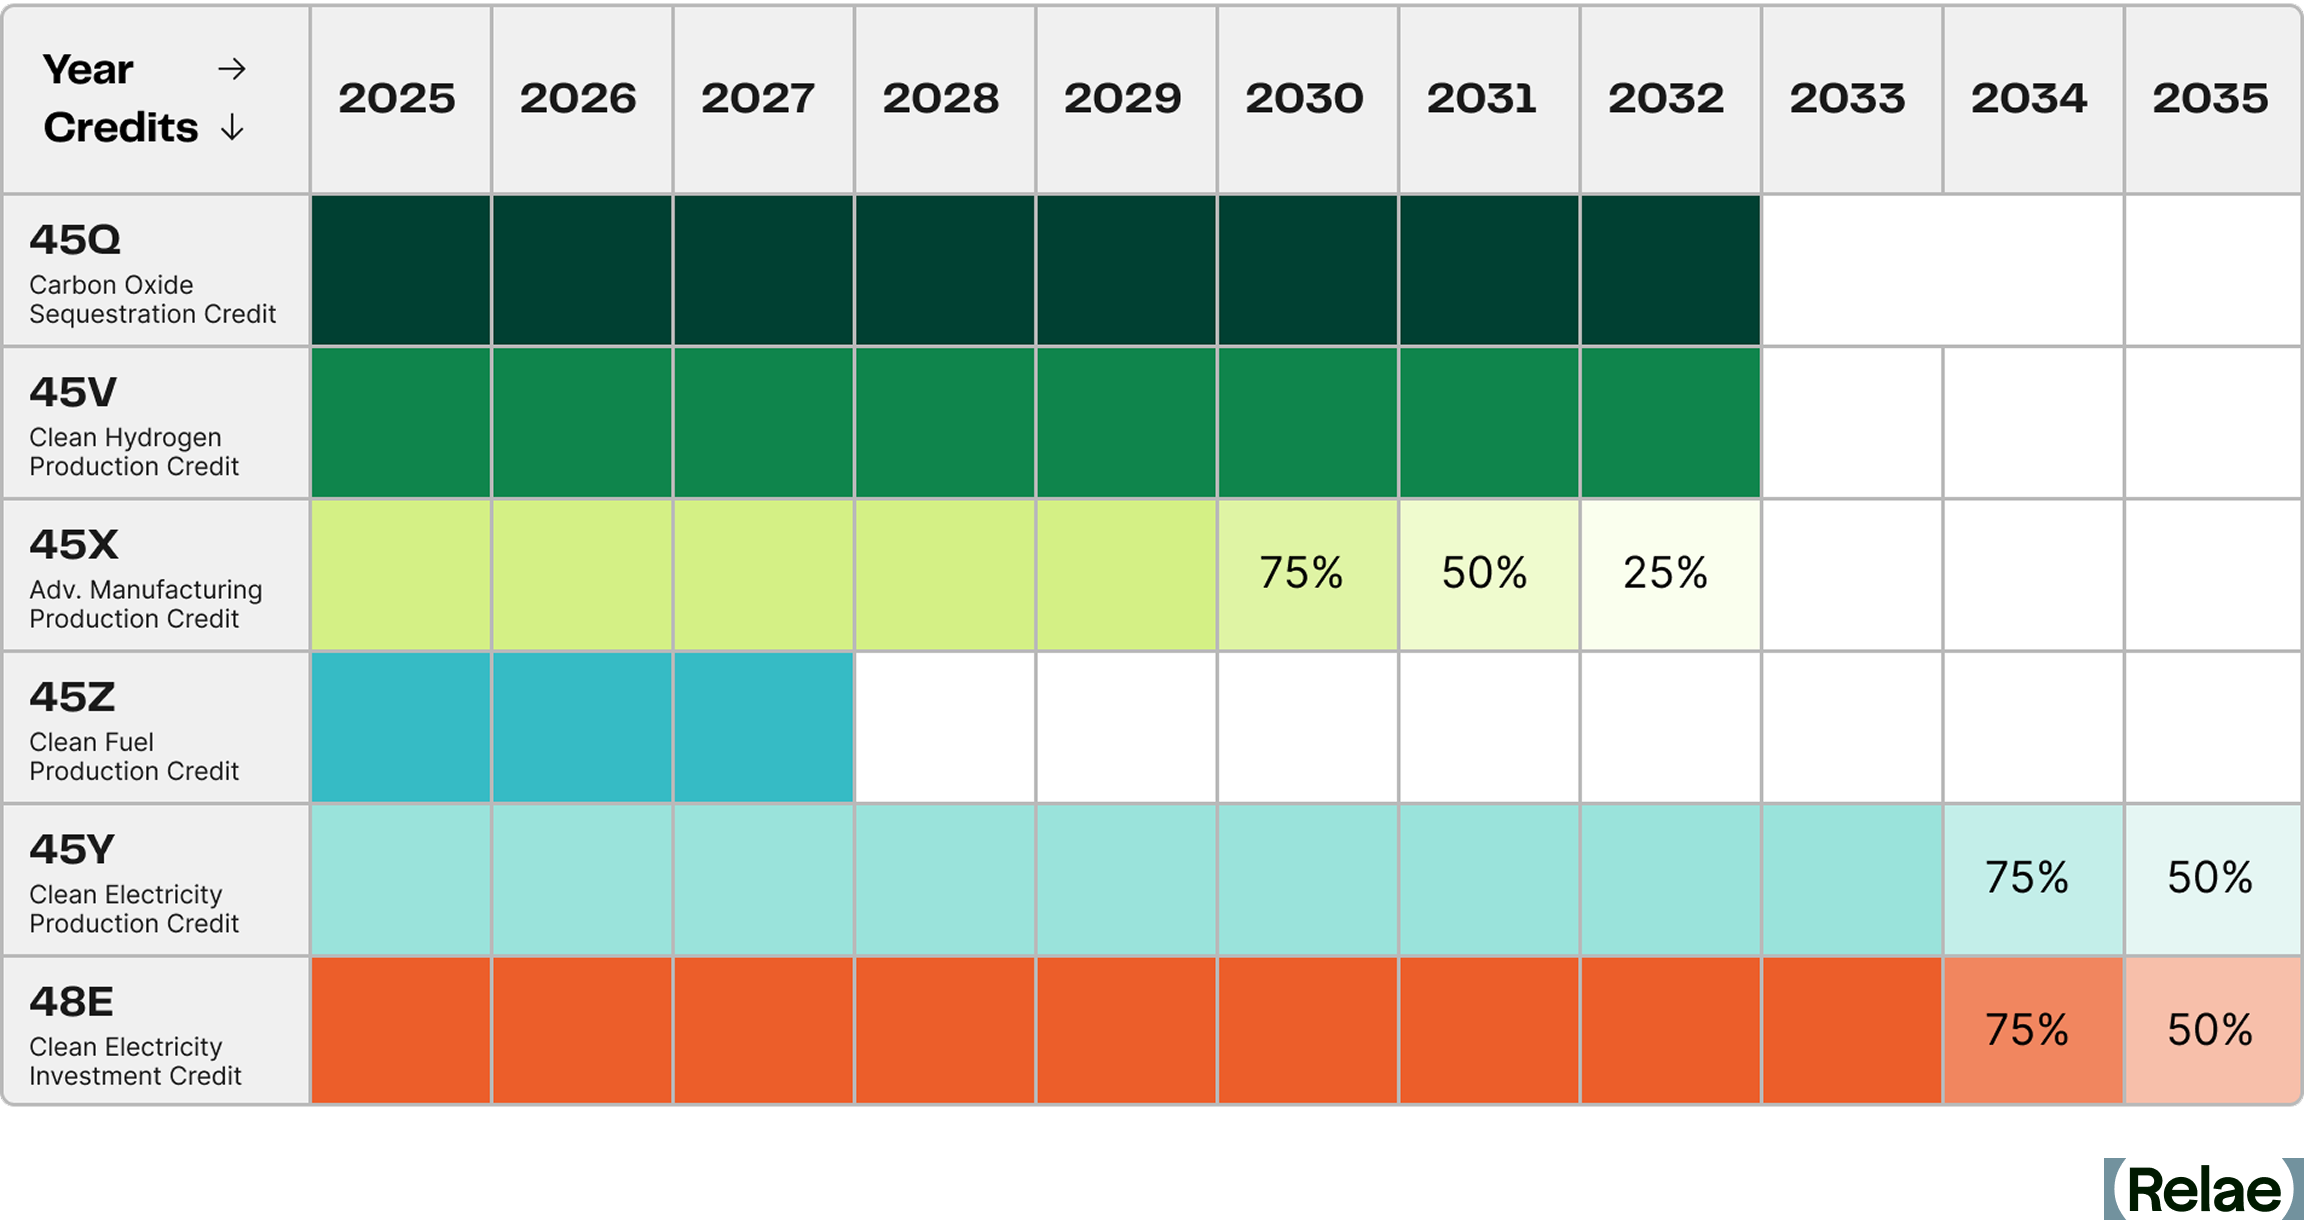
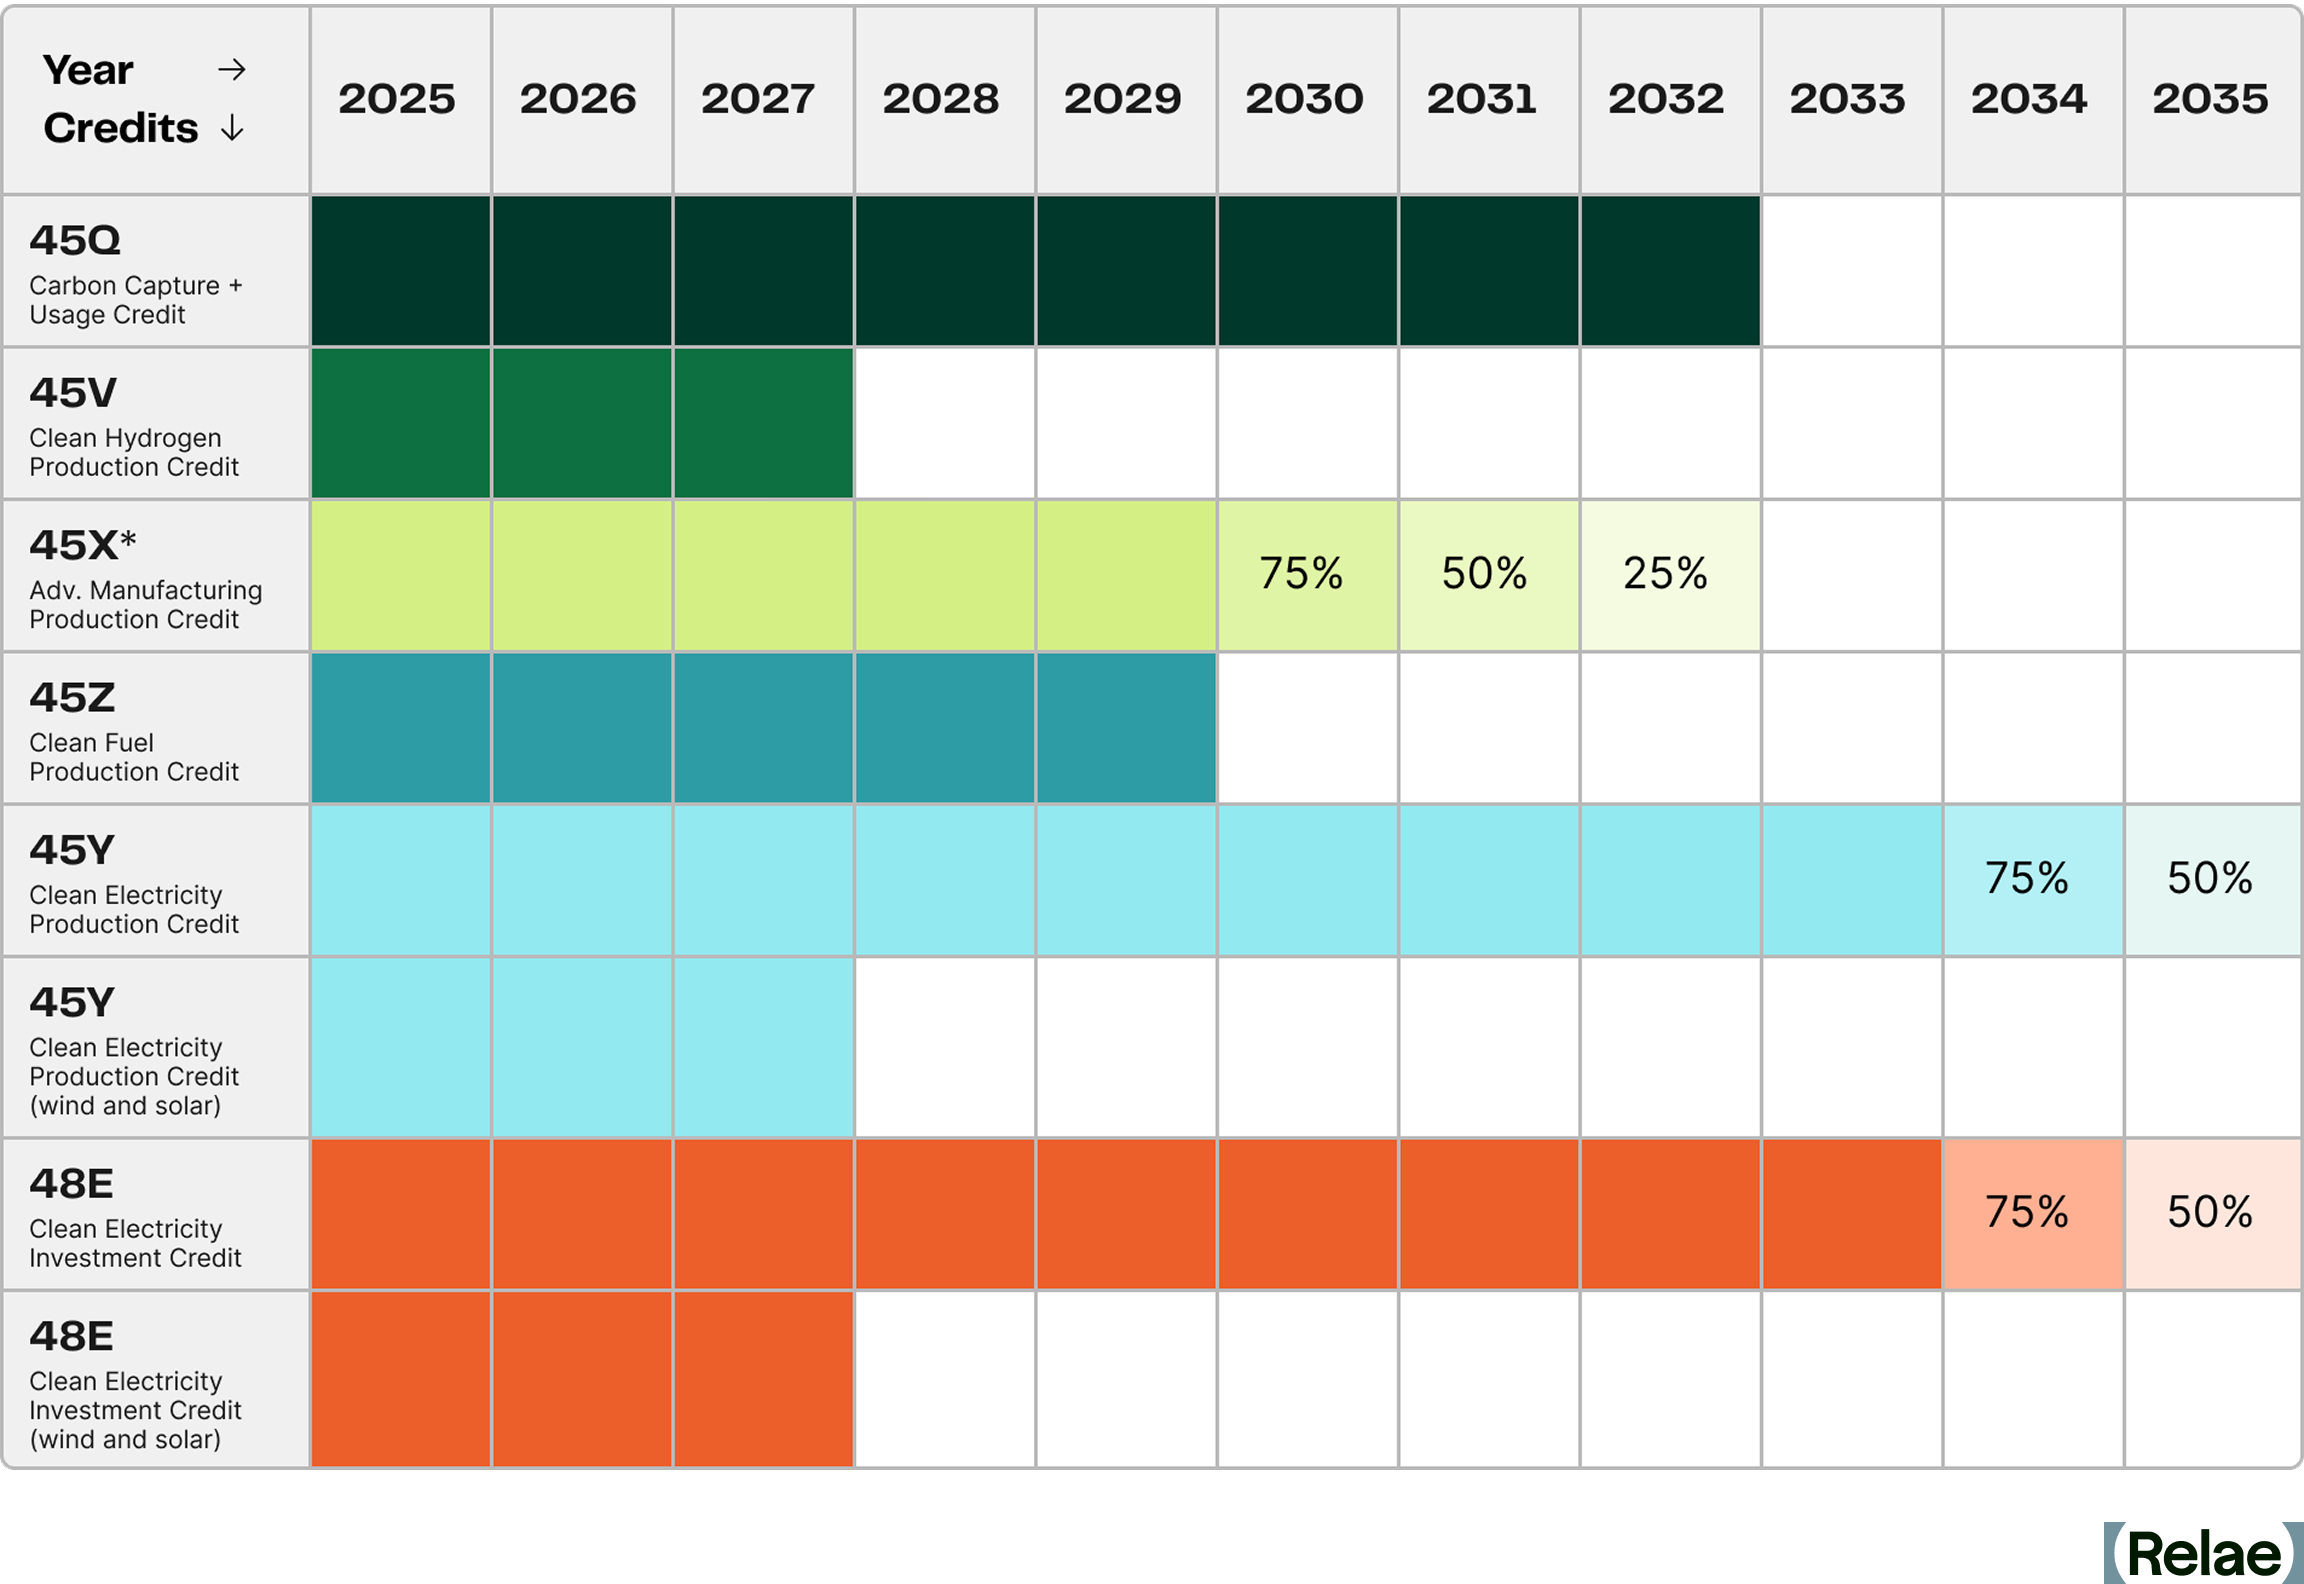
Many of the incentives to deploy clean energy that were created or enhanced under the IRA will be phased out early or repealed altogether. Credits with accelerated phase-out schedules include the newly created 45Y clean electricity production tax credit, which will no longer support wind or solar projects after 2027, and the 45V credit for clean hydrogen production for which projects must now commence construction before Jan 1, 2028 (moved up from Jan 1, 2033).
Since the passage of the reconciliation package, there has been active litigation on several provisions, including an order from a federal district court to vacate IRS guidance that would have prohibited certain wind and solar projects from securing safe harbor. The table below provides a detailed breakdown of key changes to major tax credits between the original IRA, the draft that moved through Committees in the House, and the final text that was passed by the Senate and signed into law.
Major Tax Credit Changes in the Reconciliation Law
How FEOC Restrictions Threaten Clean Energy Supply Chains
Many clean energy tax credits include ambiguous language restricting projects connected to FEOC, complicating supply chains and creating new problems for developers of clean energy projects. The law also introduces a complex matrix of new definitions, such as "Prohibited Foreign Entities," which includes both "Specified Foreign Entities" and "Foreign-Influenced Entities."
The FEOC restrictions embedded in the reconciliation bill represent a seismic shift for clean energy developers. These new rules, designed to limit the influence of Covered Nations (China, Russia, North Korea, and Iran), will disqualify projects from receiving tax credits if they source components, minerals, or intellectual property from entities tied to these nations. In other instances, the partial ownership or investment of an entity with financial ties to a Prohibited Foreign Entity may also disqualify a project from qualifying for tax credits.
This FEOC language matters for developers and investors because of the resulting global supply chain disruptions, investment uncertainty, and compliance burdens. The clean energy sector is deeply reliant on global supply chains, especially for solar panels, batteries, and wind components, industries where China currently dominates. The IRA intended to counter this by moving the manufacturing and production of these supply chains to the US. Project developers must now thoroughly review their supply chains and capital providers, and may need to quickly pivot to compliant resources.
In February 2026, the IRS released interim guidance on the FEOC provisions to provide safe harbor guidance for clean energy manufacturing, investment, and production credits to help taxpayers gauge whether material assistance was provided by a prohibited foreign entity.
Other Major Rollbacks to the IRA
Beyond clean energy tax credits, the reconciliation package also repeals and rescinds many other IRA provisions. This includes a full rescission of all unobligated IRA appropriated balances at the Department of Energy's Loan Programs Office, and several other programs, including:
- The Tribal Energy Loan Guarantee Program
- Greenhouse Gas Reduction Fund
- Transmission Facility Financing
A complete list of rescissions of energy-related funding is outlined in Sections 60001-60024 and 50402 of the law. These rescissions represent tens of billions of dollars in lost climate investments made under the IRA, which would have provided funds to state, local, and Tribal governments, federal agencies, non-profits, and commercial project developers to reduce emissions and update critical infrastructure.
What Can Project Developers and Other Companies Do?
Developers will need to act quickly to meet updated commence construction and place into service requirements, though circumstances are technology specific (e.g., safe harbor updates to 48E and 45Y). Tax credits generally have advanced commence construction and operational deadlines, resulting in a strong first-movers advantage. Companies should also review their supply chains and revise equipment and material procurement sourcing plans as necessary to address restrictions presented in the reconciliation bill.
An executive order from President Donald Trump issued on July 7 will further complicate how companies proceed. In the EO, the President directs his administration to "strictly enforce the termination of […] 45Y and 48E […] for wind and solar facilities." The Administration will likely issue extremely strict interpretations of "commence construction" clauses and FEOC requirements in forthcoming tax credit guidance issued by the Treasury Department, though these moves are quite likely to face litigation.
The new restrictions being proposed by the Administration, including specific details on FEOC, qualified equipment, commence construction, and other reporting requirements, will require additional guidance from the IRS and provide an opportunity for engagement through public comment. It is important that impacted companies weigh in during these public comment periods, not only to help inform and influence the final rules issued by the Administration, but also to build an administrative record that could support litigation efforts to strike down the final rules.
Staying Ahead of Policy Changes
Given the rapidly shifting landscape of energy policy, it's paramount that companies stay abreast of the latest changes and dedicate resources to understanding how they may be affected. Policy professionals, including the experts at Relae (formerly Carbon Direct), can support organizations as they engage in the regulatory process, anticipate and prepare for new legislation, and navigate the requirements to access essential tax credits and incentives. Even under new constraints, expert guidance can help maximize impact and minimize disruption.
Frequently Asked Questions
How does the reconciliation bill change the timelines for major clean energy tax credits?
Most clean energy tax credits saw their windows shortened relative to the original IRA:
- The 45Y and 48E credits now terminate entirely for wind and solar facilities placed in service after December 31, 2027, with a separate phase-down (75% in 2034, 50% in 2035, 0% after) for other technologies.
- The 45V clean hydrogen credit's "commence construction" deadline moved from December 31, 2032 to December 31, 2027.
- The 45Z clean fuel credit now ends on December 31, 2029 (versus 2027 in the original IRA, but bonuses for SAF have been removed and new emissions-calculation methods favor corn ethanol).
- Notably, the 45Q carbon capture credit saw little change and retained transferability, with credit values for enhanced oil recovery and utilization raised to match secure geological storage.
What are the FEOC restrictions, and why do they matter so much for developers?
FEOC ("Foreign Entity of Concern") restrictions disqualify projects from tax credits if they source components, minerals, or intellectual property from entities tied to China, Russia, North Korea, or Iran. Even partial ownership or investment ties to a "Prohibited Foreign Entity" can trigger disqualification. The definitions are complex and still being clarified through IRS guidance, meaning developers need to review supply chains and capital providers carefully and may need to pivot to compliant sourcing.
What should project developers do now in response to these changes?
Developers should move quickly to meet the earlier "commence construction" and "placed in service" deadlines, since credits now benefit early actors. This includes reviewing and potentially restructuring supply chains and procurement plans to address FEOC restrictions, and closely monitoring forthcoming IRS/Treasury guidance.
Every Climate Action Counts: GHG Protocol's AMI Proposal Explained
Key Takeaways
- The GHG Protocol's Actions and Market Instruments (AMI) proposal introduces a four-statement reporting framework that will give companies an official place to report carbon dioxide removal (CDR), book-and-claim environmental attribute certificates (EACs), and financed reductions, actions that cannot currently count toward scope 1, 2, or 3 emissions reporting.
- The AMI proposal’s four-statement framework will put current emissions and mitigation efforts side by side in the same report, in the same units, giving sustainability teams a clear, defensible way to make a business case for every major decarbonization investment.
- A full draft standard is expected in 2027/2028. Companies that audit their portfolios against emerging quality criteria and engage now will have time to identify gaps and be best positioned when the standard takes effect.
What Problem Does the AMI Proposal Solve?
Companies that have purchased carbon dioxide removal (CDR) credits, invested in book-and-claim environmental attribute certificates (EACs) for low-carbon materials, or funded a carbon capture and storage (CCS) project outside of their value chain have probably heard some version of the same question from their board, employees, or investors: "Where does this show up in our GHG Protocol Scopes?" Until now, the answer has been: it doesn’t.
The current GHG Protocol Corporate Standard was built around a single organization’s emissions inventory. It has no recognized home for CDR, EACs for materials, or financed reductions that occur outside of a company’s operational boundaries (they must be “reported separately”). Companies making real climate investments, therefore, have had no standard way to show it within the Corporate Standard.
The GHG Protocol's Actions and Market Instruments (AMI) proposal aims to fundamentally change that.
What Is the AMI Proposal's Four-Statement Framework?
The GHG Protocol's AMI proposal will replace the single corporate inventory with four distinct Statements, all housed within a single GHG Report:
- Statement 1: A company’s traditional GHG inventory, including operational emissions across scope 1, scope 2 (location-based only), and scope 3.
- Statement 2: Market-based emissions accounting across scopes 1, 2, and 3 using EACs for energy, materials, and other purchased goods. While this is well established for electricity, it will be the first time that similar book-and-claim arrangements for low-carbon steel, concrete, sustainable aviation fuel (SAF), and renewable natural gas can be directly recognized.
- Statement 3: Beyond-value-chain mitigation and CDR. This is the reporting home for CDR credits, superpollutant credits, and financed reductions that mitigate emissions outside a company’s value chain.
- Statement 4: Co-benefits and additional climate impacts, capturing non-GHG benefits arising from corporate action and value that do not fit neatly into emissions accounting.
This change is more than just a rearrangement of reporting - it’s a fundamental expansion of scope. The introduction of Statements 2 and 3 will allow companies to report their mitigation activities in tonnes of CO2e - the same unit as their emissions. For the first time, a company will be able to show its emissions and its climate investments side by side, in the same language, in the same report.
Why Does This Matter Now?
Today, companies investing in CDR, book-and-claim EACs (other than electricity), and financed emissions reductions face a persistent credibility gap. The investments are real. The climate impact is real. However, since no recognized reporting framework captures them, they are functionally invisible within corporate disclosures. This makes it harder to justify the spend internally and harder to communicate the value externally.
The AMI framework will remove that barrier across every major decarbonization category:
- A company purchasing a book-and-claim EAC for the low-carbon attribute of low-carbon concrete or steel would report the carbon intensity benefit in Statement 2 under scope 3.1. Statement 2 is the appropriate reporting location, rather than Statement 1, because the physical low-carbon concrete/steel product is not actually used by the company.
- An airline or corporate traveler using SAF via a book-and-claim arrangement could report the emissions benefit in Statement 2. Similarly, the airline could now report biogenic emissions from SAF if applicable in Statement 2, scope 1. Corporate travelers would report improvements in Statement 2, scope 3, category 6. Since the SAF does not physically enter the airline’s planes, the benefit is reportable only in everyone’s Statement 2 reports. If the airline can prove physical delivery of SAF onto its airplanes, then the benefits are shifted into everyone’s Statement 1 reports.
- A technology company funding a third-party carbon capture and storage project that receives verified reduction credits would report them in Statement 3, because the CCS project is outside of the technology company’s value chain and the technology company is not buying any goods or services from the CCS project. The third party that operates the CCS project would report lower scope 1 emissions in Statement 1 than they did pre-CCS, since the project impacts their direct emissions.
- A company buying CDR credits from CDR projects outside of their own value chain would report the removals in Statement 3, directly alongside the company’s Statement 1 and 2 emissions. This differs from the previous example because the company is not funding a project; it is buying a service - a CDR credit.
The practical effect will be significant. When clients ask whether a given investment "counts" under the GHG Protocol, the answer will shift from "probably not" to "yes, and here is which statement it belongs in."
What Does This Mean for Hard-to-Abate Sectors?
For sectors like cement, steel, chemicals, shipping, and aviation—where full decarbonization will be extremely challenging—the AMI proposal’s framework offers something that has not previously existed: a multi-faceted reporting strategy.
Companies in these sectors will be able to combine Statement 2 (EAC-based carbon intensity swaps for purchased goods) with Statement 3 (financed reduction credits) to demonstrate near-term progress, while long-term abatement technology matures. A cement buyer, for example, would procure low-carbon cement EACs under a book-and-claim arrangement and report the emissions benefit in Statement 2, while simultaneously funding a CCS project and reporting the resulting reduction credits in Statement 3.
For data centers and large power consumers, the framework adds a new layer to existing scope 2 electricity strategies: the ability to report the embodied carbon benefits of low-carbon materials used in construction and infrastructure, via Statement 2. Lower-carbon natural gas for power procured with EACs would also now be reportable in Statement 2.
For financial institutions and asset managers, the new statements create a richer disclosure environment for both internal reporting and structuring sustainability-linked financial products tied to Statement 2 and 3 performance.
How to Prepare Now
A full draft standard is expected in 2027/2028. Between now and then, the GHG Protocol will define the eligibility and quality guardrails that determine what activities qualify for Statements 2 and 3. Those criteria will matter enormously: they will shape which CDR credits, EAC programs, and financed reduction projects meet the bar for official reporting recognition.
Companies should not wait for final rules to begin preparing. Here are the most important steps to take now:
- Review existing portfolios against the emerging quality criteria for Statements 2 and 3. Not every credit or EAC program will qualify, and identifying the gaps early creates time to act.
- Map current decarbonization investments to the four statements. This exercise alone will reveal reporting opportunities and gaps that are not visible under the current single-inventory framework.
Frequently Asked Questions
What is the AMI proposal, and how does it work?
The GHG Protocol’s Actions and Market Instruments (AMI) proposal would allow organizations to report: their emissions (statement 1); their market-based emissions across all scopes (statement 2); GHG emissions reductions, avoidance, and removals resulting from their actions (statement 3); and other relevant metrics (statement 4).
How does AMI compare to the TCAT and/or AIM framework?
The AMI proposal is very similar to the Task Force for Corporate Action Transparency (TCAT) Mitigation Action Accounting and Reporting Guidance and the Advanced and Indirect Mitigation (AIM) Standard & Guidance. The AMI standard is not finalized, but many concepts from TCAT and AIM (including sector association tests) could be included in the final standard.
Can any climate action really count for the AMI proposal?
As of September 2026, the AMI standard is not finalized. However, if the final standard adopts the proposed structure, then any verified, high-quality climate action is reportable. Look for guidance from the GHG Protocol to determine verification and quality requirements.