Scope 3.1 Emissions: How to Measure and Reduce Value Chain Impact
Key Takeaways
- Scope 3.1 emissions, purchased goods and services, can account for up to 67% of a company’s total carbon footprint, making them a critical category for measurement and action.
- Companies can reduce risk, meet stakeholder demands, and strengthen supply chain resilience by proactively managing scope 3.1 emissions.
- Relae empowers organizations to take meaningful action on scope 3.1 through science-based measurement, practical emissions management strategies, and deep supplier engagement.
What Are Scope 3 Emissions and Why Do They Matter?
Scope 3 emissions include all indirect greenhouse gas (GHG) emissions that occur across a company’s value chain. While scope 1 emissions are from directly owned or controlled activities, and scope 2 are indirect emissions from the generation of purchased electricity, heat, or steam, scope 3 emissions encompass upstream and downstream activities throughout the value chain.
Within scope 3, there are 15 categories, including activities such as raw material extraction, purchased services, shipping, business travel, product use, and end-of-life treatment. Critically, scope 3 emissions usually make up the majority of a company's total carbon footprint. Across sectors, CDP finds supply chain emissions average 26 times a company's operational emissions, and in supply-chain-heavy sectors like apparel, the share exceeds 95%.
Category 3.1 (purchased goods and services) is often the largest contributor. For many organizations, it can be as much as 67% of their total corporate footprint. Despite being outside a company’s direct operational control, scope 3 emissions are increasingly scrutinized by regulators, investors, and customers alike, making them essential to measure, manage, and reduce.
What Is Included in Scope 3.1 Emissions?
Scope 3.1 emissions capture all cradle-to-gate emissions associated with products and services procured by an organization. These include emissions from the extraction of raw materials, energy usage, manufacturing processes, waste, and transport and travel up to the point of delivery to the reporting company. As such, the types of activities within this category are quite extensive and disparate.
Examples of scope 3.1 items include:
- Raw materials (e.g., limestone, copper ore, lumber)
- Intermediate products (e.g., steel, electronic components, platform chemicals)
- Packaging materials
- Office supplies and equipment
- Professional services
- Cloud computing and software services
The size of scope 3.1 emissions varies widely by industry. For example, a consumer goods manufacturer sourcing large volumes of physical products may see a larger share of emissions in this category than the supplier providing the raw materials. For data centers that run on very low-carbon electricity, equipment and construction can account for 40% of lifetime emissions. For many organizations that are service-based or contract out manufacturing, scope 3.1 can be the most significant emissions category.
What Is the Strategic Value of Scope 3.1?
While scope 3.1 emissions fall outside a company’s direct operational control, they are not beyond its influence. Addressing emissions from purchased goods and services may open up a range of strategic benefits:
- Innovation opportunities through lower-carbon materials and production processes.
- Enhanced supplier relationships and engagement on shared sustainability goals.
- Improved resilience and risk mitigation across supply chains.
By assessing and acting on scope 3.1 emissions, companies can drive meaningful reductions and catalyze change throughout the entire supply chain.
What Are the Methods for Calculating Scope 3.1 Emissions?
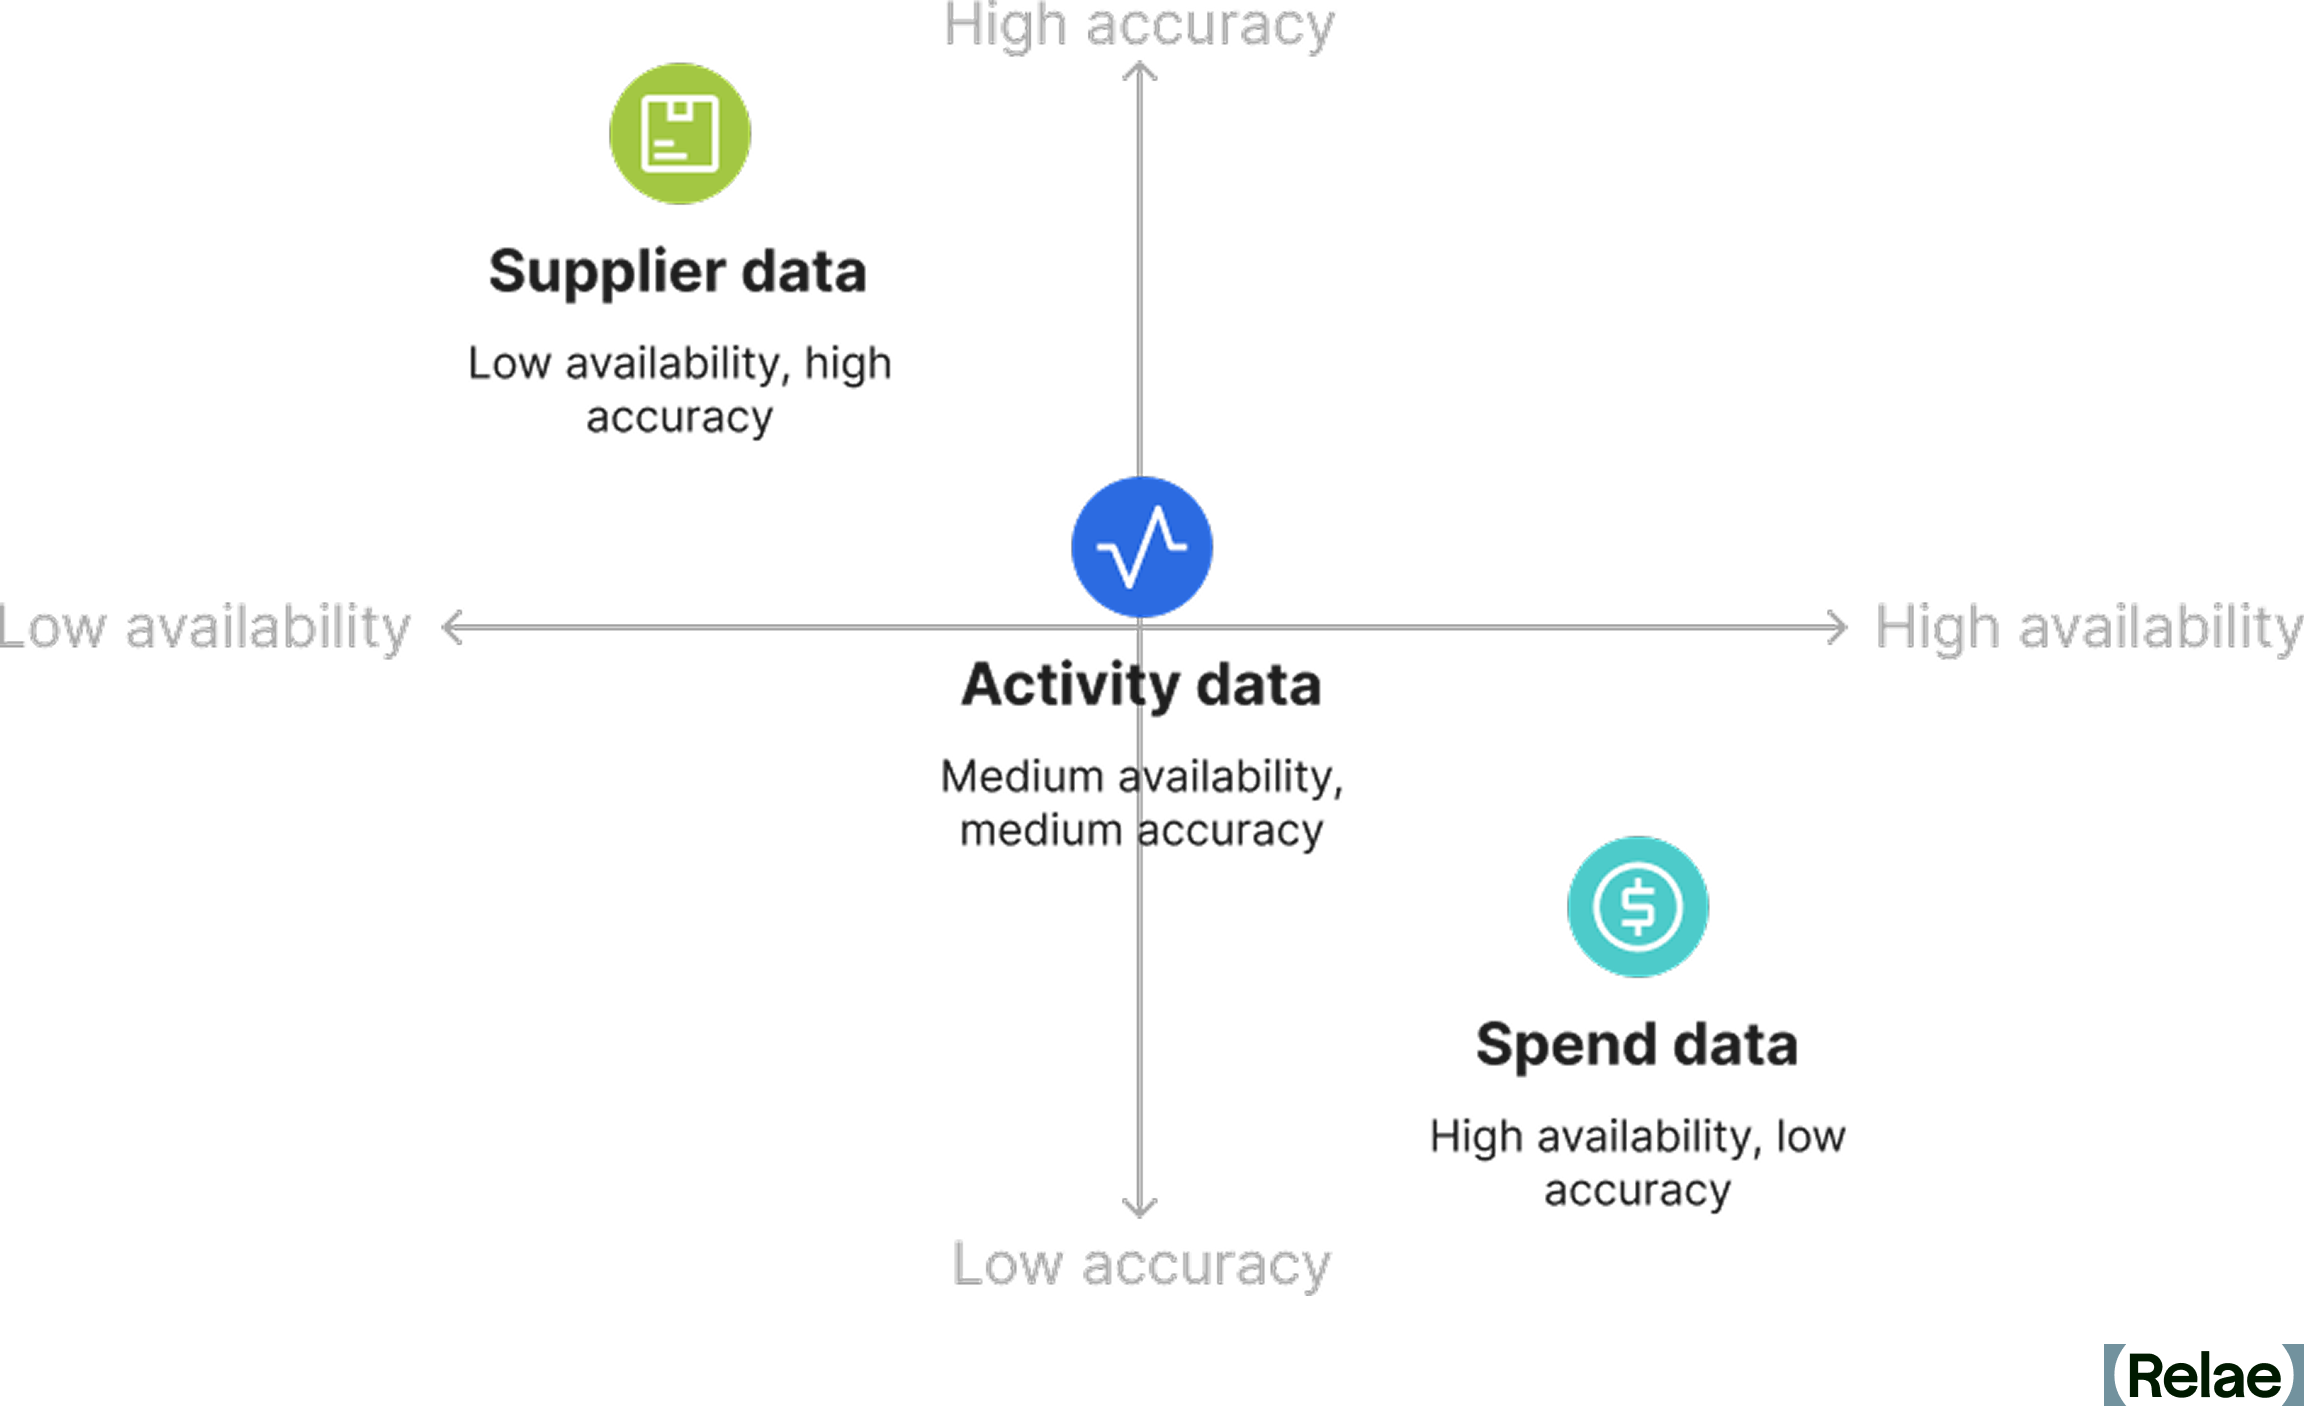
There are four methods to calculate scope 3.1 emissions based on the data collected. Each offers a different balance of speed, accuracy, and scalability.
1. The Spend-Based Method
This approach multiplies the amount of money spent on a good or service by an economic emissions factor (e.g., kg CO₂e per dollar spent). Most companies use this approach as a starting point but transition to more accurate methods as they advance in their sustainability journey.
Advantages
- Fast and scalable across categories
- Useful for initial hotspot identification
- Helps fill data gaps when activity data is unavailable
Limitations
- Lower accuracy, especially during periods of inflation or economic volatility
- Cannot reflect actual emissions reductions by suppliers
- Misalignment between price and emissions (e.g., high-cost items may not be high-emission)
2. The Average Data Method
This method uses average emissions factors for goods or services, based on industry datasets. For instance, industry life cycle assessments (LCAs) might be used to estimate the emissions associated with a kilogram of steel purchased.
Advantages
- More accurate than spend-based
- Suitable for companies refining emissions data to enable targeted reductions
Limitations
- Lack of raw data granularity
- Geographic variation limited
3. The Supplier-Specific Method
The supplier-specific method is the most accurate approach and involves collecting actual emissions data directly from suppliers. This includes LCAs, environmental product disclosures (EPDs), product carbon footprints (PCFs), supplier emissions reports, or Environmental, Social, and Governance (ESG) reports.
Advantages
- High accuracy and granularity
- Builds engagement with suppliers
- Enables tracking of supplier improvements over time
Limitations
- Challenging to scale across many suppliers
- Data may be confidential, inconsistent, or incomplete
- Requires continuous updating of supplier information
4. The Hybrid Approach
Adopting a hybrid approach allows many companies to maximize their data collection efforts by applying the supplier-specific method for high-impact purchases and using average or spend-based methods elsewhere. This tiered approach enables efficient use of resources while maintaining data quality for critical emission sources.
Where Can You Find Scope 3.1 Data?
Data for scope 3.1 emissions typically resides in procurement and finance functions. Purchase orders, invoices, and supplier contracts often contain critical information such as volume, product category, and spend. However, collecting, organizing, and analyzing this data can be resource-intensive, especially for companies with complex and global supply chains. Data type and availability play a key role in determining the method used for calculating emissions, impacting the accuracy and ability to reduce emissions.
What Are the Challenges in Measuring Scope 3.1 Emissions?
As most organizations will attest, measuring scope 3.1 has many challenges, from resource constraints to data availability. As organizations intensify their climate commitments, they are increasingly confronted with a range of technical, logistical, and strategic barriers that make accurate measurement and consistent reporting difficult. Understanding these roadblocks is critical to developing more resilient and impactful scope 3.1 measurement practices.
- Data availability and quality: Collecting high-quality data is often a bottleneck, with many organizations lacking the systems to track product-level or supplier-specific emissions. Without the proper tracking in place, emissions calculations rely on less accurate methods, making it difficult to reflect or meet reduction efforts.
- Supplier inconsistencies and allocation complexities: Even when suppliers share emissions data, the methodologies, boundaries, and underlying assumptions across them will vary widely. This adds an extra layer of difficulty to data aggregation. Additionally, the allocation of supplier emissions may vary based on the supplier’s chosen method, such as economic (based on spend and supplier revenue/emissions) or service-level (based on units purchased and supplier output/emissions). These inconsistencies can significantly affect reported totals, making it challenging to compare suppliers.
- Complex, multi-tiered supply chains: Upstream emissions can span multiple suppliers across different geographies and industries. Visibility often becomes cloudier beyond Tier 1 suppliers, making it difficult to account for emissions generated deeper in the value chain.
- Timing and synchronization: Aligning procurement, emissions calculation, and reporting cycles can be challenging. Delays in supplier disclosures or emissions factor updates can create reporting lags and misalignment.
Top Five Strategies to Reduce Scope 3.1 Emissions
Reducing scope 3.1 emissions requires balancing precise measurement with targeted action. This means identifying high-impact categories, collaborating with key suppliers, and harnessing available emissions data to improve accuracy and accountability. Here are five strategies organizations can use to start driving impact:
- Prioritize key categories and suppliers: Not all purchases contribute equally to emissions. Conduct a hotspot analysis to identify the highest-emitting goods or services and prioritize the top suppliers for engagement. Consider prioritizing the share of emissions, the share of procurement spend, and the current methodology type.
- Engage suppliers and set expectations: Encourage suppliers to measure and disclose their emissions, invest in LCAs or PCFs, and set their own science-based targets. Collaborative initiatives, such as supplier engagement programs, can support progress.
- Leverage readily available supplier reports: Many electronic companies, cloud providers, and industrial products provide detailed emissions data through EPDs, LCAs, and specific service emissions reports. For example, AWS and Google offer detailed emissions reports for data hosting and services. Leveraging these can help reduce uncertainty and improve accounting accuracy in software-heavy organizations. However, they should be utilized with caution, as some providers have faced scrutiny in 2026 for reporting efficiency gains without disclosing cloud-specific energy use or the growth in embodied hardware emissions behind it.
- Identify opportunities for low-carbon inputs: The same reports that help improve reporting accuracy can also provide more detail on the material inputs of purchased goods. This level of information can enable organizations to pursue opportunities for lower-carbon inputs to reduce emissions.
- Invest in centralized data systems: A centralized platform for carbon accounting data management can streamline emissions tracking, improve visibility, and enable scenario modeling. Several of the other strategies cannot be as effective without the right tools in place to manage this key information.
Turning Complexity Into Opportunity
Tackling scope 3.1 emissions may feel daunting, but it’s also where some of the biggest climate opportunities lie. By investing in better data, fostering supplier collaboration, and integrating sustainability into procurement practices, companies can unlock innovation, resilience, and long-term value. Organizations that lead on scope 3.1 will not only meet emerging disclosure standards but will shape the low-carbon supply chains of the future.
Frequently Asked Questions
What are scope 3 emissions, and why do they matter?
Scope 3 emissions are all the indirect greenhouse gas emissions in a company's value chain, everything from raw material extraction and purchased services to product use and disposal. They matter because they're usually the majority of a company's footprint. They also fall outside a company’s direct control, which makes them the hardest to measure and the most scrutinized by regulators and investors.
What is included in scope 3.1 emissions?
Scope 3.1 covers the cradle-to-gate emissions of everything a company buys, i.e. all emissions generated up to the point of delivery. That includes raw materials, intermediate goods like steel and electronic components, packaging, office equipment, professional services, and cloud computing. It captures the supplier's extraction, energy use, manufacturing, waste, and transport. It does not include emissions from using or disposing of your own products, which sit in other scope 3 categories.
What are the methods for calculating scope 3.1 emissions?
There are four. The spend-based method multiplies spend by an emissions factor per dollar, which is fast, scalable, and the usual starting point. The average-data method applies industry emissions factors to physical quantities, like kilograms of steel. The supplier-specific method uses actual supplier data such as LCAs, EPDs, or product carbon footprints, and is the most accurate. Most companies land on a hybrid, the final method, which takes supplier-specific data for high-impact purchases and uses estimates elsewhere.
How can companies reduce scope 3.1 emissions?
Start with a hotspot analysis to identify where emissions are coming from. This will usually show that a small share of suppliers and categories drives most of the footprint. From there, engage those suppliers on measurement and targets, use supplier reports and EPDs to replace estimates with real data, and use that detail to identify lower-carbon inputs. Centralized carbon accounting data makes each of these repeatable rather than a one-off exercise.
Do AI data centers' hardware purchases count as scope 3.1 emissions?
Yes, for a data center operator, servers and chips are purchased goods, and therefore count in scope 3.1.
GHG Accounting
Relae helps companies, investors, and project developers quantify and interpret emissions across operations, value chains, products, projects, and portfolios. We combine advanced emissions analytics, life cycle assessment, and sector-specific expertise to help you identify emissions hotspots, evaluate high-impact opportunities, and build credible baselines for reporting and investment decisions.
Ready to Navigate What Comes Next?



Shelby Walsh

Shelby Walsh

Shelby has focused her career on helping companies assess and reduce their emissions. She has worked across sectors, leveraging her expertise to help organizations focus where impact can be most effective. Her strategic abilities inspire confidence in her clients, as she helps businesses accurately calculate their carbon footprints, identify emission reduction opportunities, and implement effective strategies to achieve sustainability goals.
Working closely with clients, Shelby tailors her approach to meet each organization's unique needs. She employs cutting-edge tools and industry best practices to ensure precise and reliable carbon assessments. Shelby's comprehensive knowledge, from data collection and analysis to reporting and verification, fosters confidence in her ability to guide companies through the complexities of carbon accounting with clarity and precision.
Before joining Relae, Shelby was the head of GHG Accounting at VitalMetrics before being acquired by Watershed. She worked with customers to track their emissions throughout their supply chain, create science-based targets, and develop decarbonization plans to meet those targets. At Watershed, she scaled her impacts by leveraging software to streamline data collection for businesses of all sizes. From her previous work, Shelby brings a holistic perspective on leveraging software for scalable impact, with the personal touch of the individualized needs of every business.

Julia Millot

Julia Millot
,
Julia Millot is a Senior Power Decarbonization Manager at Relae, working directly with clients on measuring and reducing electricity-related GHG emissions and optimizing power portfolios. Julia has over a decade of experience working with clients in the energy, tech, retail, financial, and manufacturing sectors on growth and climate strategies. Prior to Relae, she led US Climate Advisory at Position Green and ran her own consultancy, Green Opal Advisors, focusing on corporate decarbonization.
What to Read Next
How to Measure Your Carbon Emissions
Key Takeaways
- Inventory before you calculate: carbon accounting means collecting activity or spend data across scope 1 (direct), scope 2 (purchased energy), and scope 3 (value chain) emissions for a full year of operations, then converting the results into CO2e using GHG Protocol-aligned emission factors.
- Measurement matters even as rules shift: disclosure requirements like California's SB253 and the EU's CSRD keep evolving, but many companies measure and report emissions voluntarily anyway, to set a baseline for climate targets and meet investor and customer expectations.
- Scope 2 is getting more complex: rising electricity demand from AI and data centers, combined with upcoming GHG Protocol changes to how renewable energy purchases are counted, make an accurate, current scope 2 measurement more valuable than ever.
- Verify before you report: independent review, internal or external, catches errors like double counting and miscategorization before emissions data goes to stakeholders or regulators.
- Annual measurement is what makes the strategy real: repeating the process every year turns a one-time emissions snapshot into a carbon management plan you can track, report, and act on over time.
What Is the Carbon Accounting Process?
Carbon measurement, or carbon accounting, is the process of estimating the greenhouse gas (GHG) emissions from business activities by taking an inventory of a company’s operations. The process calculates greenhouse gas emissions, measured in metric tonnes of CO2 equivalent (CO2e), to provide a holistic picture of emissions over an entire year of operations.
Why Measure Your Greenhouse Gas Emissions?
Climate disclosure regulations continue to shift. California's SB253 is now active law, with an initial scope 1 and scope 2 reporting deadline in November 2026. The EU's CSRD remains in effect, though 2026 reforms narrowed which companies fall under it. In the US, the SEC's 2024 climate disclosure rule is now the subject of a formal rescission proposal. Even as these rules evolve, many companies continue to measure and report emissions voluntarily to meet investor and customer expectations.
Scope 2 accounting for purchased electricity is entering its own period of change. AI and data center growth is driving unprecedented demand on the grid: NERC's January 2026 Long-Term Reliability Assessment projects North American summer peak demand rising 24% (224 gigawatts) over the next decade, with new data centers cited as the primary driver. At the same time, the GHG Protocol is revising its scope 2 guidance toward hourly, regional matching of renewable energy purchases, with final standards expected by 2027. A clear, current measurement of your scope 2 emissions puts you in a stronger position to adapt your electricity and renewable energy strategy as these rules take shape.
Measuring emissions also provides a baseline for setting climate targets and deciding where to start reducing emissions. Repeating the measurement process annually allows you to track and report progress in a clear, transparent way to ensure that stakeholders—regulators, employees, investors, and customers—are informed about your climate action and impact.
How to Measure Your Carbon Emissions
Step 1: Collect Data
A company’s emissions represent the greenhouse gases emitted from everyday activities such as heating an office, shipping merchandise, traveling to a conference, or producing a physical product.
Emissions Sources: Scope 1, 2, and 3
To calculate your organization’s carbon emissions, you’ll need to collect data from all emissions-generating sources. These sources are divided into three categories, defined by scopes, according to the GHG Protocol:
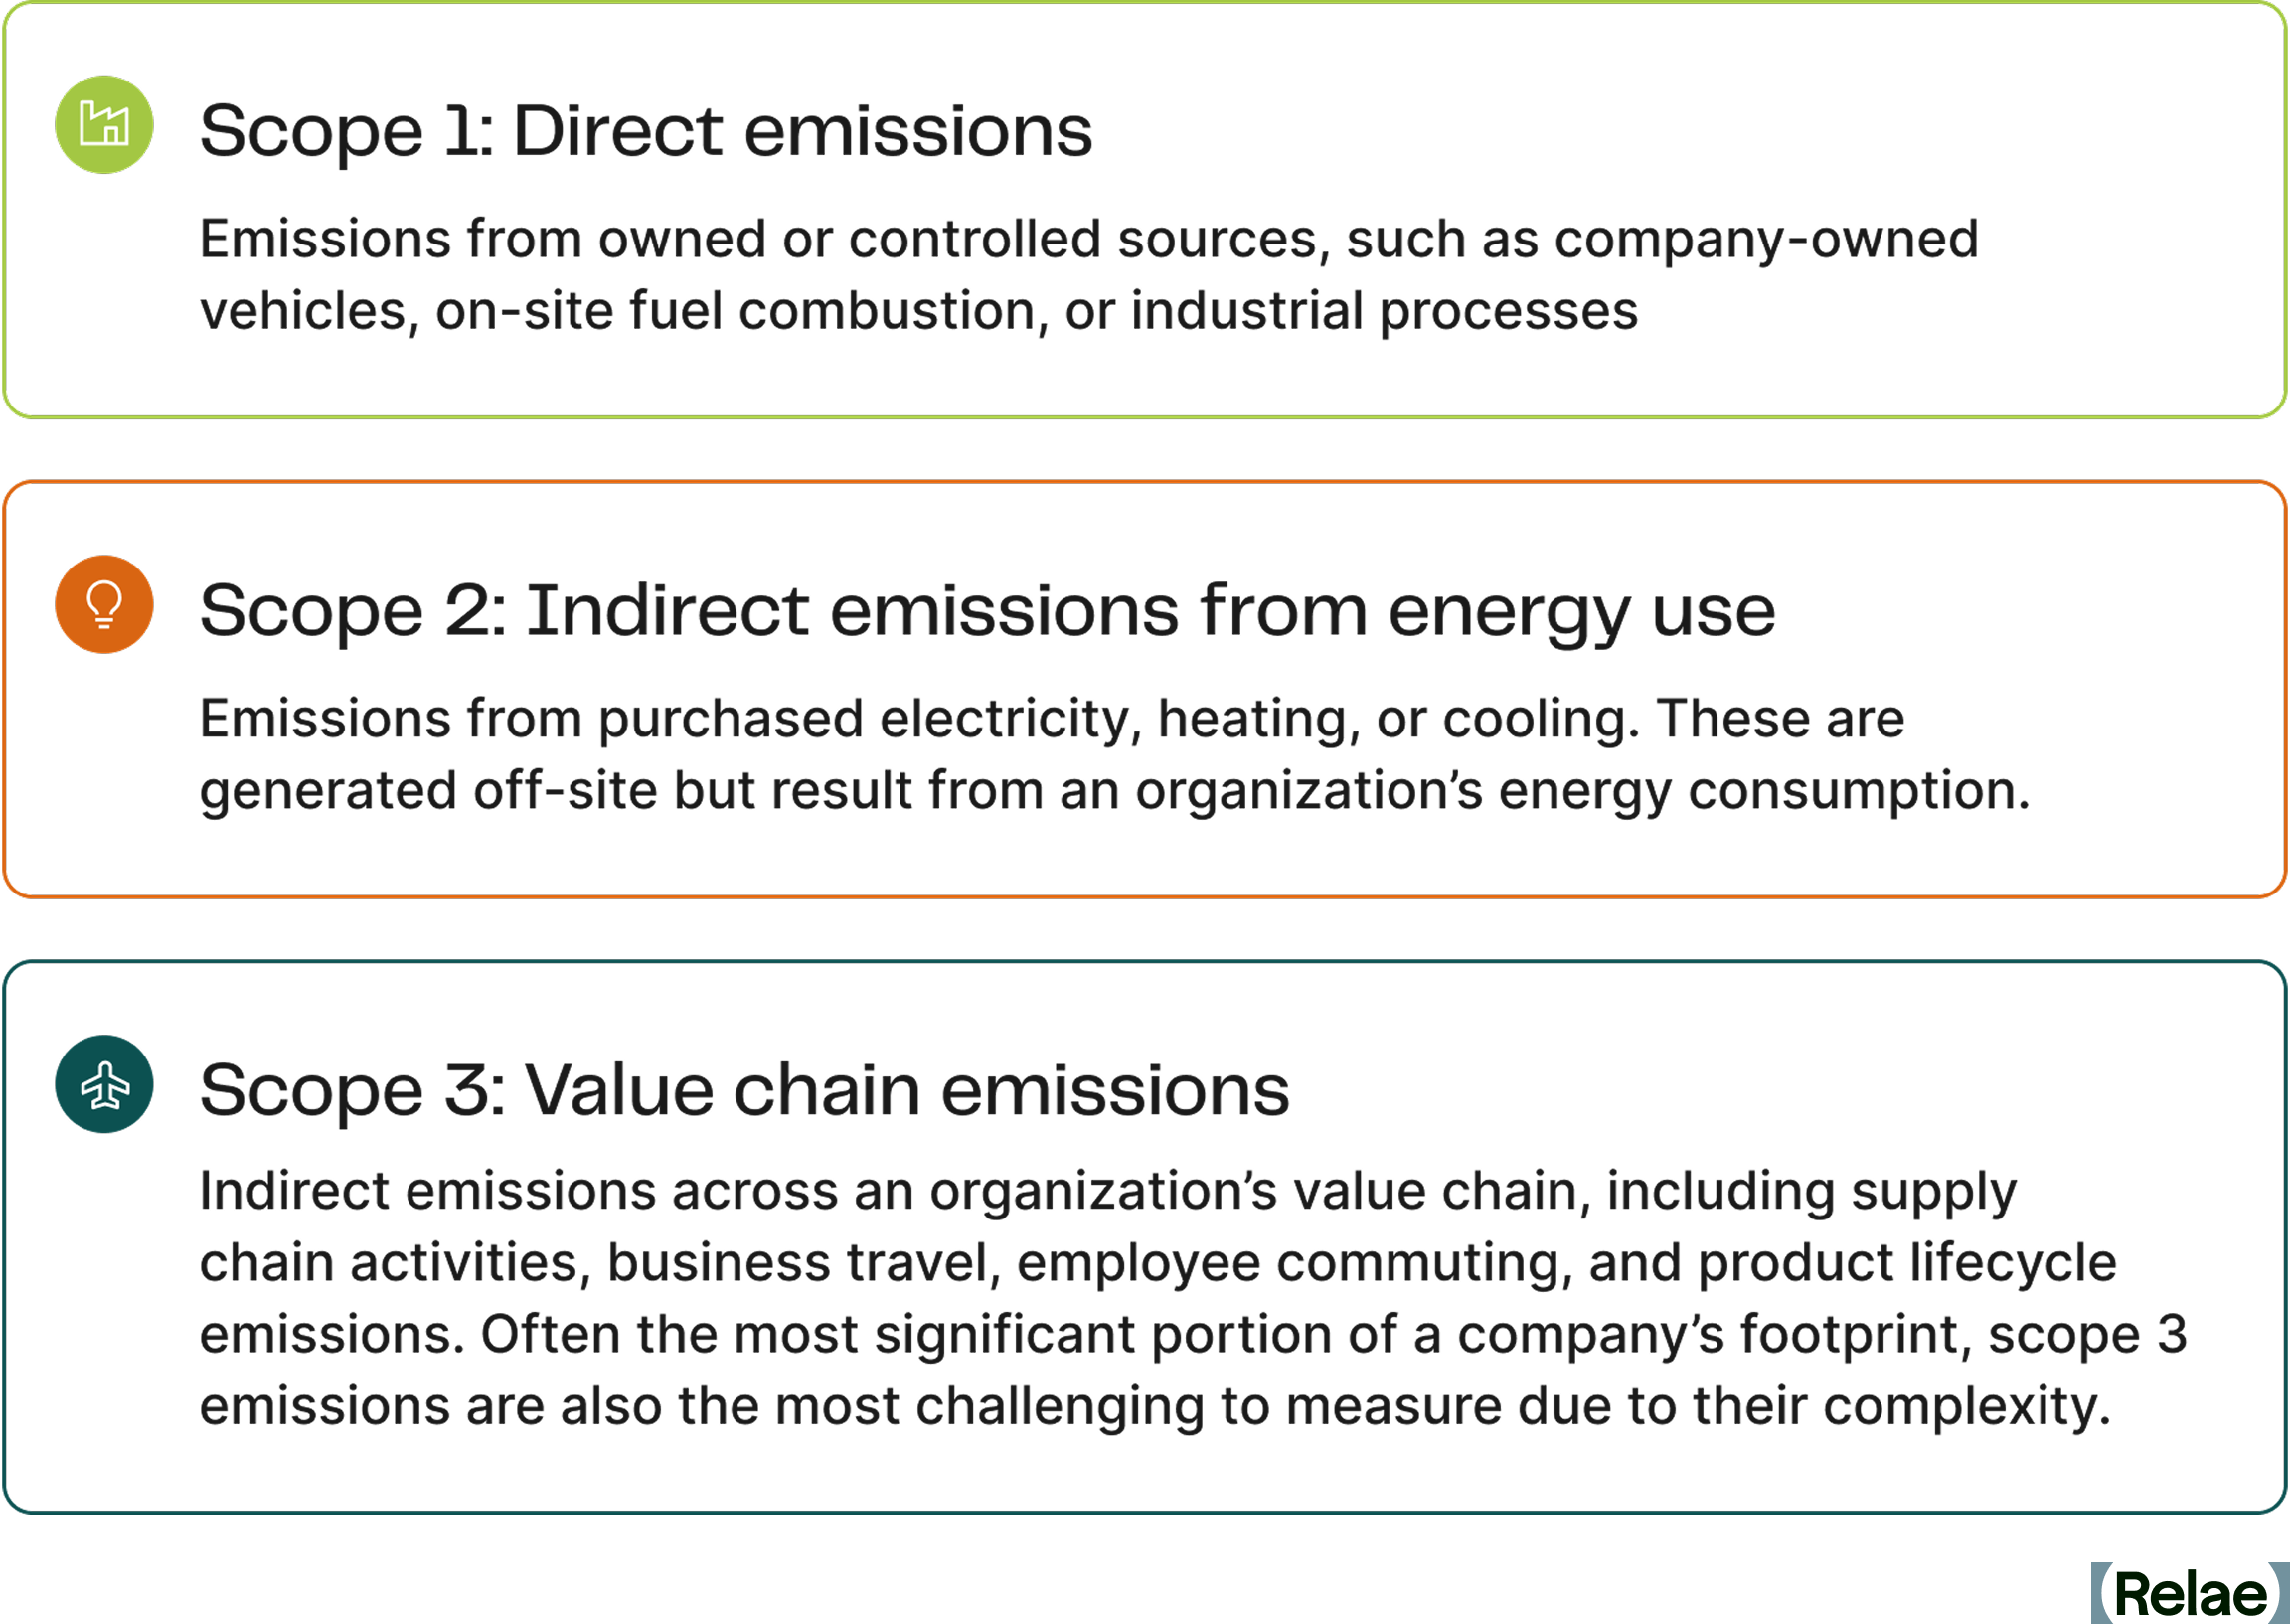
- Direct emissions (scope 1): Produced from owned or controlled sources such as fuel purchased and consumed onsite for operating facilities and vehicles.
- Indirect emissions (scope 2): Generated from purchased energy such as purchased electricity for powering offices and facilities.
- Value-chain emissions (scope 3): Generated from the direct and indirect emissions from upstream and downstream value chains including purchased goods and services, business travel and employee commutes, and investments.
Types of Emissions Data
For all three emissions categories, there are two broad types of data to collect: activity data and financial spend data:
- Activity data uses units of measurement associated with the emissions-generating activity. For example, the liters of fuel consumed in a year, or the number of kilowatt-hours of energy used.
- Financial spend data, typically sourced from accounting teams and software systems, is used to estimate emissions from spending. Financial spend data may, for example, use the amount spent on business travel to estimate emissions.
Sourcing both activity data and spend data typically requires the help of a range of stakeholders across an organization. For example, facilities and office managers may provide fuel and electricity bills, while a company’s accountant may provide financial data.
While both approaches are valid under the GHG Protocol, there can be costs and benefits to the organization associated with different data sources and methodologies. You must weigh these carefully before aligning on an approach. Not all companies have the data infrastructure in place to support activity data across all of the scopes. While spend data is generally more accessible, it may not deliver a complete picture of emissions reductions—for example, if a company’s employees traveled fewer miles this year than last, but spent more on flights, using a spend data approach might result in an overestimate of emissions compared to an activity data approach.
Step 2: Calculate Your Emissions
To start calculating your emissions, you’ll need to determine the emission factor—the ratio between pollutants emitted and activity conducted or amount spent. For example: Because a gallon of gasoline emits 8.78 kg of CO2 when burned in an engine, the emissions factor would be 8.78 kg CO2 per gallon of gasoline.
Emissions factors are then multiplied by the associated activity or spend data, and the results are summed to estimate a company’s total emissions. To ensure consistent year-on-year reporting and auditability, the emissions factors used should be carefully documented and aligned with the GHG Protocol.
Step 3: Verify Data and Report Your Results
Once calculations are ready, the final step is to verify your information. Have a second internal team or an external expert carefully review the data to check for gaps and ensure it is correctly categorized by emissions source. This can help avoid errors like double counting and miscategorization. Under certain reporting requirements such as CSRD, an external audit is required.
Once data is verified, you can report your findings to internal stakeholders, and disclose it externally if you choose. This information should be presented in a clear, consistent format that includes both emissions data and final calculations broken down by source, as well as links to relevant data to back up your claims.
Step 4: Take Action and Track Progress
Now that you’ve reported the results, your internal stakeholders will be armed with the data they need to do the most critical next step: Set climate targets and take action. Reporting carbon emissions estimates establishes the climate impact of your business activities, allowing you to set realistic, informed targets.
From there, you might compare your total emissions with your competitors and identify your top emissions sources. Reports also help you identify the most achievable reduction opportunities and consider how to address your harder-to-abate emissions, helping you develop a comprehensive carbon management plan.
The carbon accounting process doesn’t stop once you’ve set your plan in motion: Tracking progress requires ongoing emissions measurement to produce annual emissions reports. Action coupled with ongoing carbon measurement is the foundation of an integrated carbon management strategy: It’s what allows you to assess, adapt, and optimize your sustainable transition plan. This gives you the data you need to see and prove your long-term progress, and confidently share your results with customers and investors.
[cta]
Scope 1 Emissions Explained: How to Track, Report, and Reduce Operational Carbon
Key Takeaways
- Scope 1 emissions are direct and controllable, making them a powerful starting point for decarbonization.
- Reducing scope 1 emissions can improve energy efficiency and lower operating costs.
- Reporting on scope 1 emissions is now required under new climate regulations, and companies that act now will gain an edge.
Why Scope 1 Emissions Matter Now
When we talk about corporate decarbonization, scope 2 and scope 3 emissions tend to take up the headlines, with a focus on renewable energy certificates (RECs) or challenges like complex supply chains. But scope 1 emissions, those produced directly from sources a company owns or controls, don’t get as much airtime. This is a missed opportunity.
As AI data center growth pushes companies towards on-site power, more organizations are confronting scope 1 boundaries for the first time. Scope 1 emissions enable companies to take immediate, tangible action to cut carbon, drive operational efficiencies, and get ahead of growing regulatory pressure.
What Are Scope 1 Emissions?
Scope 1 emissions are the direct greenhouse gas (GHG) emissions from sources that a company owns or controls. They mostly come from activities where fuels are combusted on-site within an organization’s operations. For industries that combust high amounts of fuels within their operations (e.g., oil and gas, chemicals, manufacturing), scope 1 can represent a significant share of the company’s emissions. For industries that outsource most of their production, scope 1 can be a smaller share of the overall footprint.
Scope 1 emissions typically fall into four categories:
- Stationary combustion: Emissions from burning fuels on-site for heating, manufacturing, or electricity generation. This includes boilers, furnaces, and turbines at company facilities.
- Mobile combustion: Emissions from company-owned or operated vehicles and equipment, such as cars, aircraft, delivery fleets, ships, or construction machinery.
- Fugitive emissions: Unintentional leaks or releases of gases, often from refrigeration and air conditioning systems. These can have an outsized impact because many refrigerants have global warming potentials (GWPs) hundreds or even thousands of times greater than carbon dioxide.
- Self-produced energy: Emissions from electricity, heat, or steam generated on-site, such as through natural gas-fired generators or cogeneration plants, even when the energy is used internally.
Identifying and categorizing scope 1 emissions correctly are the first steps toward uncovering potential operational improvements and carbon reduction approaches.
On-Site Power for AI Data Centers
As AI pushes data center operators toward on-site (“behind-the-meter”) power, a high-stakes accounting question follows: are those behind-the-meter emissions scope 1 or scope 2? The answer comes down to control, not location.
Under the GHG Protocol, emissions from on-site generation are scope 1 only when the reporting company owns or financially controls the generating asset (i.e., the self-produced energy category above). In most data center power deals, a third party owns and operates the generator and sells the electricity to the data center. In that structure, the company buying the power reports the emissions as scope 2, and the company generating the power reports the combustion as scope 1. Given the growth in emissions from the scale of AI infrastructure, getting the boundary right matters for corporate credibility.
Why Scope 1 Emissions Are a Strategic Priority
While scope 3 is often talked about as the largest source of emissions for corporations, that isn’t the case for all industries. For heavy sectors like oil and gas, chemicals, and manufacturing, scope 1 emissions aren't just significant - they are the bedrock of the emissions story. Other industries depend on these sectors' outputs to operate their own businesses, meaning that decarbonizing heavy industries’ scope 1 emissions can also drive reductions across other organizations’ scope 3 emissions.
Since scope 1 emissions are typically within a company’s direct operational control, they present a great starting point for decarbonization. Unlike scope 3 emissions, which require influencing suppliers, customers, or partners, companies can take immediate action on scope 1 sources. Even for industries with relatively small scope 1 footprints, reductions can often happen more quickly through internal decisions, such as equipment upgrades, process improvements, or fuel switching.
Regulatory momentum is also making scope 1 management increasingly urgent. Policies like the European Union’s Corporate Sustainability Reporting Directive (CSRD), California’s Climate Corporate Data Accountability Act (SB 253), and global ISSB-aligned frameworks are requiring companies to measure and publicly disclose their scope 1 emissions. Even within voluntary frameworks, reporting on scope 1 emissions is getting tighter. Within the Science-Based Targets Initiative (SBTi)’s new draft Net Zero Standard, scope 1 emissions must now have a separate target from scope 2 emissions, and the boundary must cover 100% of scope 1 emissions whereas previously the boundary was 95% of emissions. These market shifts highlight the importance of reducing scope 1 emissions.
Operationally, reducing scope 1 emissions offers business value. Many scope 1 reduction strategies, such as upgrading to more efficient equipment or reducing fuel waste can lower energy bills, improve asset performance, and reduce maintenance costs. For companies focused on both sustainability and profitability, targeting scope 1 emissions delivers a strong return on investment.
How to Calculate Scope 1 Emissions
To reduce scope 1 emissions, companies need to know exactly what and how much they are emitting. Calculating scope 1 emissions starts with gathering the right data at the facility level and understanding the activities that generate emissions.
What to Measure
Scope 1 emissions come from activities such as fuel combustion in boilers or vehicle fleets, refrigerant leaks from cooling systems, and on-site energy generation. Ideally, companies should collect activity data, like gallons of diesel used, cubic meters of natural gas consumed, or kilograms of refrigerant leaked and replaced. In cases where direct measurement isn’t possible, companies often rely on estimations, using financial spend data or industry intensity metrics as a proxy for fuel consumption.
Where to Find the Data
Facility-level data is the backbone of comprehensive and comparable scope 1 accounting. Much of the required data can be sourced from utility bills, fuel receipts, maintenance logs for HVAC and refrigeration systems, and reports from on-site equipment operators. Increasingly, companies are deploying sensors to capture real-time data on fuel consumption, refrigerant leaks, and on-site energy generation, improving both accuracy and responsiveness.
How to Calculate the Emissions
Emissions are calculated by applying the emissions factors (i.e., the amount of greenhouse gases emitted per the quantity of fuel or refrigerant) to the collected activity data. Many companies use carbon accounting software to automate calculations, track emissions over time, and ensure consistency with recognized standards like the GHG Protocol. Expert support is often critical, especially for sectors with complex operations. Carbon accounting experts help ensure the data is complete, auditable, and aligned with evolving regulatory requirements.
Accurate scope 1 data builds a strong foundation for compliance as well as for setting credible reduction targets and tracking long-term performance.
How to Reduce Scope 1 Emissions
With scope 1 emissions data in hand, companies can begin identifying and implementing reduction strategies. Because these emissions are within the organization’s operational control, companies often have multiple levers they can pull.
Operational Strategies
- Fuel switching: Replacing fossil fuels like natural gas or diesel with lower-carbon alternatives, like green hydrogen or renewable electricity, can significantly reduce direct emissions from stationary and mobile combustion. Depending on the switch, this could result in higher scope 2 emissions, but these can be more readily addressed through market-based instruments, thus lowering the overall footprint.
- Equipment upgrades: Modernizing boilers, generators, fleets, and other combustion-based equipment can improve energy efficiency and cut emissions. Newer technologies often perform better and emit less.
- Process innovation: In emissions-intensive industries like cement and steel production, rethinking industrial processes can yield dramatic reductions. Low-carbon production methods are increasingly becoming commercially viable.
- Leak detection and repair: Methane leaks from oil and gas operations and refrigerant leaks from cooling systems are major contributors to scope 1 emissions. Deploying monitoring technologies and maintaining rapid-response repair programs can fix leaks before they lead to large amounts of emissions.
Strategic Procurement
- Vendor selection: Companies can prioritize suppliers that offer lower-emissions alternatives for fuels, materials, and services.
- Fleet electrification: Procuring electric vehicles for delivery, service, and logistics fleets reduces both emissions and long-term fuel and maintenance costs.
- Equipment design: Working with suppliers to source modular, emissions-efficient machinery can reduce on-site fuel use and improve flexibility over time.
Driving Innovation Through R&D
- Low-carbon products: Research and development teams can design products and processes that inherently require less energy, or lower-carbon energy, to produce, lowering scope 1 emissions at the source.
- Material innovation: Developing new chemistries or alternative materials can avoid high-emission production methods, contributing to broader decarbonization goals.
- Closed-loop systems: Designing circular, waste-reducing systems can minimize both raw material use and the on-site emissions associated with production and disposal.
Reducing scope 1 emissions often requires up-front investment, whether it’s upgrading equipment, switching to alternative fuels, or embedding low-carbon principles into procurement and R&D strategies. While the initial costs can be substantial, they deliver long-term value through improved operational efficiency, reduced regulatory risk, lower energy expenses, and enhanced brand value in a marketplace that increasingly rewards climate leadership.
Frequently Asked Questions
What are the main categories of scope 1 emissions?
Scope 1 emissions fall into four categories: stationary combustion (fuels burned on-site in boilers, furnaces, or turbines), mobile combustion (company-owned or -operated vehicles and equipment), fugitive emissions (leaks of refrigerants or methane, which often carry outsized global warming potential), and self-produced energy (electricity, heat, or steam generated by equipment the company owns or controls).
Which regulations require companies to report scope 1 emissions, and when do they take effect?
The EU’s Corporate Sustainability Reporting Directive (CSRD) already requires scope 1 disclosure for companies in its first reporting waves. In the US, California’s SB 253 requires companies with over $1 billion in annual revenue doing business in California to report scope 1 and scope 2 emissions, with first reports due November 10, 2026. ISSB-aligned disclosure rules are extending similar requirements across other jurisdictions.
What’s the fastest way for a company to start reducing scope 1 emissions?
Start by measuring at the facility level, since this activity data shows where emissions concentrate. From there, the quickest wins are usually operational, such as repairing refrigerant and methane leaks, upgrading inefficient combustion equipment, and electrifying vehicle fleets, because they sit within the company’s direct control and often pay back through lower fuel and maintenance costs.
Is behind-the-meter power scope 1 or scope 2?
It depends on who controls the generating asset. If a company owns or financially controls its on-site generation, the emissions are scope 1. If a third party owns and operates the generator and sells the power- the structure behind most data center power deals- the buyer reports those emissions as scope 2 under the GHG Protocol’s Scope 2 Guidance.
Electricity Emissions Accounting: GHG Protocol and LCA Explained
Key Takeaways
- The GHG Protocol Corporate Standard and life cycle assessment (LCA) offer distinct frameworks for measuring electricity-related emissions, one for annual corporate reporting and one for detailed cradle-to-grave analysis, leading to different emissions results.
- Renewable energy certificates (RECs) are accepted under the GHG Protocol's market-based approach to reduce reported scope 2 and scope 3: category 3 emissions, but are not explicitly addressed in ISO LCA standards, where transparent disclosure is essential.
- Using both the GHG Protocol and LCA together, while recognizing their different scopes, boundaries, and purposes, can give organizations a more complete and strategic view of electricity-related emissions and decarbonization opportunities.
Electricity-Related Emissions: Why Measurement Methods Matter
In the era of AI-driven power demand, scrutiny over electricity-related emissions is intensifying. With this increased attention comes growing confusion around how to measure and report these emissions. The GHG Protocol Corporate Standard and life cycle assessment (LCA) are two widely used methods for measuring and reporting electricity-related emissions, but each follows its own complex and often incompatible, set of rules.
This piece will examine the differences between these approaches and answer common questions such as:
- What are the differences between the GHG Protocol Corporate Standard and LCA?
- Why do they result in different emissions for the same type and amount of electricity?
- Can renewable energy contracts reduce electricity-related emissions under both methods?
- When should you use each approach?
Both the GHG Protocol Corporate Standard and LCA are powerful tools that, if used in complementary ways, can help organizations identify emissions hotspots and develop more effective pathways for decarbonization.
What Is the GHG Protocol Corporate Standard?
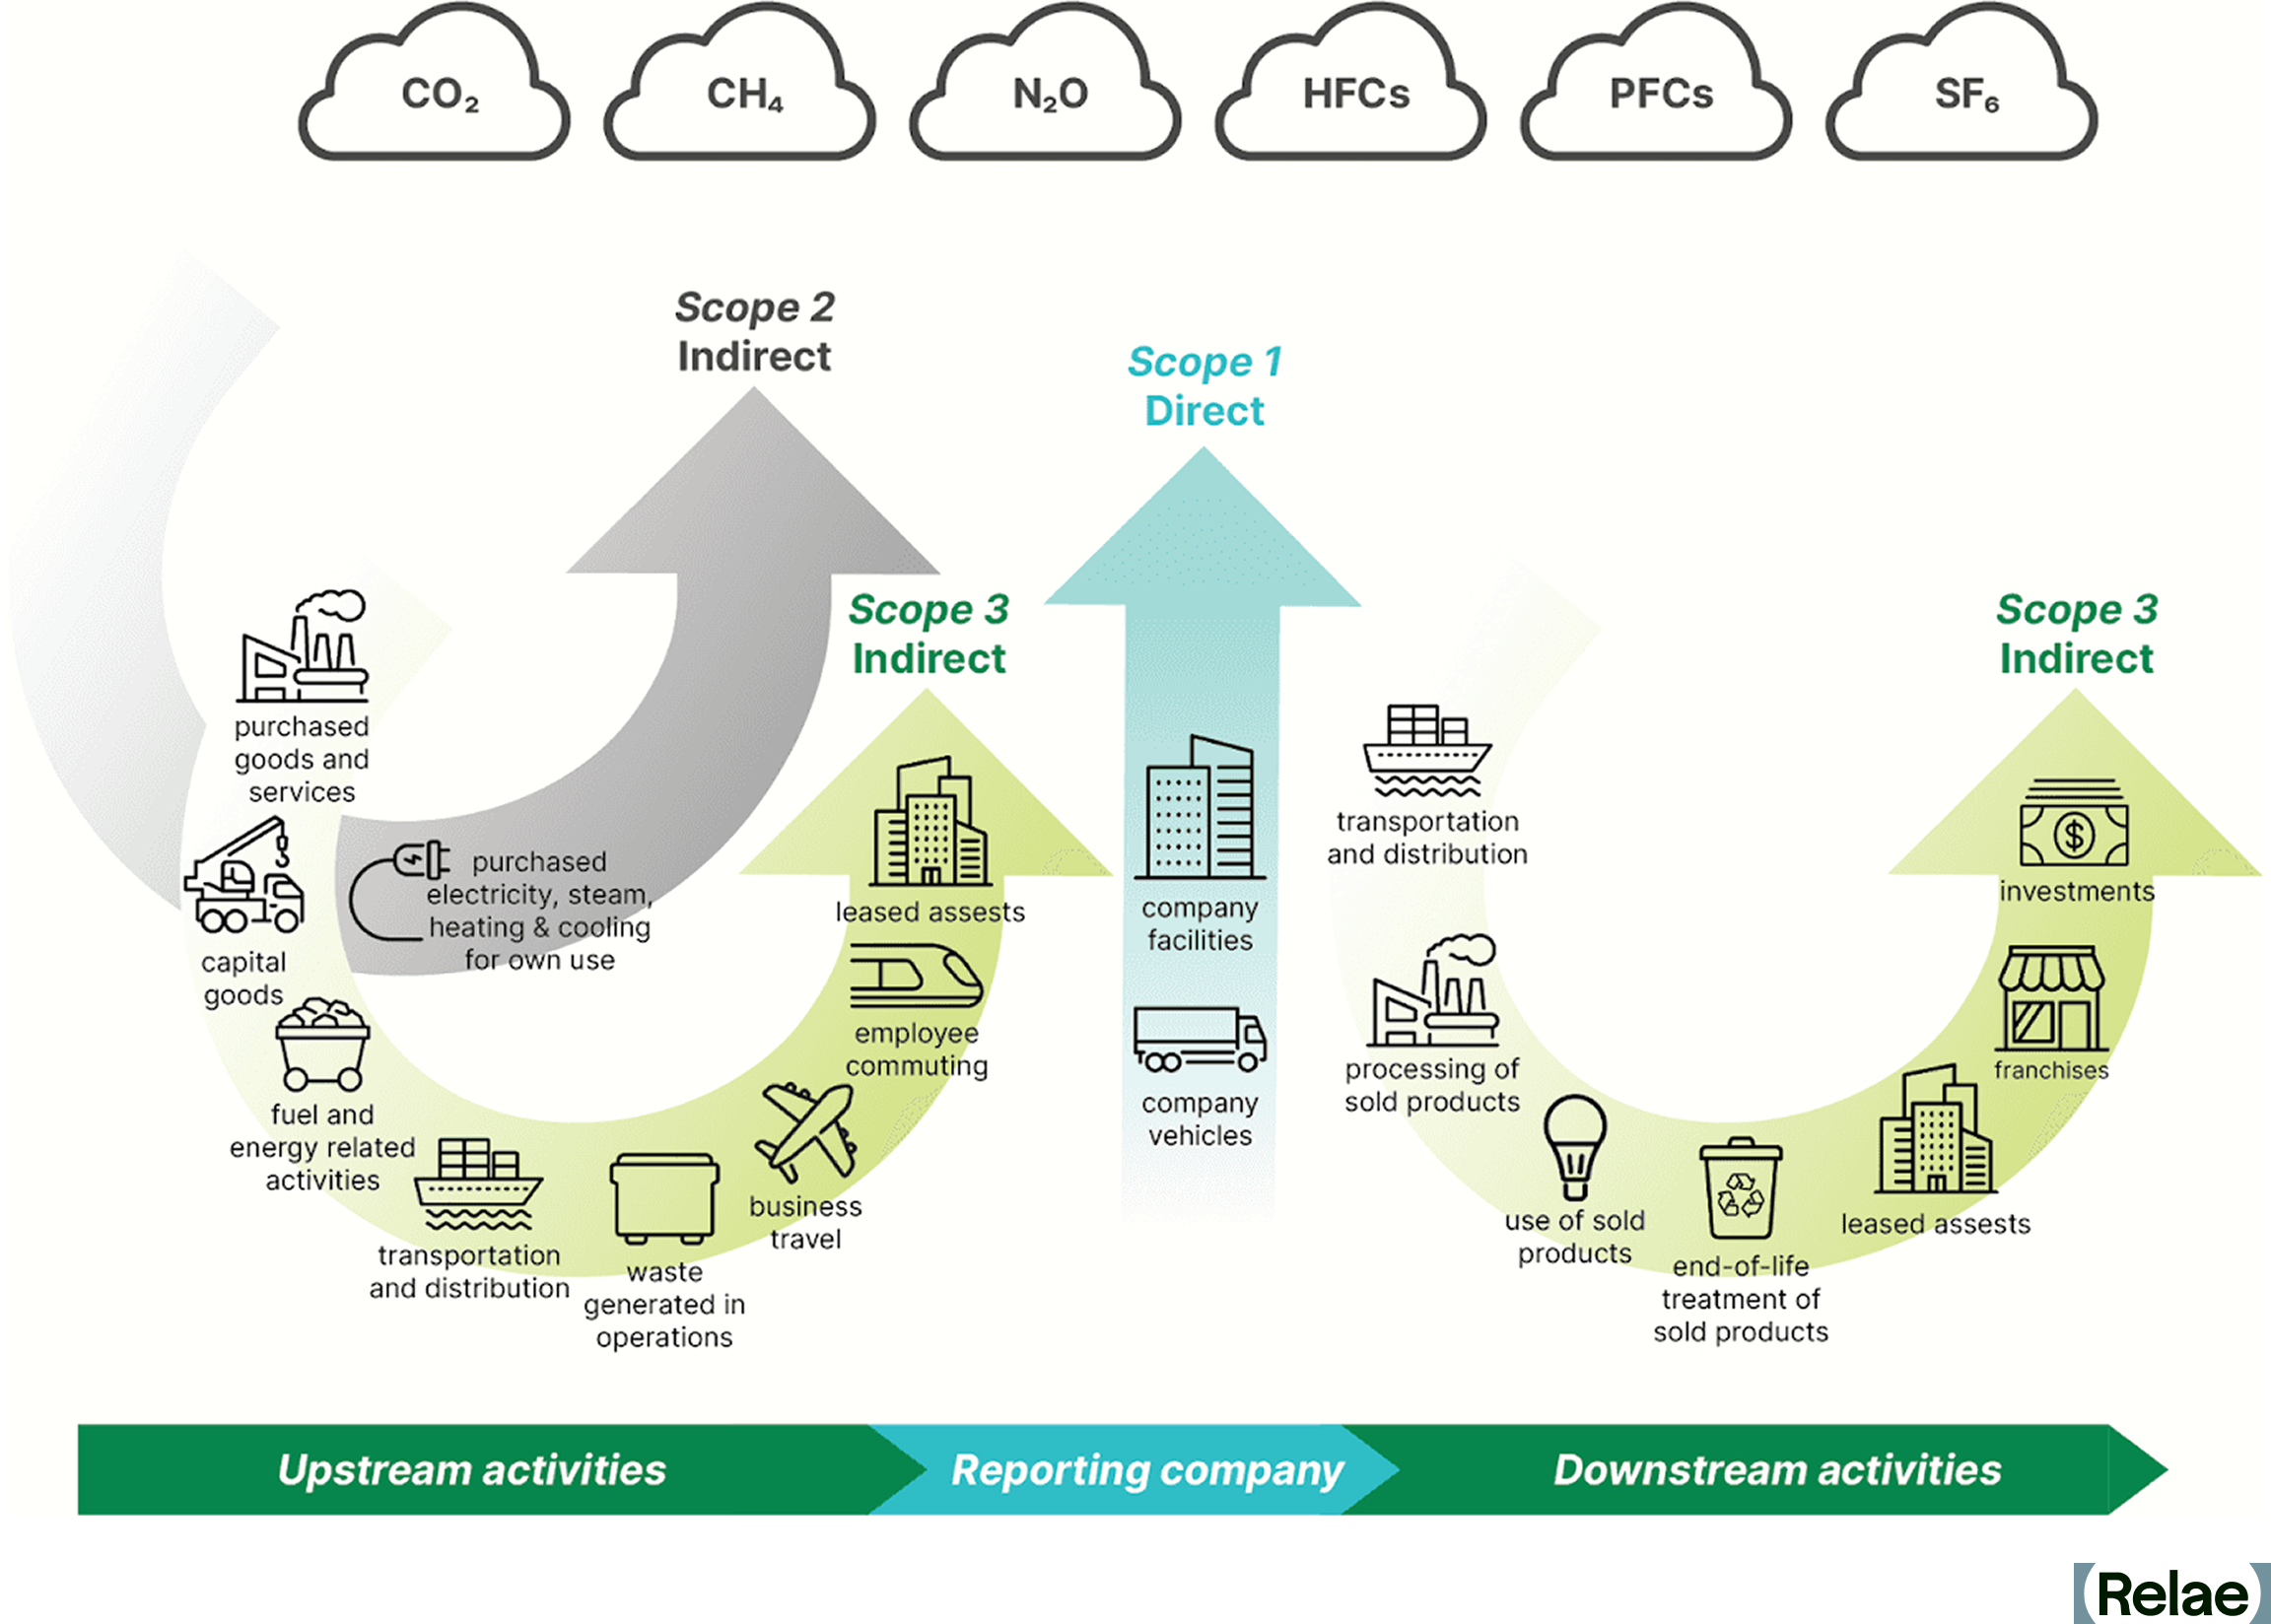
The GHG Protocol Corporate Standard is a globally recognized framework for corporate entities to publicly report GHG emissions throughout their value chain. It divides emissions into three scopes:
- Scope 1: Direct emissions from owned or controlled sources, such as company-owned vehicles, on-site fuel consumption, or industrial processes.,
- Scope 2: Indirect emissions from the generation of purchased electricity, heat, steam, or cooling. These emissions are generated off-site, but result from an organization's energy consumption.
- Scope 3: Indirect emissions across an organization's value chain. Scope 3 is divided into 15 categories, including a company's supply chain activities, business travel, employee commuting, investments, and product life cycle emissions.
This piece focuses on emissions associated with electricity consumed by a reporting entity. These electricity-related emissions primarily fall under scope 2 and scope 3: category 3 (fuel- and energy-related activities, or FERA).
Scope 2: Electricity Generation Emissions
Scope 2 emissions account for the generation of electricity a company purchases or uses. Hypothetically, if a company were powered by a single solar project, it would report zero scope 2 emissions. In reality, a company is powered by a combination of power generation assets and must report them under scope 2 emissions. These emissions can be reported using two methods:
- Location-based method: Reflects the average emissions intensity of the local electricity grid where the consumption occurs. This approach is mandatory under various reporting frameworks and does not take into account a company's procurement choices.
- Market-based method: Reflects an organization's actual procurement decisions and energy-sourcing strategies. It accounts for specific contracts, such as power purchase agreements (PPAs), renewable energy certificates (RECs), and green tariffs, which allow businesses to claim lower emissions from their purchased electricity.
Scope 3: Category 3 FERA
Scope 3: category 3 FERA reports on non-generation electricity emissions associated with:
- Upstream emissions: Emissions associated with the production and transportation of fuels needed for electricity generation
- Transmission and distribution losses: Emissions associated with the loss of electricity while delivering it from the generator to the consumer.
The GHG Protocol Corporate Standard does not include emissions associated with the manufacturing, construction, and end-of-life phases of electricity generation equipment; however, some datasets used for reporting may include manufacturing emissions. While scope 3: category 3 guidance may not require these emissions to be included, if possible, companies reporting on their electricity-related emissions should include these additional sources of emissions in order to more completely represent their total emissions impact. The GHG Protocol Scope 2 Guidance allows for the reduction of some of the reported scope 3 FERA emissions by contracting renewable energy (see Appendix B).
What is an LCA?
An LCA is a systematic method used to quantify the environmental impacts of a process, product, or project throughout its full life cycle. A life cycle includes everything from raw material extraction ("cradle") to manufacturing/production ("gate") through disposal ("grave").
LCAs primarily follow a standard published by the ISO organization (ISO 14040/14044). The ISO standards establish industry-wide rules for which processes are included and how to assign environmental burdens to products.
An LCA can be used for any product, process, or project, and can estimate multiple different environmental impacts (i.e., climate change, human health, ecotoxicity, eutrophication, ozone depletion).
Electricity-Related Emissions Can Be Different Using the GHG Protocol and an LCA
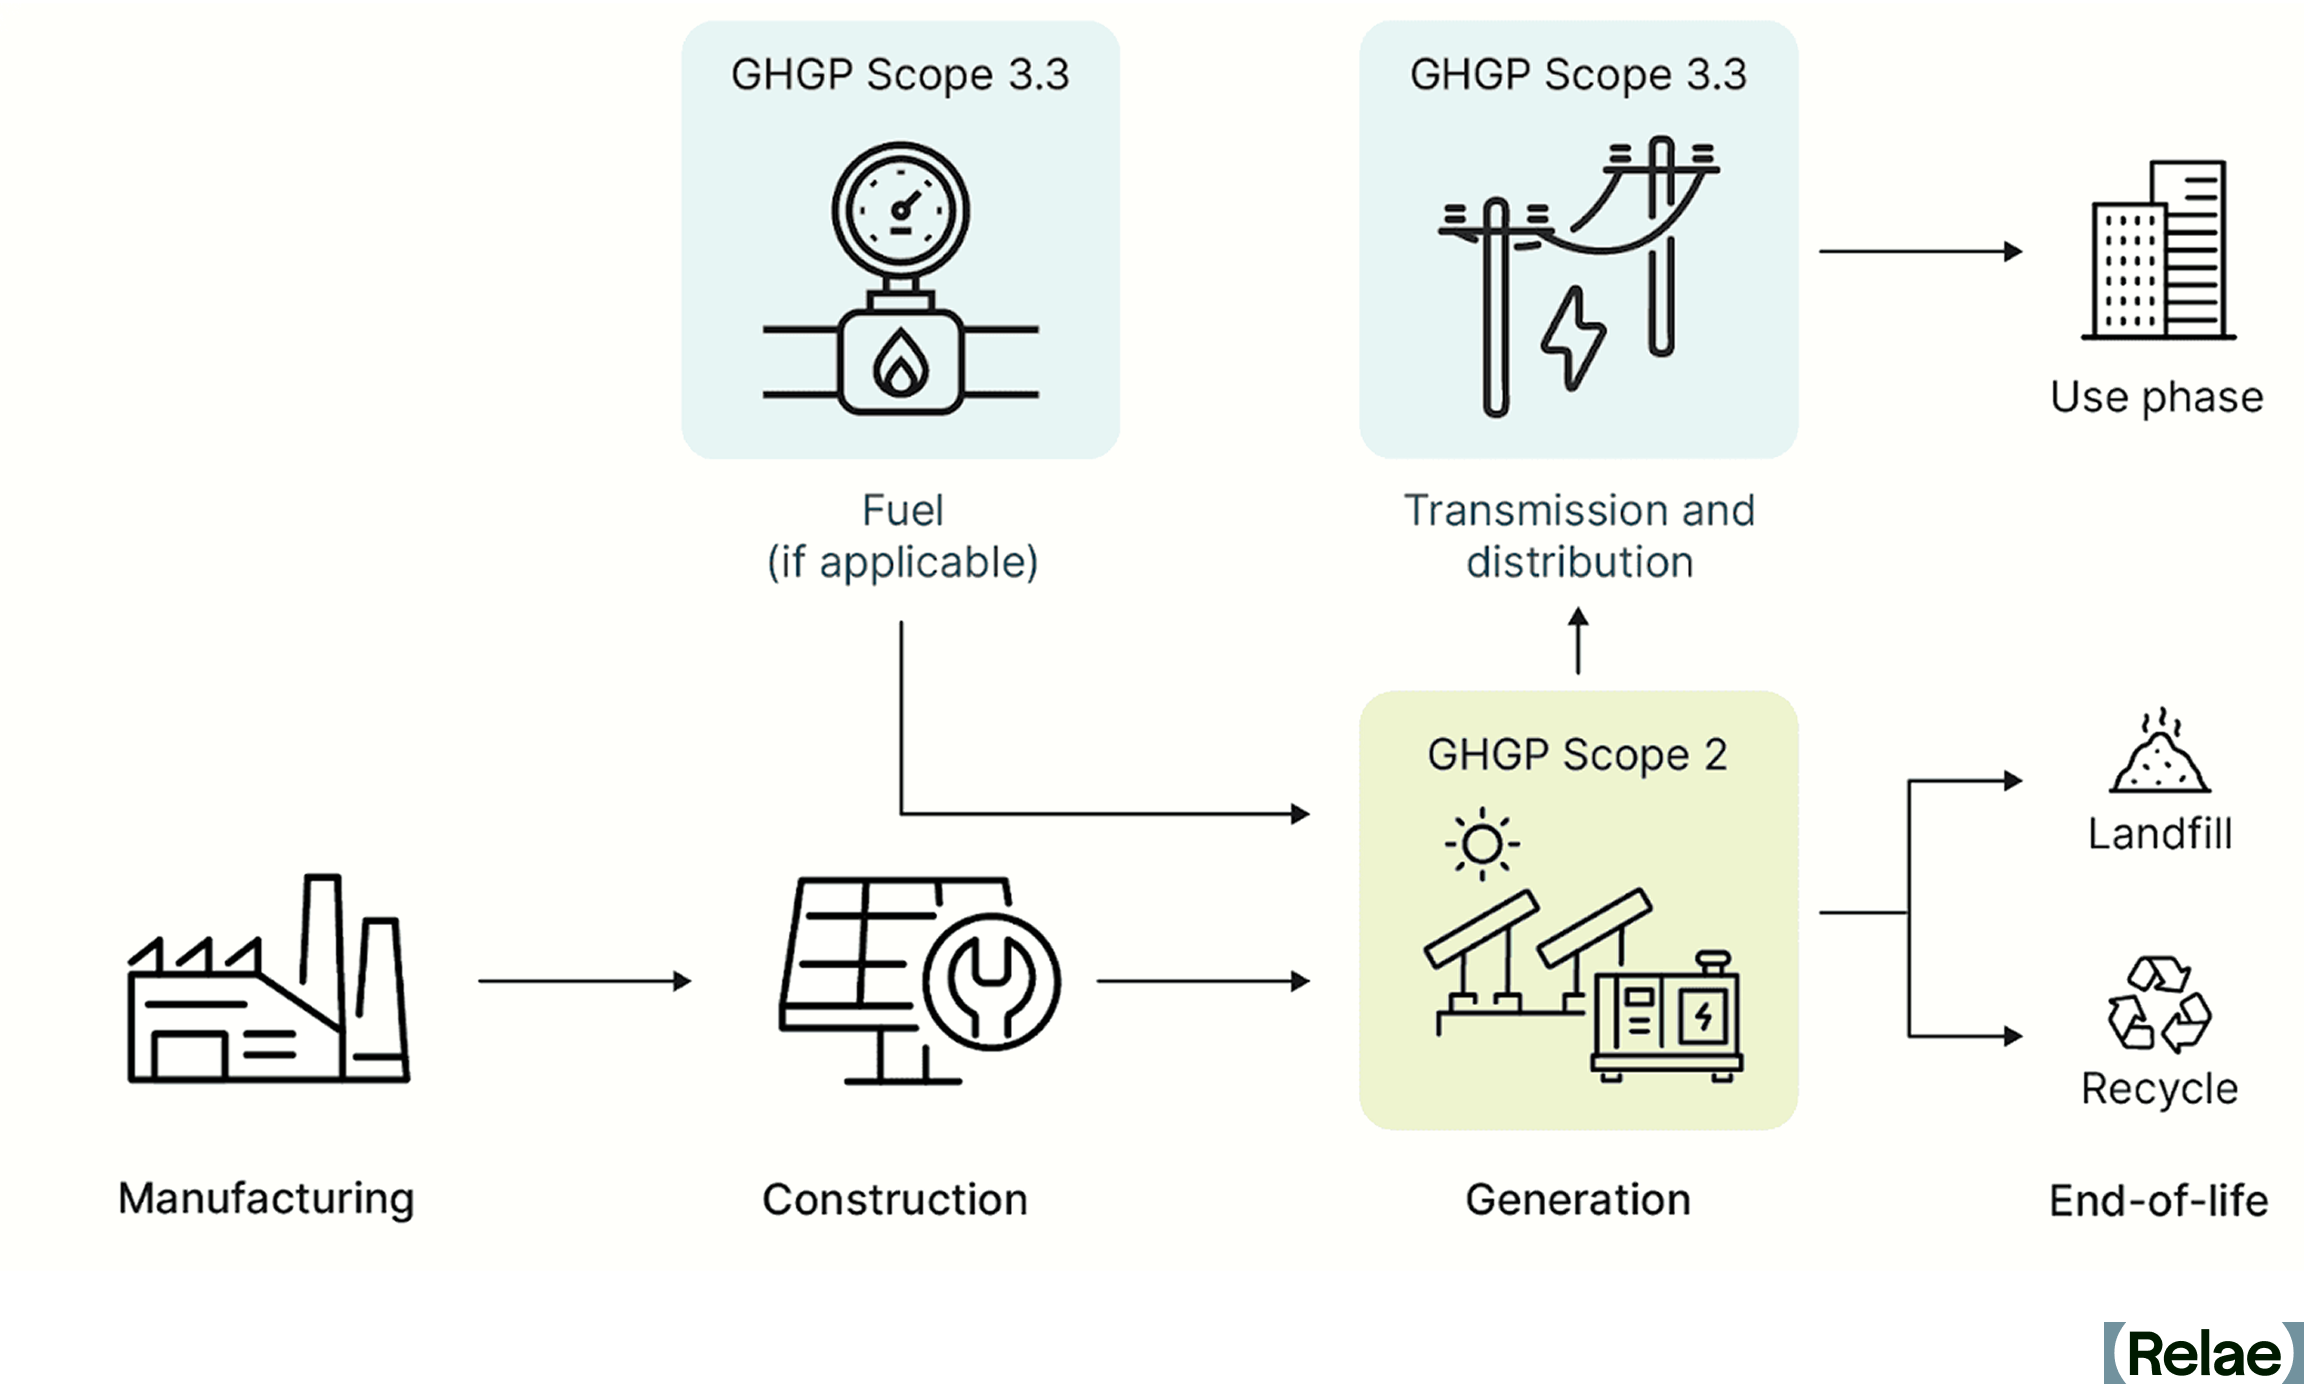
The GHG Protocol Corporate Standard and an LCA (as per ISO standards) generally include different life cycle stages of electricity use when estimating GHG emissions. Therefore, the approaches can result in different reported emissions.
Key Differences in Reporting Electricity-Related Emissions
The GHG Protocol Corporate Standard includes emissions in the following phases:
- Generation (scope 2)
- Transmission and distribution losses (scope 3: category 3)
- Fuel, if applicable (scope 3: category 3)
A “cradle-to-grave” LCA considers emissions from all activities associated with power generation, including:
- Manufacturing
- Construction
- Generation
- Fuel, if applicable
- Use-phase, if applicable
- End-of-life
Use-phase electricity-related emissions are emissions generated by electricity-consuming equipment used or sold by the reporting company (representing additional scope 1 or scope 3 emissions, respectively). Examples include sulfur hexafluoride (SF6) emissions from electrical transformers or refrigerant leakage from air conditioners with high global warming potential. Please note that both the ISO and GHG Protocol Corporate Standard provide guidelines for reporting these emissions. However, due to the equipment-specific nature of these emissions, they are excluded from the following table. The table compares electricity-related emissions associated with different electricity sources using the GHG Protocol Corporate Standard approach and the LCA approach.
Reporting Electricity-Related Emissions
* US average transportation and distribution loss rate (4.2%) times US average grid carbon intensity (410 gCO2e/kWh). Note: gCO2e/kWh = grams of carbon dioxide equivalent per kilowatt-hour. Source: GREET 2024 (US grid average. 10% fuel- and energy-related activities; 1% construction, facilities, maintenance, and end-of-life; 89% fuel combustion).
Reducing Electricity Emissions with Renewable Energy
Renewable Energy Mechanisms Under the GHG Protocol
The GHG Protocol Corporate Standard allows companies to contract for renewable electricity as a mechanism to reduce reported emissions. The GHG Protocol Corporate Standard defines allowable energy contracts that can be used to reduce emissions associated with electricity consumption (market-based reporting).
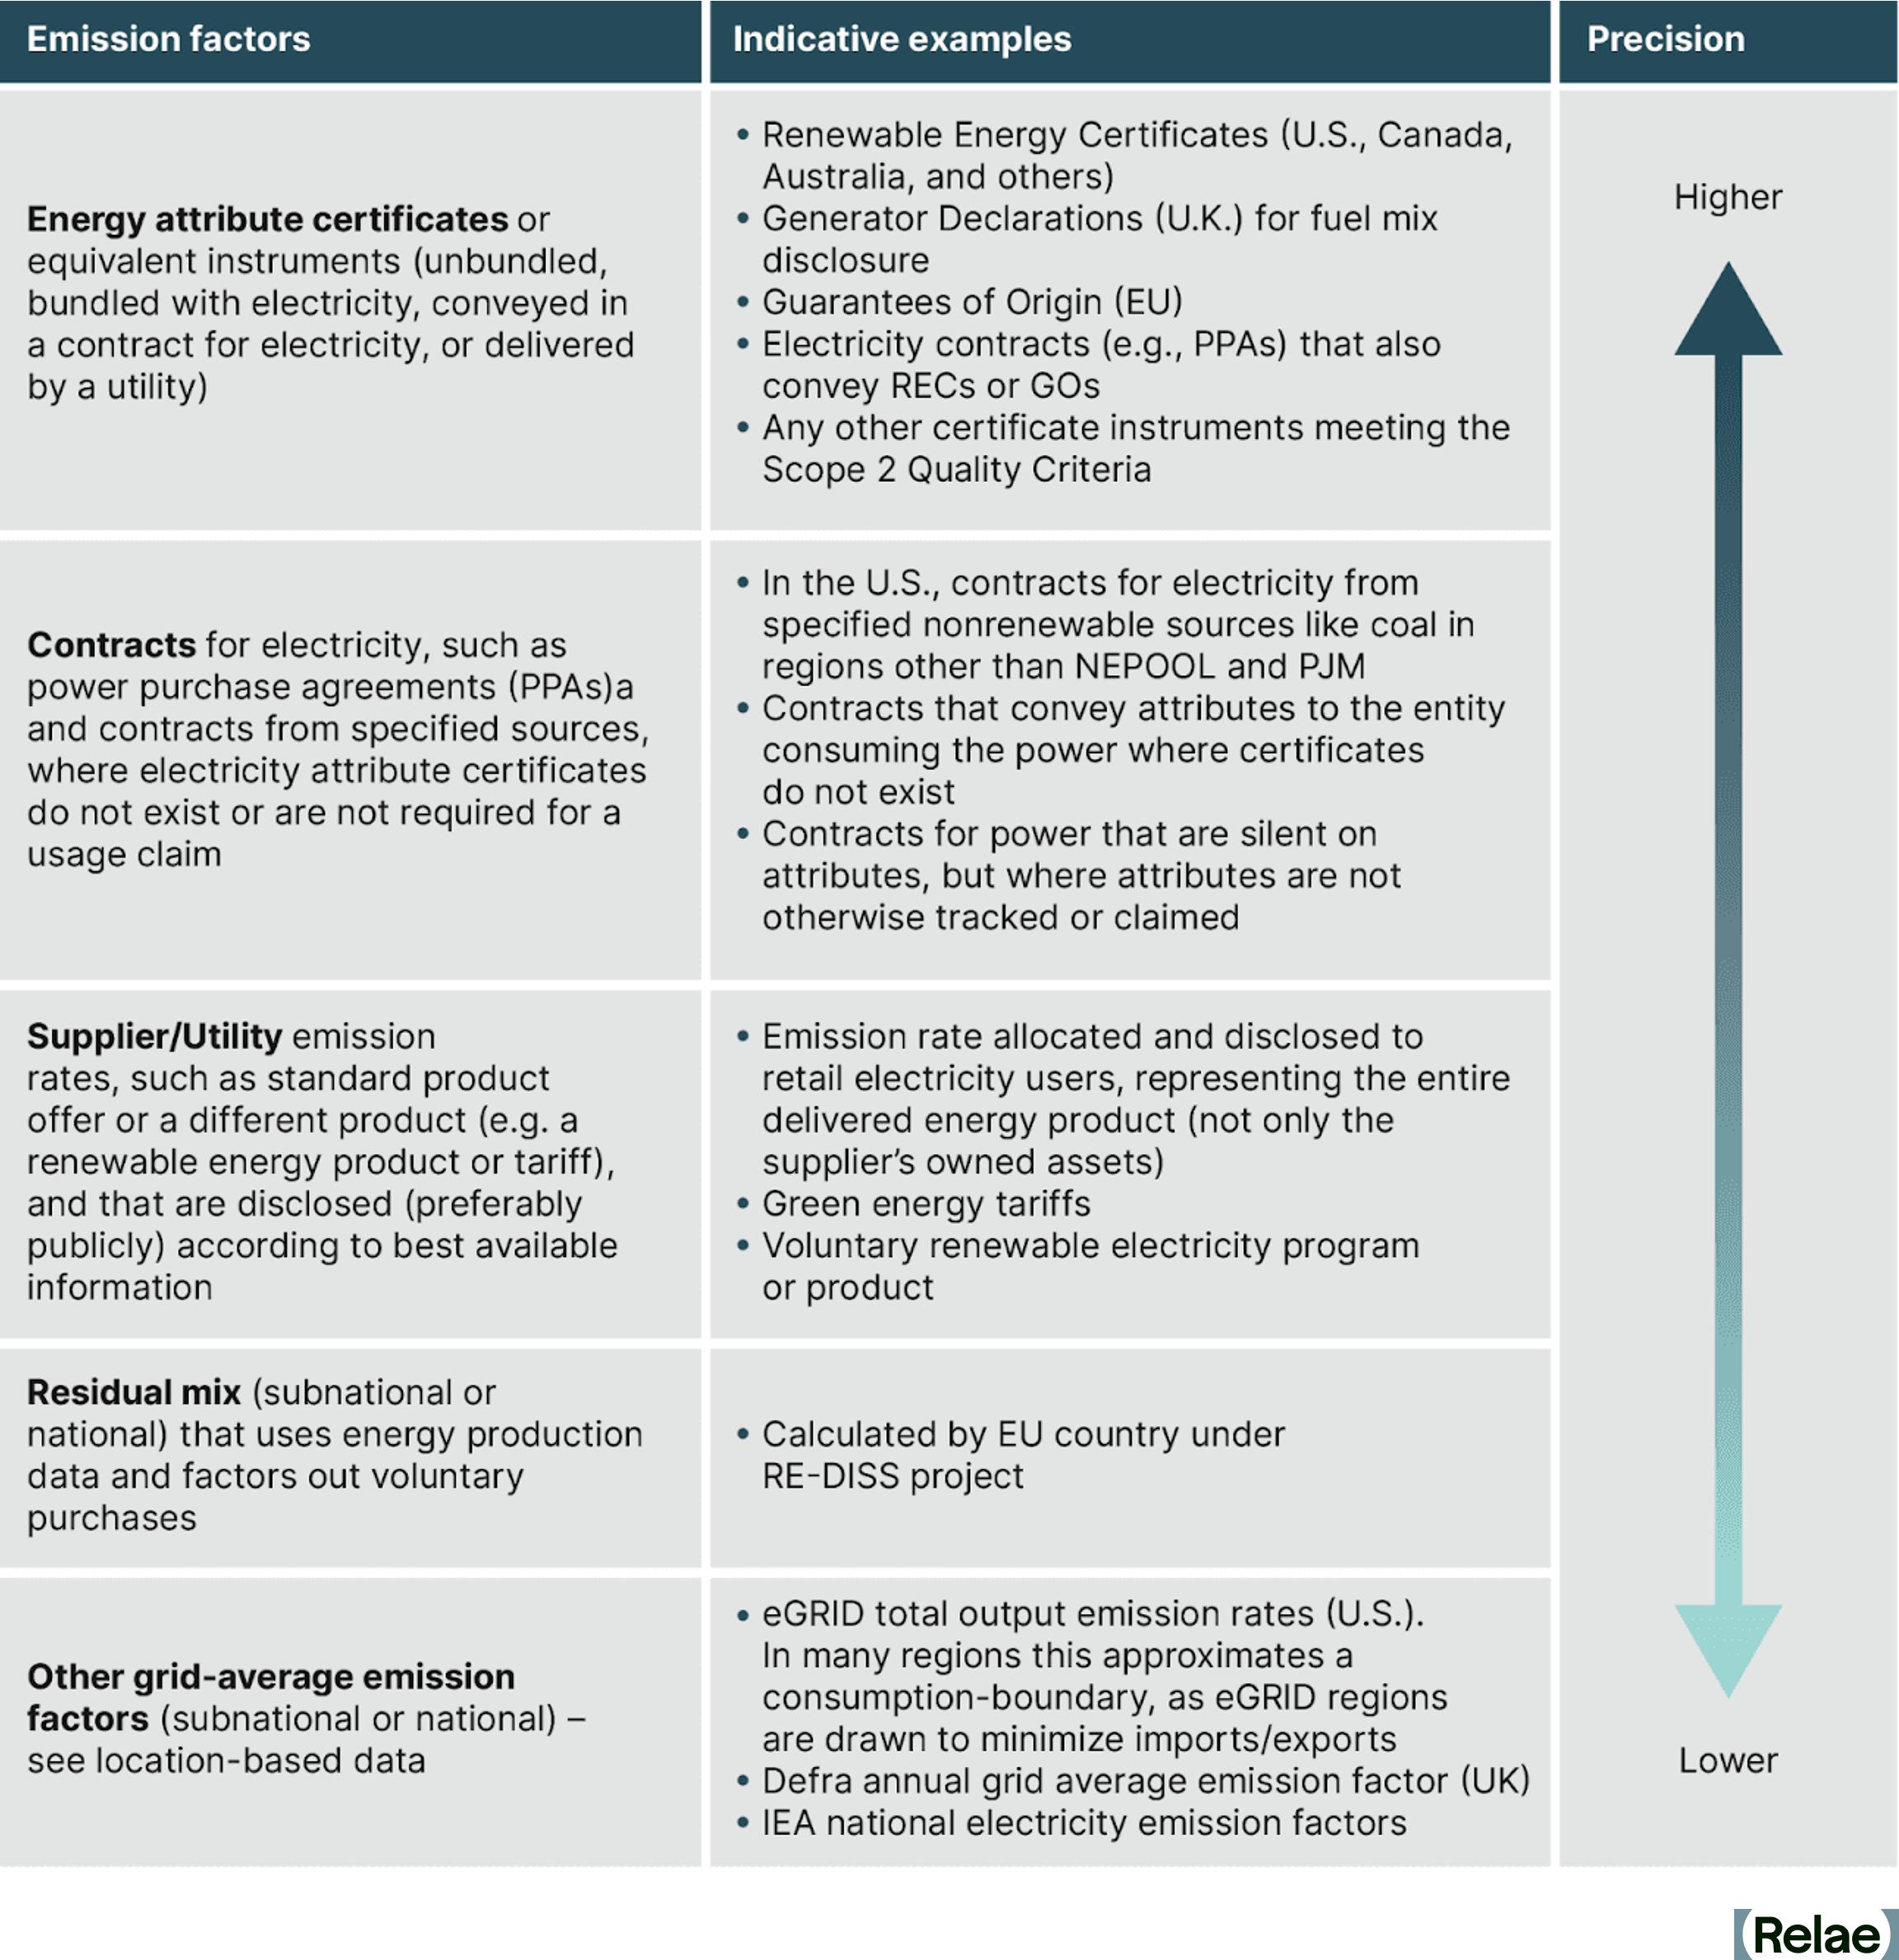
In North America, one of these allowable contracts is RECs, each of which represent one megawatt-hour of renewable generation. Analogous instruments used in other locations, such as Guarantees of Origin in Europe and green electricity certificates in China, are also permissible under the GHG Protocol Corporate Standard.
RECs were developed as a contractual mechanism for renewable electricity in response to the fundamental structure of "a power grid." In a power grid, it is impossible to link a single generator to a single load. Power is injected at a point in the grid and withdrawn at a different point in the grid; there is no traceable pathway.
RECs were created to track the attributes of electricity generation entering into a power grid for the entity that consumes the power at a different point. The GHG Protocol Corporate Standard allows buyers to claim exclusive use of renewable electricity with RECs even if they are actually consuming a mixture of electricity from the grid.
Renewable Energy Mechanisms Under the LCA ISO Standard
The ISO 14040 standard does not address the use of renewable electricity contracts. However, the ISO 14044 standard provides the following guidance:
"When determining the elementary flows associated with production, the actual production mix should be used whenever possible, in order to reflect the various types of resources that are consumed. As an example, for the production and delivery of electricity, account shall be taken of the electricity mix, the efficiencies of fuel combustion, conversion, transmission and distribution losses."
It does not explicitly define whether RECs can or cannot be used in the determination of the "actual production mix." In the event an organization does procure a renewable energy contract to reduce the emissions reported within the LCA, it should disclose that clearly in order to communicate the impact of the contract on the carbon intensity of the LCA with and without the use of RECs.
Powerful Tools for Different Use Cases
The GHG Protocol Corporate Standard and LCAs following the ISO Standard are both powerful tools that can provide insight into emissions associated with electricity use. The GHG Protocol Corporate Standard allows companies to use a standardized framework to report emissions associated with electricity use and interventions on an annual basis. The LCA ISO standard is a detail-driven analysis that allows a deep dive into specific processes, projects, or products. This detailed analysis allows for deeper insights into areas where a company may have more ability to address specific interventions for emission hot spots. Using these tools together, while understanding the boundaries of each, can provide companies with a more effective and impactful approach to decarbonization.
Frequently Asked Questions
What are the differences between the GHG Protocol Corporate Standard and LCA?
The GHG Protocol is an annual corporate reporting framework covering scope 2 (generation) and scope 3: category 3 (transmission and distribution losses, fuel), while a cradle-to-grave LCA is a detailed analysis governed by ISO 14040/14044 standards that also includes manufacturing, construction, use-phase, and end-of-life emissions. LCA can also be applied to any product or process and multiple environmental impacts, not just greenhouse gas emissions.
Why do they result in different emissions for the same type and amount of electricity?
They include different life cycle stages. The GHG Protocol excludes manufacturing, construction, and end-of-life emissions of generation equipment, while an LCA includes them.
Can renewable energy contracts reduce reported electricity-related emissions under both methods?
Under the GHG Protocol, renewable energy contracts (e.g., RECs, PPAs) are explicitly allowed to report zero market-based scope 2 emissions, though scope 3 FERA emissions remain. Under ISO LCA standards, these contracts aren't explicitly addressed. Organizations may choose to apply them, but should transparently disclose LCA results both with and without the contract's impact.
When should you use the GHG Protocol vs an LCA?
Use the GHG Protocol for standardized, annual corporate-wide emissions reporting and tracking procurement interventions; use an LCA for a detailed, process- or product-specific deep dive to identify specific emissions hotspots. Relae recommends using both together for a more complete, strategic view of electricity-related emissions.
Scope 2 Emissions Explained: Tracking, Reporting, and Reducing Impact
Key Takeaways
- Scope 2 emissions (indirect emissions from energy use) are increasingly critical to address. With surging electricity demand, especially from data centers, scope 2 is a growing share of corporate emissions and a priority for decarbonization.
- Approaches to scope 2 accounting are evolving—and formal changes are now on the table. Both location-based and market-based methods remain accepted under the Greenhouse Gas Protocol. Still, the Protocol's recently closed public consultation proposes more granular approaches, including 24/7 power and carbon matching, that would better reflect the realities of modern power markets.
- Proven decarbonization levers, such as reducing energy use, entering power purchase agreements, procuring green tariffs, and buying high-quality renewable energy certificates, are already available and impactful. Decarbonization, not just measurement, must be the goal. Companies don’t need to wait to decarbonize.
Accounting for Indirect Emissions From Energy Use
As businesses and organizations strive to reduce their environmental impact, carbon accounting has become an essential tool for tracking and managing greenhouse gas (GHG) emissions. Carbon accounting helps organizations measure, report, and mitigate their emissions across various activities. A key framework for categorizing these emissions is the Greenhouse Gas Protocol (GHG Protocol), which classifies emissions into three scopes:
Each scope presents unique challenges and opportunities for reduction. Among them, scope 2 emissions are particularly significant because they stem from purchased energy, which is often generated using fossil fuels. However, numerous reduction mechanisms exist today to help organizations eliminate these emissions, such as improving energy efficiency in order to use less energy, and transitioning to renewable energy sources through market-based mechanisms. Understanding scope 2 emissions is crucial for businesses looking to contribute meaningfully to the global energy transition and achieve sustainability goals.
What Are Scope 2 Emissions?
Scope 2 emissions refer to indirect GHG emissions associated with the consumption of purchased energy. Unlike scope 1 emissions, which result from direct fuel combustion, scope 2 emissions arise from the generation of electricity, steam, heat, or cooling that a company procures from external sources.
The primary sources of scope 2 emissions include:
Purchased electricity: When businesses buy electricity from a utility provider, the emissions from power plants that generate this electricity are classified under scope 2.
Purchased heat, steam, and cooling: Some companies purchase heat, steam, or cooling services instead of generating them on-site. These services often come from centralized facilities that may rely on fossil fuels, thereby contributing to scope 2 emissions.
What sets scope 2 emissions apart from other scopes is the presence of market-based mechanisms that offer multiple pathways for organizations to reduce their carbon footprint. Unlike scope 1, where emissions reductions often require technological shifts or operational changes, scope 2 reductions can be achieved through strategic procurement decisions. The transition to renewable energy sources is an essential component of sustainability strategies, setting the stage for a broader energy transition across industries and economies.
How Are Scope 2 Emissions Measured Today?
The GHG Protocol currently outlines two primary approaches for calculating scope 2 emissions: the location-based method and the market-based method.
Location-Based Method
The location-based method calculates emissions for electricity consumption based on the average emissions intensity of the grid where the energy consumption occurs. This approach is mandatory under various reporting frameworks and does not take into account a company’s procurement choices.
- Relies on grid averages: Emissions are calculated based on regional grid emissions factors rather than specific energy purchases.
- Time-delayed data: Since grid emissions factors are typically updated annually, this method may not reflect real-time energy sourcing changes.
- Limited control: Companies using this method have less direct influence over their reported emissions, as they depend on the overall energy mix of their region.
Market-Based Method
The market-based method, on the other hand, reflects an organization’s actual procurement decisions and energy-sourcing strategies. It accounts for specific contracts, such as power purchase agreements (PPAs), renewable energy credits (RECs), and green tariffs, which allow businesses to claim lower emissions from their purchased electricity.
- Reflects company choices: Emissions calculations take into account contractual agreements for renewable energy purchases.
- Mechanism for electricity transition: Encourages organizations to invest in low-carbon electricity options and actively support the transition to renewables.
- Multiple reduction options: Companies can reduce their scope 2 emissions through a portfolio of mechanisms like PPAs, RECs, and green tariffs, making this method a flexible and strategic tool for decarbonization.
While market-based mechanisms provide flexibility in reducing scope 2 emissions, they also highlight the need for more precise and updated carbon accounting methodologies. For example, some decarbonization strategies, such as time-shifting energy consumption to better match renewable generation, are not accounted for under these methods. This and other limitations mean that the traditional methods outlined in the GHG Protocol are increasingly seen as outdated in an era of rapid changes in energy generation and grid dynamics. As a result, the market is shifting toward more advanced power emission accounting methodologies that provide a more accurate reflection of emissions associated with electricity use.
Proposed Changes to the GHG Protocol Scope 2 Guidance
The current GHG Protocol Scope 2 Guidance provides a market-based instrument methodology, originally designed in the early 2000s, that allows US-based companies to procure renewable energy at any point within a year from anywhere in North America and apply it to any of its annual electricity consumption within that same year. This methodology, as written, allows for a potentially significant mismatch of “emissions caused” (by consuming electricity) versus “emissions avoided” (by generating renewable electricity) in that it does not account for any of the realities of electric grids and generators, which vary significantly over different regions, seasons, and time of day.
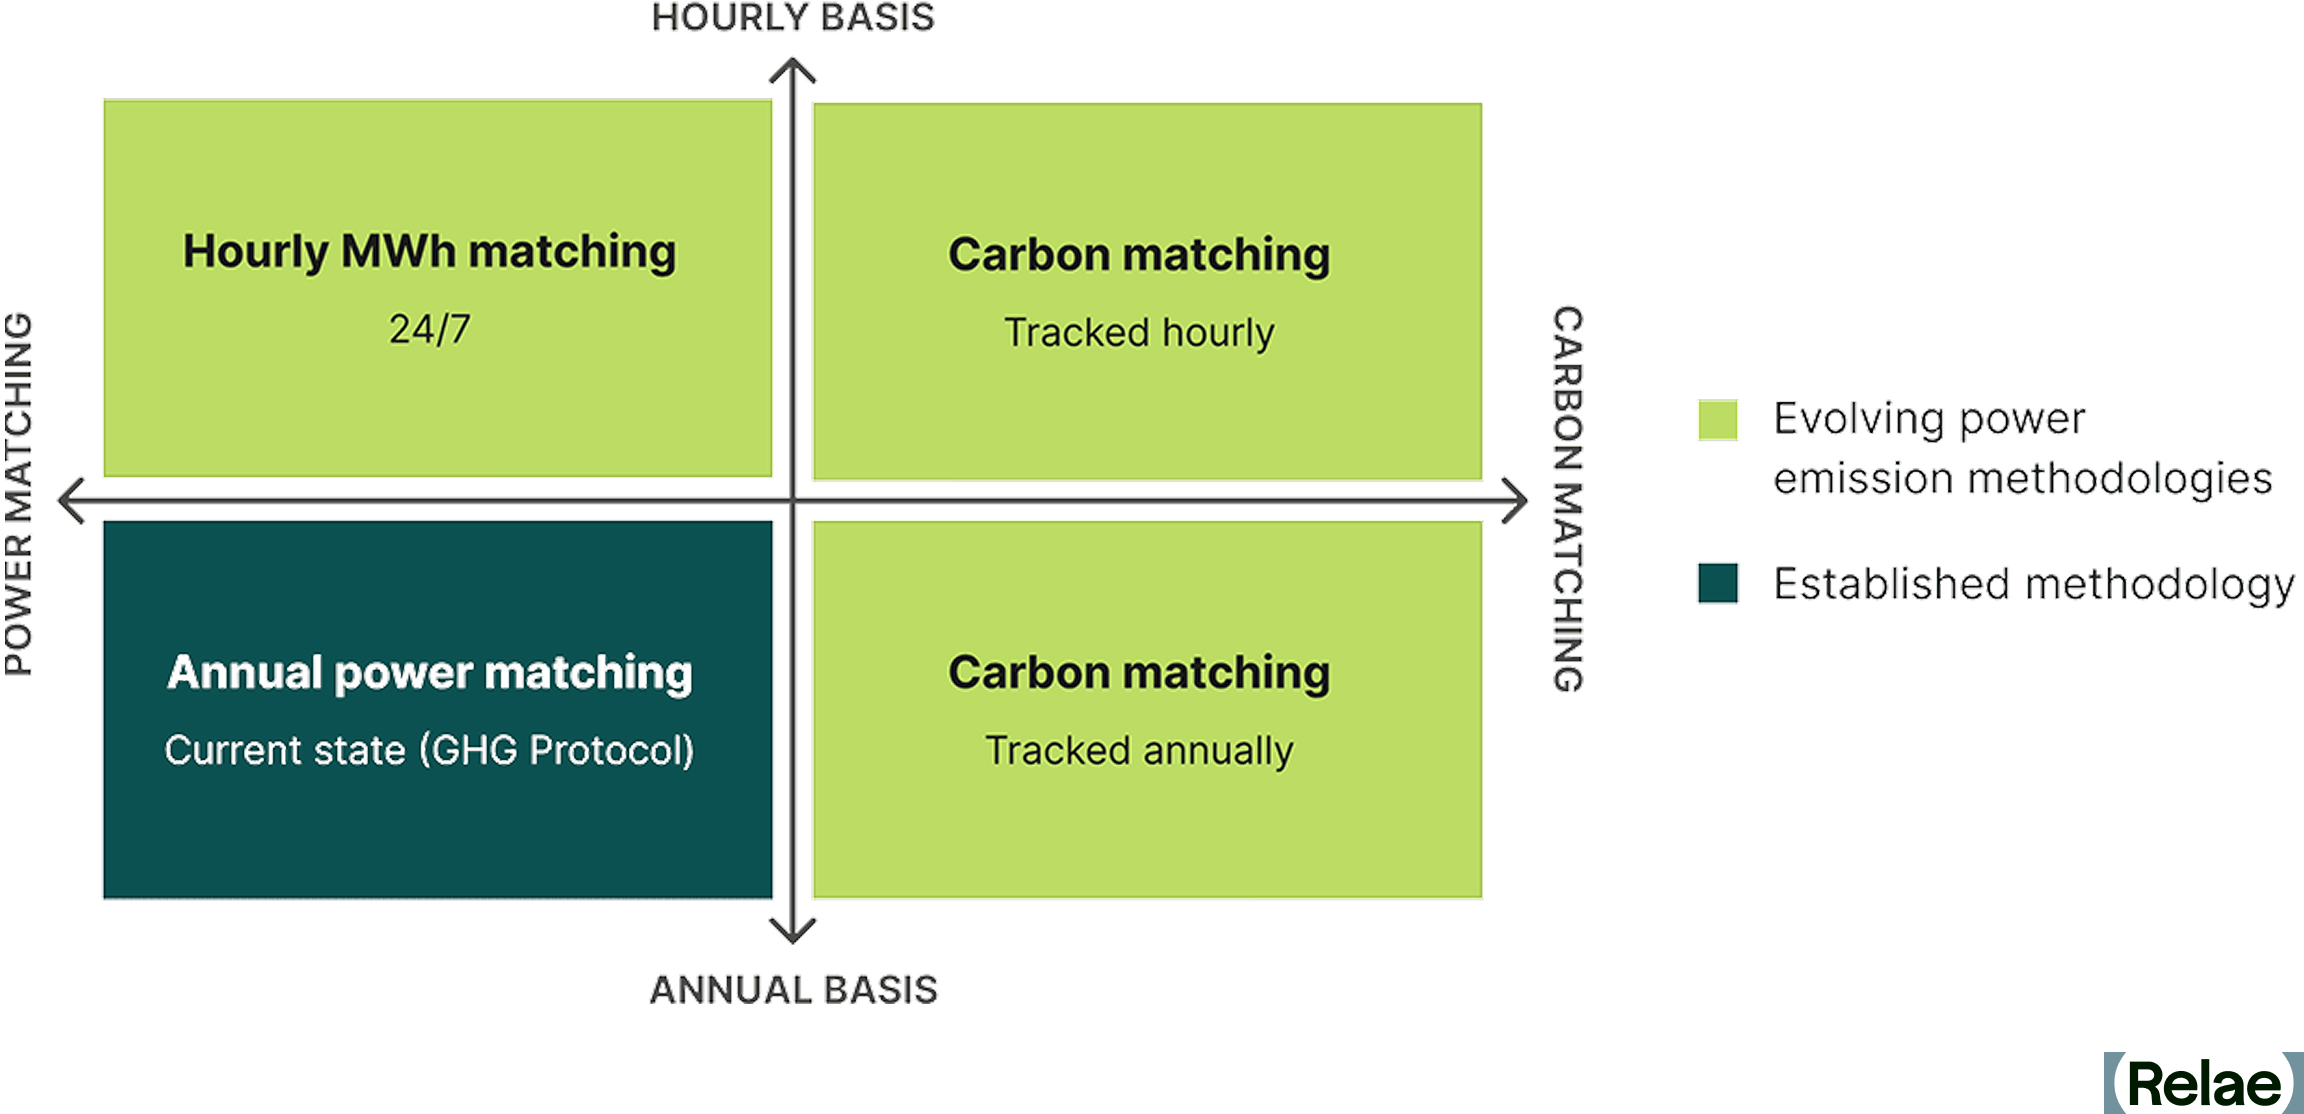
In response to this, the GHG Protocol Scope 2 Guidance is currently undergoing a revision process, which will include how emissions associated with electricity consumption are calculated. A focus of the revision process is on how to better account for the real emissions associated with a corporate’s electricity consumption, and more impactful ways of mitigating them through market-based instruments and other approaches. Advanced power emission accounting methodologies, such as 24/7 power matching and carbon matching, are being explored as ways to better represent the GHG emissions associated with electricity consumption.
- 24/7 power matching emphasizes matching electricity consumption with an equivalent amount of renewable energy production on an hourly basis.
- Carbon matching emphasizes measuring the emissions impact of incremental electricity consumption or production at a specific time.
These emerging methodologies propose a shift toward more granular temporal and region-specific matching, which could require companies to rethink their emissions reporting approach and explore more advanced tracking tools. They may also introduce new strategies beyond market-based instruments for reducing scope 2 emissions, such as time-shifting energy consumption.
As power grids continue to decarbonize and new digital tools emerge, businesses will need to adapt to these evolving methodologies to remain compliant, enhance sustainability strategies, and achieve meaningful reductions in emissions. Companies that proactively integrate advanced power emission tracking into their carbon accounting strategies will be better positioned to lead in the transition to a low-carbon economy.
How to Reduce Scope 2 Emissions
The GHG Protocol provides multiple mechanisms for reducing scope 2 emissions, allowing organizations to shift their energy consumption toward lower-carbon alternatives. These include:
- Reducing energy consumption: Improving energy efficiency in operations can significantly lower electricity use. In some cases, this involves capital investments in more energy-efficient equipment, but in other cases, it can be based on operational changes such as reducing unnecessary lighting, HVAC, and other services during non-working hours. (Electrification efforts, such as shifting from fossil fuel-powered systems to electric alternatives, may actually increase scope 2 emissions, but this can ultimately reduce overall emissions by correspondingly decreasing scope 1 emissions and allowing for renewable energy procurement.)
- RECs: Companies can purchase unbundled RECs (emissions “attributes” separated from the actual electricity product) to offset emissions associated with purchased electricity. While there has been criticism of RECs due to their significant range in quality, high-quality RECs are available, which may include ensuring regional matching, financial additionality, on-line date additionality, or tighter temporal generation to consumption matching. The use of high-quality unbundled RECs is the most accessible and realistic option for most smaller-scale companies to address scope 2 emissions.
- On-site generation and co-location: Installing on-site renewable energy generation, such as solar panels, allows companies to directly offset their electricity consumption from the grid. In some commercial settings, such as companies using leased real estate or co-located data centers, partnering with facilities that prioritize renewable energy procurement can help reduce scope 2 emissions for the facility owner while the facility occupant reduces scope 3 emissions.
- PPAs: Entering into long-term contracts with renewable energy providers ensures companies receive electricity from clean energy sources while supporting the expansion of renewable generation capacity. PPAs are available with standardized contract terms, and some service providers will aggregate demand from multiple smaller companies to reach the minimum required amount for typical PPA contracts. Hedging products are also available to reduce market risks.
- Green tariffs: Many utilities offer green tariffs that enable businesses to purchase renewable energy directly through their electricity provider, often at a premium but with lower emissions impact. For many smaller companies, this is a more viable approach than a PPA with a single renewable generator.
By adopting a combination of these strategies, businesses can significantly lower their scope 2 emissions while aligning with broader sustainability goals and regulatory requirements. The path to decarbonization requires proactive investment in cleaner energy sources, efficient consumption practices, and leveraging market-based instruments to drive the transition toward a low-carbon future.
Why Does Reducing Scope 2 Emissions Matter?
Reducing scope 2 emissions is the underpinning of decarbonizing the power sector and enabling the global energy transition. In 2025, S&P reported that corporate buyers added 15.2 GW of renewable capacity in the US, up from 9.1 GW in 2024, illustrating the growing impact of the corporate sector on the electricity grid. Cleaner grids translate to lower emissions for all energy users. Organizations that actively reduce their scope 2 emissions can contribute to decreasing demand for fossil fuel-based electricity and accelerate the deployment of renewable energy infrastructure.
For companies that own and operate data centers, this transition is especially important. AI data centers consume large amounts of electricity, and their reliance on purchased power makes them a significant source of scope 2 emissions. Since many businesses rely on third-party data center services, reducing emissions from these facilities also helps lower scope 3 emissions across industries. Corporates can influence data centers by requiring that they have a clear and explicit low-emission power strategy in place before procurement.
Beyond direct corporate benefits, reducing scope 2 emissions has a tangible long-term impact on power grids. Increased investment in renewable energy procurement sends a strong market signal, encouraging utilities and developers to expand clean energy projects. As more companies commit to sourcing renewable energy, the overall mix of grid power shifts, making low-carbon electricity more accessible and reducing reliance on fossil fuel-based generation. Ultimately, widespread corporate action in scope 2 emissions reduction supports the broader decarbonization of power markets and strengthens global climate commitments.
Frequently Asked Questions
Will RECs (renewable energy certificates) still count toward scope 2 reductions under the GHG Protocol's proposed changes?
Under the current Scope 2 Guidance, yes—RECs remain a valid market-based instrument. The proposals from the GHG Protocol's recent consultation range from retaining market-based accounting with stricter quality criteria to restructuring how instrument-based claims are reported altogether, and nothing is final until the revised standard is published. What's clear is that scrutiny is rising, particularly for unbundled RECs with weak temporal or geographic connection to a company's actual consumption, so prioritizing high-quality RECs now is the best way to future-proof a procurement strategy.
How would the proposed hourly and regional matching requirements affect companies that rely on unbundled RECs today?
Hourly (24/7) and regional matching would require renewable generation claims to line up much more closely with when and where a company actually consumes electricity. Companies relying on annually matched, unbundled RECs sourced from distant grids would likely see their reported market-based emissions rise under such requirements. The practical preparation is to start collecting more granular (ideally hourly) consumption data and shift toward RECs and contracts with tighter regional and temporal matching.
What's the practical difference between location-based and market-based scope 2 accounting, and will that distinction survive the GHG Protocol's revision?
The location-based method calculates emissions using the average emissions intensity of the local grid, regardless of procurement choices, while the market-based method reflects a company's actual contracts, such as PPAs, RECs, and green tariffs. The consultation explored options from strengthening the criteria for market-based claims to reporting emissions and market instruments in separate, complementary statements. Both concepts will exist in some form, but companies should expect the requirements behind market-based claims to tighten.
When is the new Scope 2 Guidance expected to take effect, and what should companies do now to prepare?
Per the GHG Protocol's July 2026 development plan, a draft of the revised consolidated Corporate Standard is expected for public consultation in 2027, with a final published standard currently estimated for late 2028, and adoption timelines will follow publication. Companies should take action now. Energy efficiency, PPAs, green tariffs, and high-quality RECs reduce real emissions under any accounting regime. Building hourly consumption tracking and auditing the quality of existing REC portfolios now will make any future transition smoother.
Scope 3.1 Emissions: How to Measure and Reduce Value Chain Impact
Key Takeaways
- Scope 3.1 emissions, purchased goods and services, can account for up to 67% of a company’s total carbon footprint, making them a critical category for measurement and action.
- Companies can reduce risk, meet stakeholder demands, and strengthen supply chain resilience by proactively managing scope 3.1 emissions.
- Relae empowers organizations to take meaningful action on scope 3.1 through science-based measurement, practical emissions management strategies, and deep supplier engagement.
What Are Scope 3 Emissions and Why Do They Matter?
Scope 3 emissions include all indirect greenhouse gas (GHG) emissions that occur across a company’s value chain. While scope 1 emissions are from directly owned or controlled activities, and scope 2 are indirect emissions from the generation of purchased electricity, heat, or steam, scope 3 emissions encompass upstream and downstream activities throughout the value chain.
Within scope 3, there are 15 categories, including activities such as raw material extraction, purchased services, shipping, business travel, product use, and end-of-life treatment. Critically, scope 3 emissions usually make up the majority of a company's total carbon footprint. Across sectors, CDP finds supply chain emissions average 26 times a company's operational emissions, and in supply-chain-heavy sectors like apparel, the share exceeds 95%.
Category 3.1 (purchased goods and services) is often the largest contributor. For many organizations, it can be as much as 67% of their total corporate footprint. Despite being outside a company’s direct operational control, scope 3 emissions are increasingly scrutinized by regulators, investors, and customers alike, making them essential to measure, manage, and reduce.
What Is Included in Scope 3.1 Emissions?
Scope 3.1 emissions capture all cradle-to-gate emissions associated with products and services procured by an organization. These include emissions from the extraction of raw materials, energy usage, manufacturing processes, waste, and transport and travel up to the point of delivery to the reporting company. As such, the types of activities within this category are quite extensive and disparate.
Examples of scope 3.1 items include:
- Raw materials (e.g., limestone, copper ore, lumber)
- Intermediate products (e.g., steel, electronic components, platform chemicals)
- Packaging materials
- Office supplies and equipment
- Professional services
- Cloud computing and software services
The size of scope 3.1 emissions varies widely by industry. For example, a consumer goods manufacturer sourcing large volumes of physical products may see a larger share of emissions in this category than the supplier providing the raw materials. For data centers that run on very low-carbon electricity, equipment and construction can account for 40% of lifetime emissions. For many organizations that are service-based or contract out manufacturing, scope 3.1 can be the most significant emissions category.
What Is the Strategic Value of Scope 3.1?
While scope 3.1 emissions fall outside a company’s direct operational control, they are not beyond its influence. Addressing emissions from purchased goods and services may open up a range of strategic benefits:
- Innovation opportunities through lower-carbon materials and production processes.
- Enhanced supplier relationships and engagement on shared sustainability goals.
- Improved resilience and risk mitigation across supply chains.
By assessing and acting on scope 3.1 emissions, companies can drive meaningful reductions and catalyze change throughout the entire supply chain.
What Are the Methods for Calculating Scope 3.1 Emissions?
There are four methods to calculate scope 3.1 emissions based on the data collected. Each offers a different balance of speed, accuracy, and scalability.
1. The Spend-Based Method
This approach multiplies the amount of money spent on a good or service by an economic emissions factor (e.g., kg CO₂e per dollar spent). Most companies use this approach as a starting point but transition to more accurate methods as they advance in their sustainability journey.
Advantages
- Fast and scalable across categories
- Useful for initial hotspot identification
- Helps fill data gaps when activity data is unavailable
Limitations
- Lower accuracy, especially during periods of inflation or economic volatility
- Cannot reflect actual emissions reductions by suppliers
- Misalignment between price and emissions (e.g., high-cost items may not be high-emission)
2. The Average Data Method
This method uses average emissions factors for goods or services, based on industry datasets. For instance, industry life cycle assessments (LCAs) might be used to estimate the emissions associated with a kilogram of steel purchased.
Advantages
- More accurate than spend-based
- Suitable for companies refining emissions data to enable targeted reductions
Limitations
- Lack of raw data granularity
- Geographic variation limited
3. The Supplier-Specific Method
The supplier-specific method is the most accurate approach and involves collecting actual emissions data directly from suppliers. This includes LCAs, environmental product disclosures (EPDs), product carbon footprints (PCFs), supplier emissions reports, or Environmental, Social, and Governance (ESG) reports.
Advantages
- High accuracy and granularity
- Builds engagement with suppliers
- Enables tracking of supplier improvements over time
Limitations
- Challenging to scale across many suppliers
- Data may be confidential, inconsistent, or incomplete
- Requires continuous updating of supplier information
4. The Hybrid Approach
Adopting a hybrid approach allows many companies to maximize their data collection efforts by applying the supplier-specific method for high-impact purchases and using average or spend-based methods elsewhere. This tiered approach enables efficient use of resources while maintaining data quality for critical emission sources.
Where Can You Find Scope 3.1 Data?
Data for scope 3.1 emissions typically resides in procurement and finance functions. Purchase orders, invoices, and supplier contracts often contain critical information such as volume, product category, and spend. However, collecting, organizing, and analyzing this data can be resource-intensive, especially for companies with complex and global supply chains. Data type and availability play a key role in determining the method used for calculating emissions, impacting the accuracy and ability to reduce emissions.
What Are the Challenges in Measuring Scope 3.1 Emissions?
As most organizations will attest, measuring scope 3.1 has many challenges, from resource constraints to data availability. As organizations intensify their climate commitments, they are increasingly confronted with a range of technical, logistical, and strategic barriers that make accurate measurement and consistent reporting difficult. Understanding these roadblocks is critical to developing more resilient and impactful scope 3.1 measurement practices.
- Data availability and quality: Collecting high-quality data is often a bottleneck, with many organizations lacking the systems to track product-level or supplier-specific emissions. Without the proper tracking in place, emissions calculations rely on less accurate methods, making it difficult to reflect or meet reduction efforts.
- Supplier inconsistencies and allocation complexities: Even when suppliers share emissions data, the methodologies, boundaries, and underlying assumptions across them will vary widely. This adds an extra layer of difficulty to data aggregation. Additionally, the allocation of supplier emissions may vary based on the supplier’s chosen method, such as economic (based on spend and supplier revenue/emissions) or service-level (based on units purchased and supplier output/emissions). These inconsistencies can significantly affect reported totals, making it challenging to compare suppliers.
- Complex, multi-tiered supply chains: Upstream emissions can span multiple suppliers across different geographies and industries. Visibility often becomes cloudier beyond Tier 1 suppliers, making it difficult to account for emissions generated deeper in the value chain.
- Timing and synchronization: Aligning procurement, emissions calculation, and reporting cycles can be challenging. Delays in supplier disclosures or emissions factor updates can create reporting lags and misalignment.
Top Five Strategies to Reduce Scope 3.1 Emissions
Reducing scope 3.1 emissions requires balancing precise measurement with targeted action. This means identifying high-impact categories, collaborating with key suppliers, and harnessing available emissions data to improve accuracy and accountability. Here are five strategies organizations can use to start driving impact:
- Prioritize key categories and suppliers: Not all purchases contribute equally to emissions. Conduct a hotspot analysis to identify the highest-emitting goods or services and prioritize the top suppliers for engagement. Consider prioritizing the share of emissions, the share of procurement spend, and the current methodology type.
- Engage suppliers and set expectations: Encourage suppliers to measure and disclose their emissions, invest in LCAs or PCFs, and set their own science-based targets. Collaborative initiatives, such as supplier engagement programs, can support progress.
- Leverage readily available supplier reports: Many electronic companies, cloud providers, and industrial products provide detailed emissions data through EPDs, LCAs, and specific service emissions reports. For example, AWS and Google offer detailed emissions reports for data hosting and services. Leveraging these can help reduce uncertainty and improve accounting accuracy in software-heavy organizations. However, they should be utilized with caution, as some providers have faced scrutiny in 2026 for reporting efficiency gains without disclosing cloud-specific energy use or the growth in embodied hardware emissions behind it.
- Identify opportunities for low-carbon inputs: The same reports that help improve reporting accuracy can also provide more detail on the material inputs of purchased goods. This level of information can enable organizations to pursue opportunities for lower-carbon inputs to reduce emissions.
- Invest in centralized data systems: A centralized platform for carbon accounting data management can streamline emissions tracking, improve visibility, and enable scenario modeling. Several of the other strategies cannot be as effective without the right tools in place to manage this key information.
Turning Complexity Into Opportunity
Tackling scope 3.1 emissions may feel daunting, but it’s also where some of the biggest climate opportunities lie. By investing in better data, fostering supplier collaboration, and integrating sustainability into procurement practices, companies can unlock innovation, resilience, and long-term value. Organizations that lead on scope 3.1 will not only meet emerging disclosure standards but will shape the low-carbon supply chains of the future.
Frequently Asked Questions
What are scope 3 emissions, and why do they matter?
Scope 3 emissions are all the indirect greenhouse gas emissions in a company's value chain, everything from raw material extraction and purchased services to product use and disposal. They matter because they're usually the majority of a company's footprint. They also fall outside a company’s direct control, which makes them the hardest to measure and the most scrutinized by regulators and investors.
What is included in scope 3.1 emissions?
Scope 3.1 covers the cradle-to-gate emissions of everything a company buys, i.e. all emissions generated up to the point of delivery. That includes raw materials, intermediate goods like steel and electronic components, packaging, office equipment, professional services, and cloud computing. It captures the supplier's extraction, energy use, manufacturing, waste, and transport. It does not include emissions from using or disposing of your own products, which sit in other scope 3 categories.
What are the methods for calculating scope 3.1 emissions?
There are four. The spend-based method multiplies spend by an emissions factor per dollar, which is fast, scalable, and the usual starting point. The average-data method applies industry emissions factors to physical quantities, like kilograms of steel. The supplier-specific method uses actual supplier data such as LCAs, EPDs, or product carbon footprints, and is the most accurate. Most companies land on a hybrid, the final method, which takes supplier-specific data for high-impact purchases and uses estimates elsewhere.
How can companies reduce scope 3.1 emissions?
Start with a hotspot analysis to identify where emissions are coming from. This will usually show that a small share of suppliers and categories drives most of the footprint. From there, engage those suppliers on measurement and targets, use supplier reports and EPDs to replace estimates with real data, and use that detail to identify lower-carbon inputs. Centralized carbon accounting data makes each of these repeatable rather than a one-off exercise.
Do AI data centers' hardware purchases count as scope 3.1 emissions?
Yes, for a data center operator, servers and chips are purchased goods, and therefore count in scope 3.1.
Understanding the Carbon Footprint of AI and How to Reduce It
Key Takeaways
- AI's carbon footprint has two distinct parts: embodied emissions from building data centers and operational emissions from running them, both accelerating as global data center electricity use is set to double by 2030, and AI-focused use to triple.
- Managing that footprint will require deliberately steering technology architecture, power sourcing, and materials choices, instead of leaving them to react to demand after the fact.
- Eight concrete strategies, from smarter chip design to firm clean power and carbon removal, can cut AI's footprint today, without waiting on new regulation.
- US data centers used 4% of the USA's total electricity in 2024, and are projected to use as much as 15% by 2030.
Introduction
The rapid growth of artificial intelligence (AI), particularly large-language models (LLM) and generative AI, has taken many by surprise. This surge has led to escalating electricity demands at data centers and raised concerns about the strain on the power grid. It has also sparked the construction of new, larger data centers, resulting in growing embodied emissions tied to building and maintaining AI physical infrastructure.
Managing the risks of increased greenhouse gas (GHG) emissions from AI requires investment, expertise, and new approaches to building and operating many aspects of AI operation and supply chains. The immediate task is to understand these risks, gather the necessary information, and to avoid poor outcomes by proactively managing construction, operation, and emissions associated with the growth in AI. In parallel to that work, it's important to recognize that AI can itself be a real force to reduce emissions incrementally and dramatically across a wide range of sectors.
What Is the Carbon Footprint of AI?
The carbon footprint of AI consists of two main parts: "embodied" emissions that come from manufacturing IT equipment and constructing data centers, and "operational" emissions that come from electricity consumed by servers, memory and networking equipment as they perform AI-related calculations. Both of these aspects of emissions are growing as more data centers are built and existing data centers increase their share of power-hungry AI applications like generative LLM searches, AI agents, and AI image generation.
Understanding Electricity Demand for Data Centers
Today, the electricity demand from AI-specific applications is estimated to be less than 1% of global electricity use. To understand this number, it helps to start with the electricity consumed by the 12,000+ data centers worldwide, which was about 1.5% of global electricity consumption in 2024. (This excludes another 0.4% from cryptocurrency mining.) However, most of the computation at these data centers is not AI; instead, it's more conventional applications like e-commerce, video streaming, social media, and online gaming.
The amount of AI-based computation at data centers is hard to determine, but AI-dedicated accelerated servers consumed about one third of overall data center electricity in 2025, or roughly 0.5% of global electricity. Notably, this is projected to grow at 30% annually, much faster than conventional (non-AI) data center electricity use. However, that electricity use results in a relatively small share of greenhouse gas emissions: about 0.5% of global fuel combustion emissions, with AI data centers representing only a small portion of that value.
Still, the demand for AI applications is rapidly growing, and this is likely to drive up the electricity used by data centers and the associated greenhouse gas emissions. The most important implications of this trend are in the US, which hosts about half the world's data centers. Currently, data centers use about 4% of US electricity, but projections for the future range from a low of 9.5% to a high of 15.3% in 2030.
[cta]
How Electricity Sources Impact Data Center Emissions
A large increase in electricity use doesn't necessarily result in a similarly large increase in greenhouse gas emissions. Currently, a significant portion of the electricity powering data centers comes from zero-carbon sources such as wind and solar. This is partly because of large, corporate power-purchase agreements (PPAs) signed by leading data center operators, particularly Amazon, Meta and Google.
US technology companies have been buying renewable energy for years. Global corporate clean energy procurement hit a record 62 GW in 2024, then fell to 55.9 GW in 2025, the first annual decline in nearly a decade, as elevated power prices and policy uncertainty made even large buyers more selective. Meta, Amazon, Google, and Microsoft still accounted for roughly 49% of global clean energy procurement in 2025, with Meta and Amazon alone securing 20.4 GW combined, including 4.7 GW of nuclear power.
The use of low-carbon power means that the net emissions from these data centers is smaller than the electricity consumption numbers might suggest. Of course, a crucial consideration is whether this low-carbon power is truly "additional," meaning that it is being added to the grid and not simply taken away from other uses. Data center operators are also expanding beyond their traditional wind and solar PPAs by exploring novel approaches to try to meet this standard, including geothermal projects in the US and Taiwan.
However, the projected electricity demand from AI applications at data centers will be difficult to meet entirely with low-carbon power, at least in the near term. Despite installing over 43.2 GW of wind, solar and battery projects in the US in 2025, these generators face a long wait for interconnection approval in many parts of the country. Geothermal and hydro power, which offer steady ("baseload") low-carbon electricity, remain constrained in the near term. And the interest in scaling up nuclear power, from restarting full-scale reactors to novel small modular reactors (SMRs), faces significant regulatory, cost, and supply chain hurdles.
One important source of low-carbon electricity that has not received enough attention is natural gas-fired power equipped with carbon capture and storage (CCS). This technology has the potential to significantly reduce emissions from existing power plants and enable new projects to achieve near-zero emissions.
The Role of Embodied Emissions in Data Center Construction
Embodied emissions include all emissions associated with the extraction, production, transportation, construction, and disposal of materials used in construction.
The embodied emissions from constructing data centers are substantial, and include concrete, steel, and IT hardware. Scope 3 GHG emissions for data centers—which include embodied emissions—range from approximately one-third to two-thirds of overall lifetime emissions. At Microsoft, Scope 3 emissions made up about 86% of the company's total FY2025 footprint and grew roughly 12% year over year, with capital goods driving most of that increase. In FY2024, capital goods alone accounted for about 41% of Microsoft's Scope 3 emissions, and purchased goods and services (including IT hardware) accounted for another 34%. In response, Microsoft has started using wood in some data center construction to reduce this impact. While using wood offers a partial solution, it cannot fully offset the emissions of even a single facility, and wood supply chains remain limited.
Major data center operators are working hard to address this challenge, including emphasizing the need for standardized emissions measurements and disclosures for key building materials. Ultimately, achieving deeper decarbonization will require further action to address both operational and embodied emissions.
Eight Strategies to Reduce the Carbon Footprint of AI
1. Adapt Technology Architecture
Efficiency is the foundational strategy in any clean energy approach. As such, chipmakers are developing ways to cut energy use from the outset, such as incorporating more memory directly onto computer chips or hard-wiring basic calculations. These innovations have already reduced energy consumption in new computer chips substantially, in some cases a 96% improvement. Examples of this include NVIDIA's Blackwell platform and the company's newer Rubin platform, launched in 2026, continues that trajectory. Likewise, servers are being designed with new architectures that minimize internal data transfers, delivering additional efficiencies. Even more efficiency gains may be possible with emerging technologies like photonic computing.
2. Optimize Training Geography
There are also significant opportunities to manage AI's energy use through time and space optimization. For example, a large portion of the energy consumption for LLMs occurs during the training phase, prior to a model's deployment for inference. Because these training tasks are not location-dependent, they can be carried out in regions with abundant, low-cost, low-carbon electricity, as part of broader efforts to dynamically move computing tasks to reduce emissions, known as carbon-aware computing. Additionally, server requests for generative AI tasks, like ChatGPT searches, can potentially be routed through systems powered by low-carbon electricity. Although this may add only a few milliseconds of latency, it could substantially reduce emissions from computing operations.
3. Select Appropriately-Sized Models
Not all generative AI tasks, like ChatGPT queries, are equal in terms of energy demand. Leading AI companies are increasingly focusing on using smaller, more efficient AI models to perform these tasks, achieving nearly equivalent quality for far less energy consumption. A notable recent test of that idea came in January 2025, when China's DeepSeek released a model with competitive performance that was trained using less powerful chips and far fewer computing hours than its established rivals. Similarly, many AI applications, such as digital twinning and satellite-based pattern recognition, consume far less electricity than generative LLMs, because of their specialized, relatively efficient models. This can even save energy compared to non-AI approaches: for example, some of the most advanced AI-driven weather prediction models require far less energy than traditional weather simulations, running on a laptop rather than a supercomputer.
4. Address Fugitive Methane Emissions
As data center operators increasingly plan on using natural gas for new electricity supply, reducing upstream emissions from gas production and transmission will be crucial. In the U.S., the Environmental Protection Agency (EPA) 2024 Methane Rule was designed to cut these non-carbon dioxide greenhouse gas emissions by approximately 80%. However, Congress repealed the rule's methane fee in 2025 and barred the EPA from collecting it until 2034. The EPA has since extended compliance deadlines and loosened flare and vent-gas requirements, with litigation over those changes still ongoing. Meanwhile, tools from companies like Kayrros and organizations like Carbon Mapper help detect methane leaks and attribute them to specific operators. The best actors in the industry emit minimal methane, less than 0.5% of what is produced. This standard is achievable for nearly all gas producers.
5. Use Carbon Capture on Power Plants
For both new and existing natural gas-fired power plants, carbon capture and storage technology offers the potential for generating firm, low-carbon power. While many plants currently in operation continue to emit unchecked, this doesn't have to be the case: their emissions can be captured and securely stored geologically. Hyperscalers and project developers should pursue new investments and business models for CCS to reduce existing emissions by 95% or more. For new generation projects, options like NetPower, Arbor, and CES will soon enable emissions abatement of 100%, or even more if combined with biopower to deliver carbon dioxide removal as well. Achieving this will require the development of carbon dioxide pipelines, barges, and storage facilities, which face their own challenges, such as permitting and community approval, that must be addressed directly.
6. Add More Zero-Carbon Power to the Grid
Roughly 8,200 solar, wind, and battery projects in the U.S. are seeking grid interconnection. By the end of 2025, the interconnection queue held roughly 2,060 GW of proposed generation and storage across thousands of projects, and its composition shifted meaningfully. Solar, wind, and storage volumes in the queue all declined year over year (although remained at high absolute levels) while natural gas capacity in the queue grew by 86%. Our blog post, The $5.5 Billion-Dollar Case for Enabling Data Center Load Flexibility, covers one way hyperscalers are working around the wait rather than simply enduring it. These delays need to be addressed, and permitting reform remains an unresolved, live debate. The Manchin-Barrasso bill, which once looked likely to pass, was tabled in December 2024 and never became law. As of 2026, no comprehensive federal permitting law has replaced it. One potential innovation is to use AI to accelerate the development of power flow models and streamline the paperwork required to complete the regulatory process.
7. Invest in Low-Carbon Building Materials
While wood is a promising low-carbon building material, we'll also need glass, concrete, steel, aluminum, and computer chips with minimal embodied carbon emissions. Hyperscalers currently face significant challenges accessing low-carbon versions of these materials, which will eventually be produced using low-carbon hydrogen, carbon capture and storage, and low-carbon electricity. However, these systems require significant investment, workforce development, and permitting to be built. Without these advancements, the embodied emissions from data centers will increase rapidly and significantly in the US, Europe, and globally.
8. Increase Carbon Dioxide Removals
It's already clear that AI applications at data centers will generate emissions from electricity use and embodied carbon that cannot be avoided in the near term. Estimates of current greenhouse gas emissions exceed 300 million tons per year and are likely to grow this decade. These emissions should be measured using full life-cycle analysis and then offset through high-quality carbon removal projects, preferably those with high durability.
To effectively reduce the environmental impact of AI, all eight strategies discussed must prioritize the communities most affected: frontline communities near new infrastructure, consumers facing price increases, and tribal authorities with limited legal protections. Our own research on community opposition to AI data centers found that transparency, not cost or environmental impact alone, is the dominant driver of pushback across 46 stalled or blocked projects. We explore this concern further in our blog, Who Pays for the AI? The Hidden Costs of Rising Data Center Demand, including how ratepayers, not just data center operators, often absorb the cost of new grid infrastructure. Planning should begin by understanding the needs of these communities, ensuring that efforts focus on minimizing harm while maximizing benefits. Equity and justice must be embedded in every stage of planning, production, and permitting across all strategies.
AI's Power Demand Is Indicative of Broader Electricity Demand
AI is just one part of a broader trend of rapidly growing electricity demands, including from electric vehicles, heat pumps, industrial electrification, green hydrogen, and various e-fuels. The challenges AI presents to hyperscalers, communities, regulators, and investors serve as a preview of the complex, far-reaching impacts emerging in other sectors. The same questions keep recurring. Who secures reliable, affordable power fast enough? Who ends up carrying the cost and emissions burden of getting there the wrong way?
Managing AI's power demand will require building the technology architecture, clean firm power supply, and materials strategy to meet that demand deliberately, rather than reactively. AI's carbon footprint underscores the critical need for expertise in clean electricity, grid management, decarbonization, and carbon removal—expertise that will become increasingly vital as more companies realize the complexity and cost of the journey ahead.
Fortunately, AI itself can be part of the solution. With applications in grid management, material science, and advanced manufacturing, AI has the potential to play a powerful role in the climate response.
Read the full 2025 report: ICEF Sustainable Data Centers.
Frequently Asked Questions
How much electricity do AI data centers actually use?
AI-specific computation likely accounts for around 0.04% of global electricity use today, but data centers overall (most of it non-AI computation) used about 1.5% of global electricity in 2024. In the US, which hosts roughly half the world's data centers, Lawrence Berkeley National Laboratory puts current usage at 4% of US electricity, projected to reach 9.5-15.3% by 2030 as AI-specific demand grows.
Will more efficient AI models like DeepSeek reduce data center energy demand?
Not necessarily. DeepSeek's 2025 debut showed that competitive models can be trained with less powerful chips and fewer computing hours, but whether that translates into lower total energy demand is contested. Historically, efficiency gains in computing have tended to get absorbed by increased usage rather than reducing total consumption, so the honest answer is that it depends on whether demand growth outpaces the efficiency gained.
What is being done about the embodied emissions from building AI data centers?
Embodied emissions, from concrete, steel, and IT hardware, can account for one-third to two-thirds of a data center's lifetime emissions. Strategies include using lower-carbon materials like wood where feasible, developing low-carbon concrete, steel, and chips, and standardizing emissions disclosures for building materials so operators can compare and choose lower-footprint options.