Reconciliation Bill Dramatically Shifts the Clean Energy Landscape
Key Takeaways
- Accelerated phase-out schedules for key clean energy and decarbonization tax credits will shorten the runway for project development, which could stall or cancel projects.
- Urgency is paramount, and qualified projects should expedite construction and operational timelines to secure eligibility for existing credits.
- A more complicated policy landscape requires concerted effort to navigate, including with the support of policy professionals.
Reconciliation Rolls Back Much of the IRA
On Friday, July 4, 2025, the President signed a sweeping reconciliation bill, H.R. 1, that will add at least $3.3 trillion to the national debt and marks a pivotal, contentious moment for US clean energy policy. The law was enacted through the complex legislative process known as budget reconciliation, requiring only a simple majority of votes in the House and Senate. The new law substantially modifies or terminates many of the Inflation Reduction Act of 2022 (IRA)'s clean energy incentives and has extensive implications for the economic viability of American energy and manufacturing projects.
In the Senate, three Republicans crossed party lines to vote against the bill, requiring Vice President JD Vance to break the tie. In the House, only two Republicans broke ranks to vote against final passage. While some of the more complex provisions of the bill, such as new foreign entity of concern (FEOC) restrictions, will require more time to fully assess, we've prepared a rapid run-down of key alterations to IRA incentives for carbon management, hydrogen, and clean fuel technologies.
What Is the 2025 Reconciliation Bill?
While the 2025 reconciliation bill is staggering in length, scope, and severity, containing provisions to cut Medicaid, reduce nutrition assistance, raise the debt limit, and cut taxes primarily for the wealthy, some of the most drastic sections of the bill modify tax incentives and other public funding for clean energy and emissions reductions.
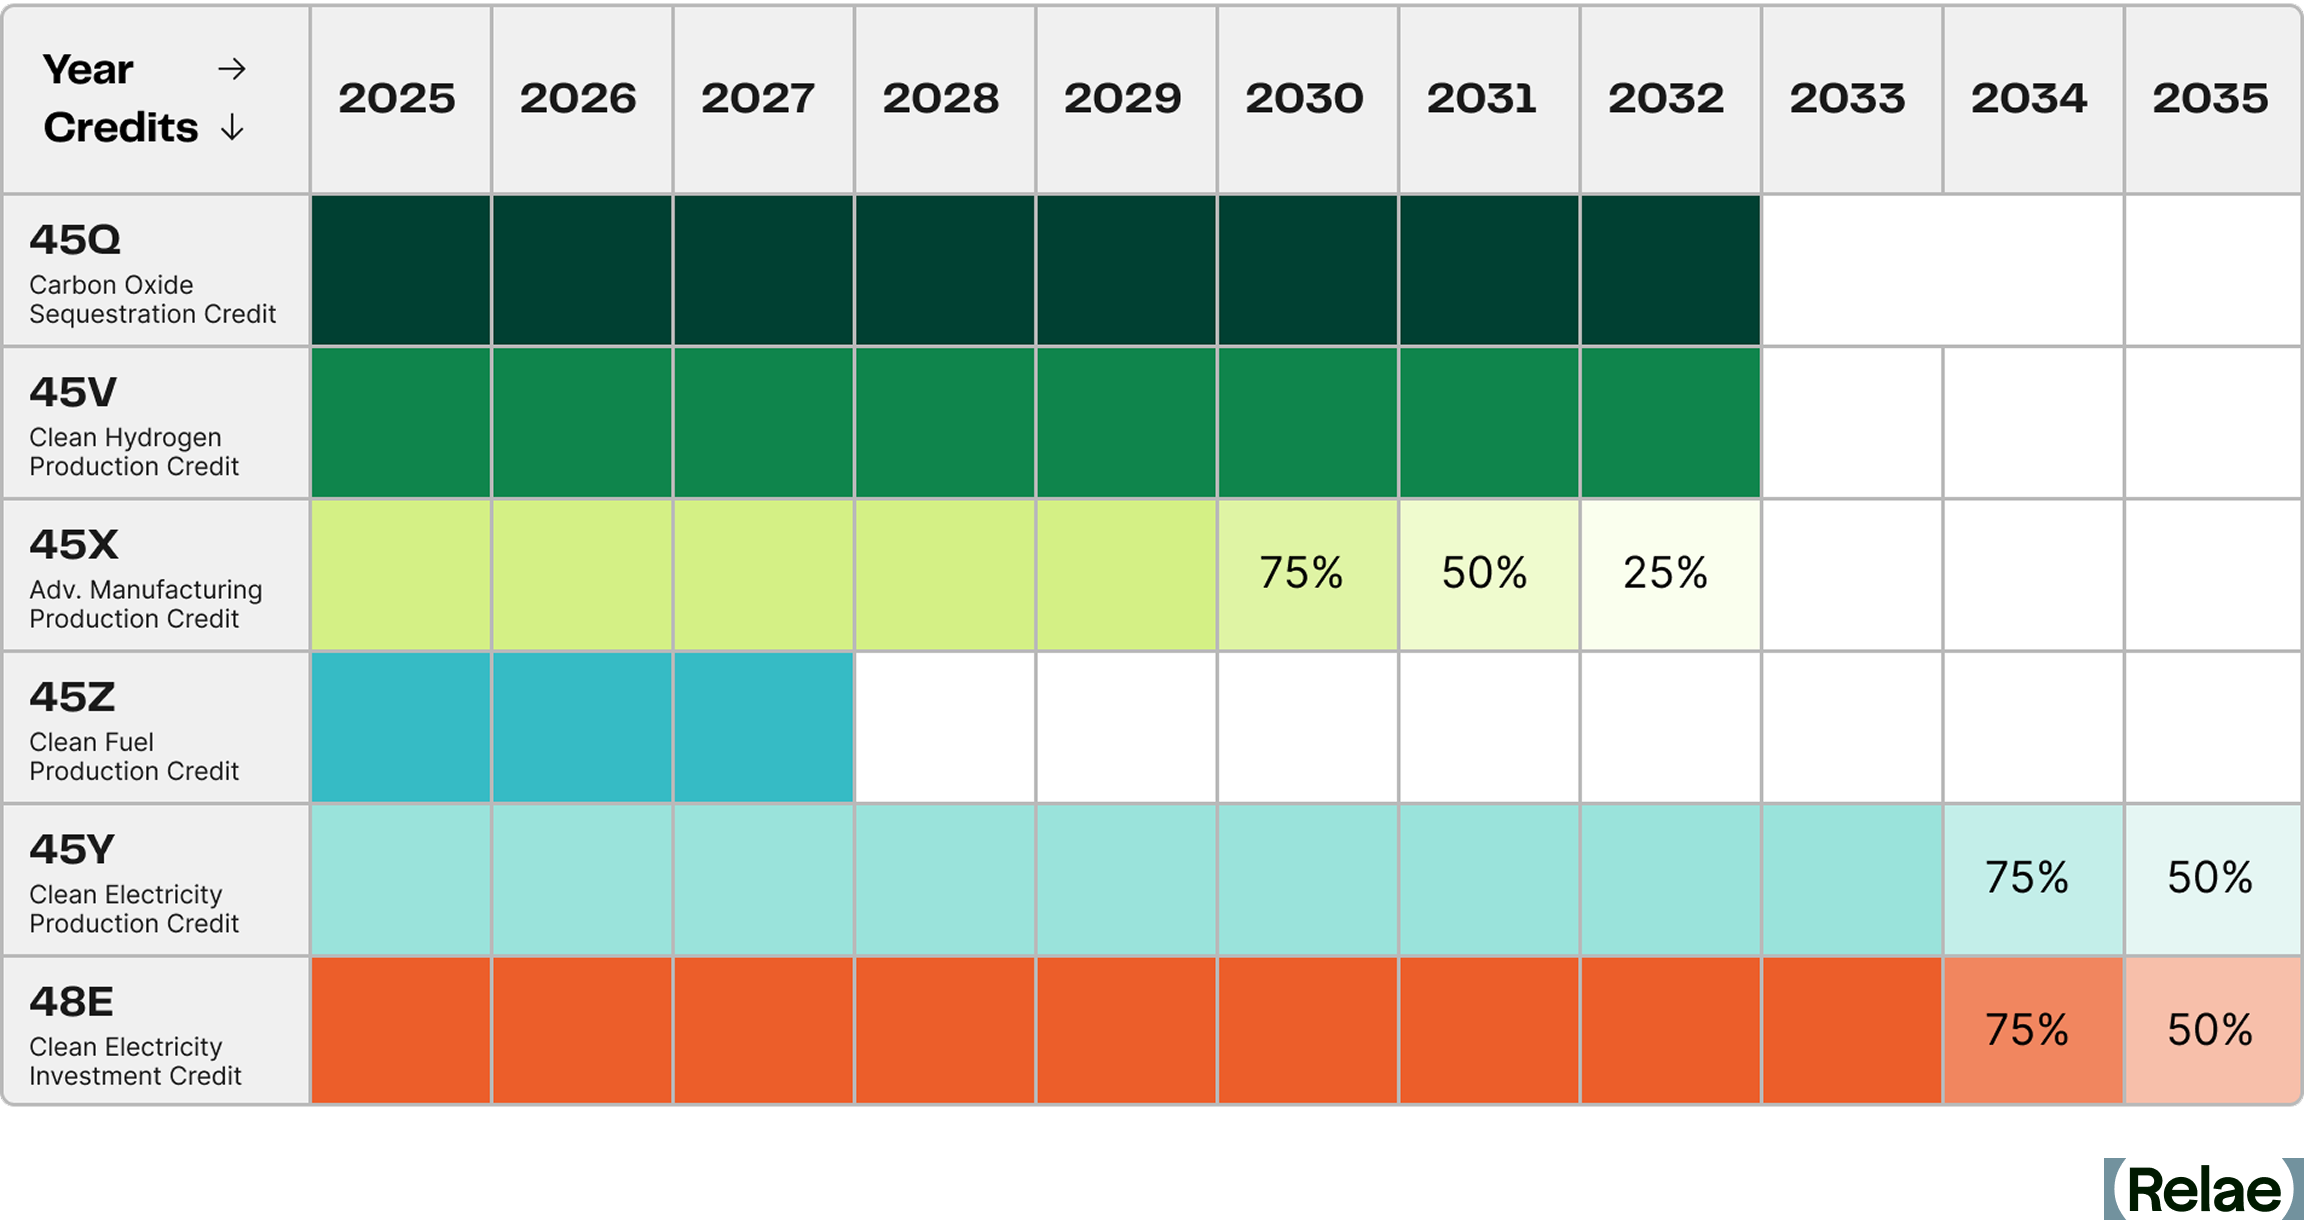
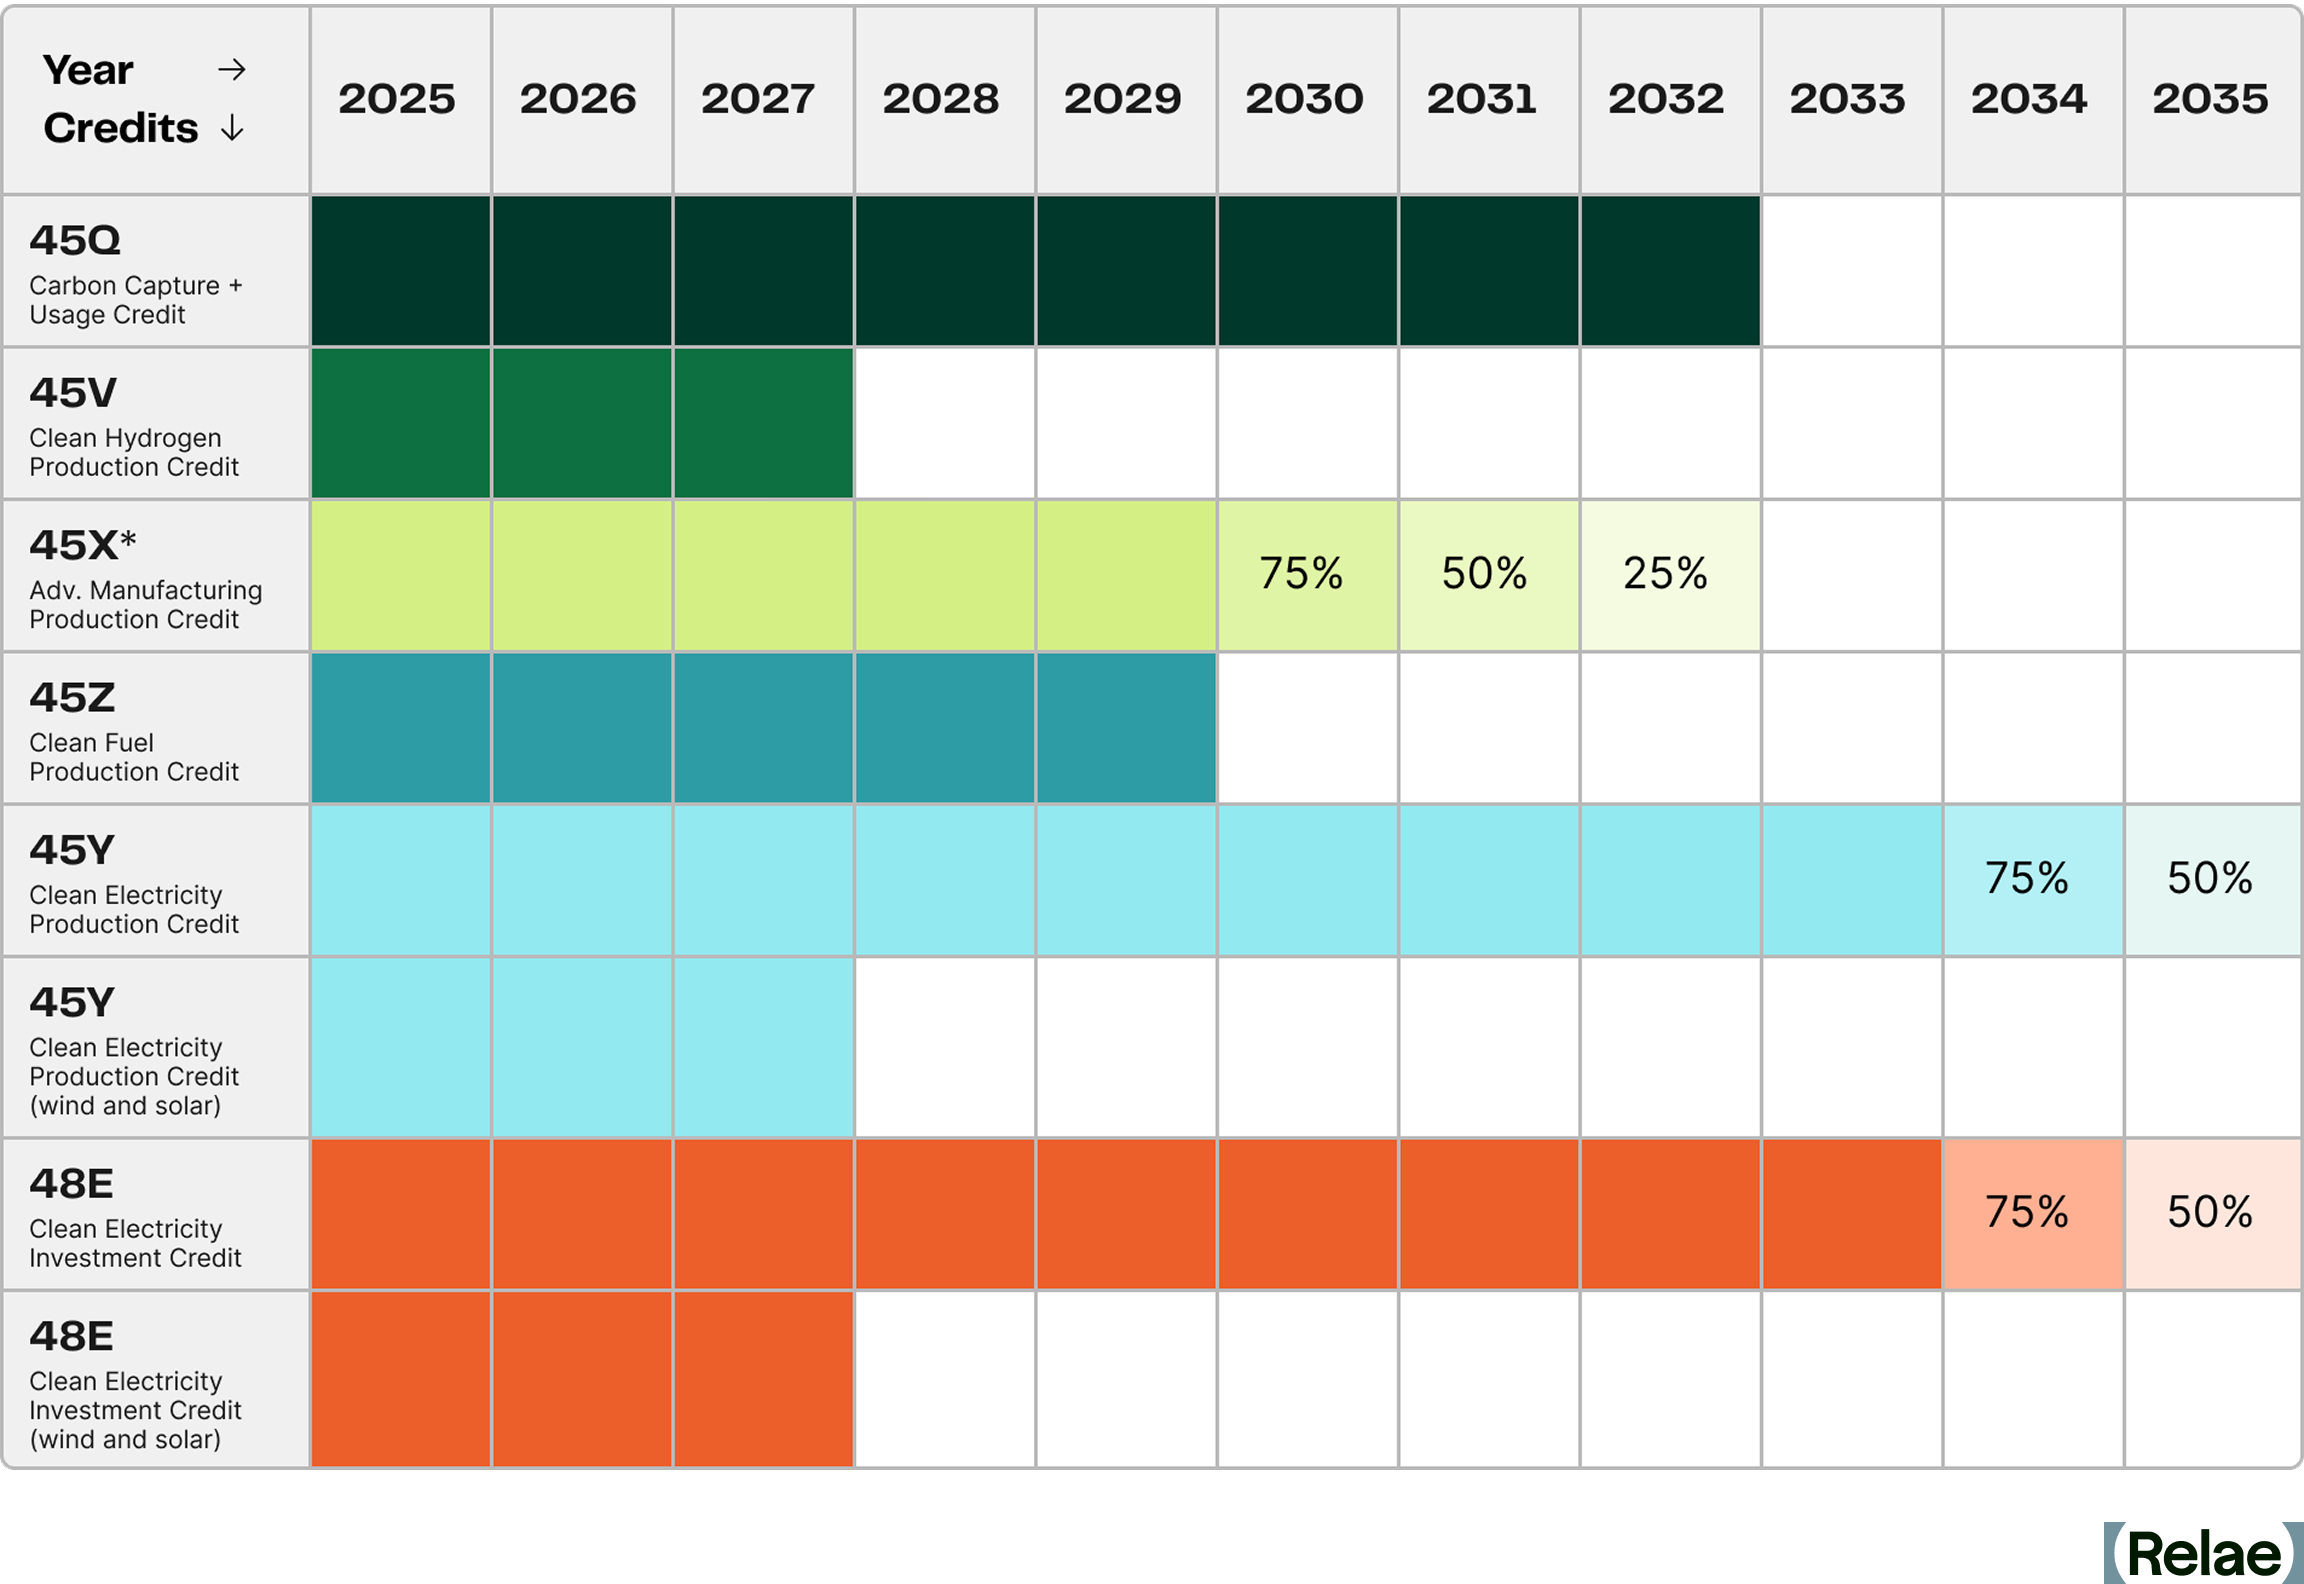
Many of the incentives to deploy clean energy that were created or enhanced under the IRA will be phased out early or repealed altogether. Credits with accelerated phase-out schedules include the newly created 45Y clean electricity production tax credit, which will no longer support wind or solar projects after 2027, and the 45V credit for clean hydrogen production for which projects must now commence construction before Jan 1, 2028 (moved up from Jan 1, 2033).
Since the passage of the reconciliation package, there has been active litigation on several provisions, including an order from a federal district court to vacate IRS guidance that would have prohibited certain wind and solar projects from securing safe harbor. The table below provides a detailed breakdown of key changes to major tax credits between the original IRA, the draft that moved through Committees in the House, and the final text that was passed by the Senate and signed into law.
Major Tax Credit Changes in the Reconciliation Law
How FEOC Restrictions Threaten Clean Energy Supply Chains
Many clean energy tax credits include ambiguous language restricting projects connected to FEOC, complicating supply chains and creating new problems for developers of clean energy projects. The law also introduces a complex matrix of new definitions, such as "Prohibited Foreign Entities," which includes both "Specified Foreign Entities" and "Foreign-Influenced Entities."
The FEOC restrictions embedded in the reconciliation bill represent a seismic shift for clean energy developers. These new rules, designed to limit the influence of Covered Nations (China, Russia, North Korea, and Iran), will disqualify projects from receiving tax credits if they source components, minerals, or intellectual property from entities tied to these nations. In other instances, the partial ownership or investment of an entity with financial ties to a Prohibited Foreign Entity may also disqualify a project from qualifying for tax credits.
This FEOC language matters for developers and investors because of the resulting global supply chain disruptions, investment uncertainty, and compliance burdens. The clean energy sector is deeply reliant on global supply chains, especially for solar panels, batteries, and wind components, industries where China currently dominates. The IRA intended to counter this by moving the manufacturing and production of these supply chains to the US. Project developers must now thoroughly review their supply chains and capital providers, and may need to quickly pivot to compliant resources.
In February 2026, the IRS released interim guidance on the FEOC provisions to provide safe harbor guidance for clean energy manufacturing, investment, and production credits to help taxpayers gauge whether material assistance was provided by a prohibited foreign entity.
Other Major Rollbacks to the IRA
Beyond clean energy tax credits, the reconciliation package also repeals and rescinds many other IRA provisions. This includes a full rescission of all unobligated IRA appropriated balances at the Department of Energy's Loan Programs Office, and several other programs, including:
- The Tribal Energy Loan Guarantee Program
- Greenhouse Gas Reduction Fund
- Transmission Facility Financing
A complete list of rescissions of energy-related funding is outlined in Sections 60001-60024 and 50402 of the law. These rescissions represent tens of billions of dollars in lost climate investments made under the IRA, which would have provided funds to state, local, and Tribal governments, federal agencies, non-profits, and commercial project developers to reduce emissions and update critical infrastructure.
What Can Project Developers and Other Companies Do?
Developers will need to act quickly to meet updated commence construction and place into service requirements, though circumstances are technology specific (e.g., safe harbor updates to 48E and 45Y). Tax credits generally have advanced commence construction and operational deadlines, resulting in a strong first-movers advantage. Companies should also review their supply chains and revise equipment and material procurement sourcing plans as necessary to address restrictions presented in the reconciliation bill.
An executive order from President Donald Trump issued on July 7 will further complicate how companies proceed. In the EO, the President directs his administration to "strictly enforce the termination of […] 45Y and 48E […] for wind and solar facilities." The Administration will likely issue extremely strict interpretations of "commence construction" clauses and FEOC requirements in forthcoming tax credit guidance issued by the Treasury Department, though these moves are quite likely to face litigation.
The new restrictions being proposed by the Administration, including specific details on FEOC, qualified equipment, commence construction, and other reporting requirements, will require additional guidance from the IRS and provide an opportunity for engagement through public comment. It is important that impacted companies weigh in during these public comment periods, not only to help inform and influence the final rules issued by the Administration, but also to build an administrative record that could support litigation efforts to strike down the final rules.
Staying Ahead of Policy Changes
Given the rapidly shifting landscape of energy policy, it's paramount that companies stay abreast of the latest changes and dedicate resources to understanding how they may be affected. Policy professionals, including the experts at Relae (formerly Carbon Direct), can support organizations as they engage in the regulatory process, anticipate and prepare for new legislation, and navigate the requirements to access essential tax credits and incentives. Even under new constraints, expert guidance can help maximize impact and minimize disruption.
Frequently Asked Questions
How does the reconciliation bill change the timelines for major clean energy tax credits?
Most clean energy tax credits saw their windows shortened relative to the original IRA:
- The 45Y and 48E credits now terminate entirely for wind and solar facilities placed in service after December 31, 2027, with a separate phase-down (75% in 2034, 50% in 2035, 0% after) for other technologies.
- The 45V clean hydrogen credit's "commence construction" deadline moved from December 31, 2032 to December 31, 2027.
- The 45Z clean fuel credit now ends on December 31, 2029 (versus 2027 in the original IRA, but bonuses for SAF have been removed and new emissions-calculation methods favor corn ethanol).
- Notably, the 45Q carbon capture credit saw little change and retained transferability, with credit values for enhanced oil recovery and utilization raised to match secure geological storage.
What are the FEOC restrictions, and why do they matter so much for developers?
FEOC ("Foreign Entity of Concern") restrictions disqualify projects from tax credits if they source components, minerals, or intellectual property from entities tied to China, Russia, North Korea, or Iran. Even partial ownership or investment ties to a "Prohibited Foreign Entity" can trigger disqualification. The definitions are complex and still being clarified through IRS guidance, meaning developers need to review supply chains and capital providers carefully and may need to pivot to compliant sourcing.
What should project developers do now in response to these changes?
Developers should move quickly to meet the earlier "commence construction" and "placed in service" deadlines, since credits now benefit early actors. This includes reviewing and potentially restructuring supply chains and procurement plans to address FEOC restrictions, and closely monitoring forthcoming IRS/Treasury guidance.
Power & Energy
Relae provides independent advisory for large corporate buyers, power providers, and infrastructure investors making high-stakes decisions about clean firm power, grid constraints, data center energy optimization, and long-term investment strategy. Our insights help you evaluate solutions that can be deployed reliably, responsibly, and affordably, so you can navigate an evolving energy landscape with confidence.
Ready to Navigate What Comes Next?



Rory Jacobson

Rory Jacobson

Rory Jacobson is the Head of Policy at Relae. Previously, he served as the Director of the Carbon Dioxide Removal program within the Office of Fossil Energy and Carbon Management (FECM) at the U.S. Department of Energy (DOE). In previous roles at DOE, Jacobson has supported and coordinated FECM’s carbon removal and management programs and projects.
Prior to joining DOE, Jacobson was a Deputy Director of Policy at Carbon180, where he managed the federal policy portfolio for engineered carbon removal pathways. He has led carbon management research and analysis in multiple roles, including with the Natural Resources Defense Council and the World Resources Institute, and Relae. Jacobson received his master’s in environmental management from the Yale School of Forestry, where he was a Kerry Fellow.
Kerry Fellowship (2021-2022)
Yale Jackson School of Global Affairs
Secretary’s Honor Award (2023)
U.S. Department of Energy
What to Read Next
Dynamic Line Rating: The Fastest Gigawatt Is the One You Already Have
Key Takeaways
- Power demand is outrunning buildout. Meeting large load growth requires more than new generation; it requires faster interconnection and congestion relief on existing transmission lines.
- Dynamic line rating (DLR) is available today, deploys in months, and enables faster speed-to-power. On the right thermally congested lines, DLR can unlock more capacity at a fraction of new infrastructure cost. In one utility demonstration, 5% to 10% of additional capacity was enough to clear most of the congestion on the lines studied.
- DLR has been held back by weak incentives, but that is changing. Utilities earn a regulated return on capital they invest in new assets, which favors building new infrastructure over lower-cost solutions like DLR. Load growth and new Federal Energy Regulatory Commission (FERC) mandates are starting to shift the calculus.
The Grid Cannot Expand Fast Enough for AI Demand, But It Can Carry More
Power demand is booming as data centers scale across the US grid, and current grid infrastructure cannot supply it. This constraint is physical, not financial. Meeting this demand requires a significant amount of power generation and infrastructure upgrades. More than 2 terawatts of generation and storage sit in interconnection queues, roughly 1.5x the total installed generation capacity in the US.
Regional markets are working to accelerate generation buildouts, but connecting that generation to the transmission network remains expensive and slow to match speed-to-power needs. New high-voltage lines take years to permit, cost between $2 million and $6 million per mile to build, and major projects routinely take five to ten years from identification to energization. For example, PJM Interconnection LLC (PJM) identified the Doubs–Goose Creek 500 kilovolt (kV) corridor as a bottleneck feeding Data Center Alley in 2023 and set June 2027 as the date a fix was needed. Dominion Energy's published schedule for its portion of that rebuild anticipates a completion date of 2031.
A number of studies1,2 show there is headroom in the bulk transmission system. Grid-enhancing technologies, such as dynamic line rating (DLR), can convert part of that headroom into capacity today while new generation and transmission are being built. DLR lets suitable transmission lines increase their carrying capacity in real time, unlocking that headroom at a fraction of the cost of a buildout. Realizing that value is a targeting exercise with a key question: On which thermally limited lines can DLR actually relieve congestion?
What Is Dynamic Line Rating?
Dynamic line rating is a method for calculating a transmission line's real-time carrying capacity using live weather and conductor-temperature data. It lets grid operators safely carry more power whenever weather conditions allow.
Most transmission lines operate under a static rating: a fixed, conservative limit on current, set for worst-case weather and held all year. The limit is based on temperature, because pushing too much current can overheat the conductor wire. Metal conductors expand as they heat, which can make them sag and touch trees or other obstacles, causing short circuits or fires. Real conditions almost always cool a conductor better than the worst-case assumption a static rating is built on. That means the line can carry more current while staying at the same maximum conductor temperature, and therefore within the same sag and clearance envelope. That headroom is exactly what DLR captures: instead of leaving it on the table, DLR recalculates the line's rating in real time so operators can use the extra capacity safely.
Beyond a static rating is the ambient-adjusted rating (AAR), which many utilities have begun adopting. An AAR recalculates the rating from forecast ambient air temperature, typically hourly and out to several days. DLR goes further, adding wind speed and direction, solar heating, and in some deployments the conductor's measured temperature.
DLR technologies rest on a heat-balance algorithm: how fast a line heats up (from electric current and sunshine) versus how fast it cools off (from wind and cold air). The calculations are standardized in IEEE 738 in North America and CIGRE 601 internationally. The data feeding those calculations can come from line-mounted sensors, weather models, or both, depending on a tradeoff between per-span accuracy and the cost of installing sensors along every span.
Even so, DLR remains limited in the US, and AAR has been slow to arrive. FERC's Order 881 required the transmission providers it regulates to adopt AAR by July 2025, but FERC has granted numerous extensions. PJM became the first to fully implement AAR in March 2026, while Midcontinent Independent System Operator (MISO) and New York Independent System Operator (NYISO) are not expected until 2028.
The Near-Term Value of DLR: Reducing Grid Congestion
DLR's value is immediate. It can be installed in months, not years, so a currently congested line can start carrying more power the moment conditions allow, reducing congestion right away. When cheaper generation is available upstream of that line, DLR cuts costs directly, because grid operators no longer need to dispatch pricier generation downstream of the congestion to supply load. That means DLR can reduce congestion costs in the current delivery year, compared to a transmission line rebuild that sits in a decade-long queue.
Over a longer horizon, utility planners can build that headroom into long-term capacity models. This is important, because current capacity-expansion and integrated resource plan (IRP) models still run on static or seasonal ratings, and typically leave out the potential gains from grid-enhancing technologies like DLR.
NERC's large loads white paper and FERC's RM26-4 rulemaking both raise the issue of how utilities can absorb multi-hundred-megawatt data center requests without a decade-long transmission build. Solutions like DLR are one of the few tools that can compress that timeline.
The hardware itself is cheap: sensors and data management cost a small fraction of any physical upgrade. That means the economics comes down to identifying the lines that benefit most from DLR. This is particularly important because on most US grids, congestion concentrates on a small number of lines that repeatedly reach their limits. On those lines, DLR can cut congestion costs directly and defer costlier upgrades, while its potential on other lines may be far lower. As a result, identifying those high-potential, thermally congested lines is essential.
Proven DLR Examples in the Industry
Real deployments show DLR can reduce a meaningful share of transmission congestion costs, with extra carrying capacity above the static rating running roughly 5% to 30%, depending on how often that capacity is available. In Oncor's ERCOT demonstration, 5% of additional capacity would have relieved up to 60% of congestion on the target lines, and 10% would have practically eliminated it. PPL Electric in Pennsylvania/PJM reports annual customer savings of $23 million after deploying DLR across its initial three lines. The DLR installation cost about $250,000, against a rebuild alternative that would have cost about $50 million and taken far longer.
The contrast abroad is instructive. Austria's grid operator, APG, recorded about $13 million a year in congestion savings across roughly 15% of its network. While these savings are real, it's important to recognize that these results come from single, well-chosen, badly congested lines.
The UK's National Grid began with a two-year DLR trial on a single 275 kV circuit in 2022, expanded to more than 275 kilometers of its network by 2025, with estimated consumer savings of about $26 million a year. In April 2026, National Grid signed a five-year contract covering 585 kilometers more, with most installations due by 2028 and potential savings of up to $66 million. Each expansion followed measured results from the stage before it.
Where the Headroom Is: Screening PJM's Data Center Alley
To illustrate the congestion savings from DLR, Relae screened PJM's five-minute real-time market record for every binding transmission constraint in 2025. For each one, we captured the shadow price, the marginal value of relaxing that constraint.3
Our analysis focused on thermal constraints, and then identified lines that bind frequently, in conditions milder than the worst case their static rating was set for, which is when a conductor's true rating sits above its static assumption. For the lines that we identified, congestion costs were added over the binding hours to set a bound on the savings that could result from DLR. That full amount would not necessarily be realized in practice, because the shadow price values only the next megawatt freed, and relieving one line can shift the constraint to the next. However, it serves as a useful estimate for the scale of savings that could be achieved.
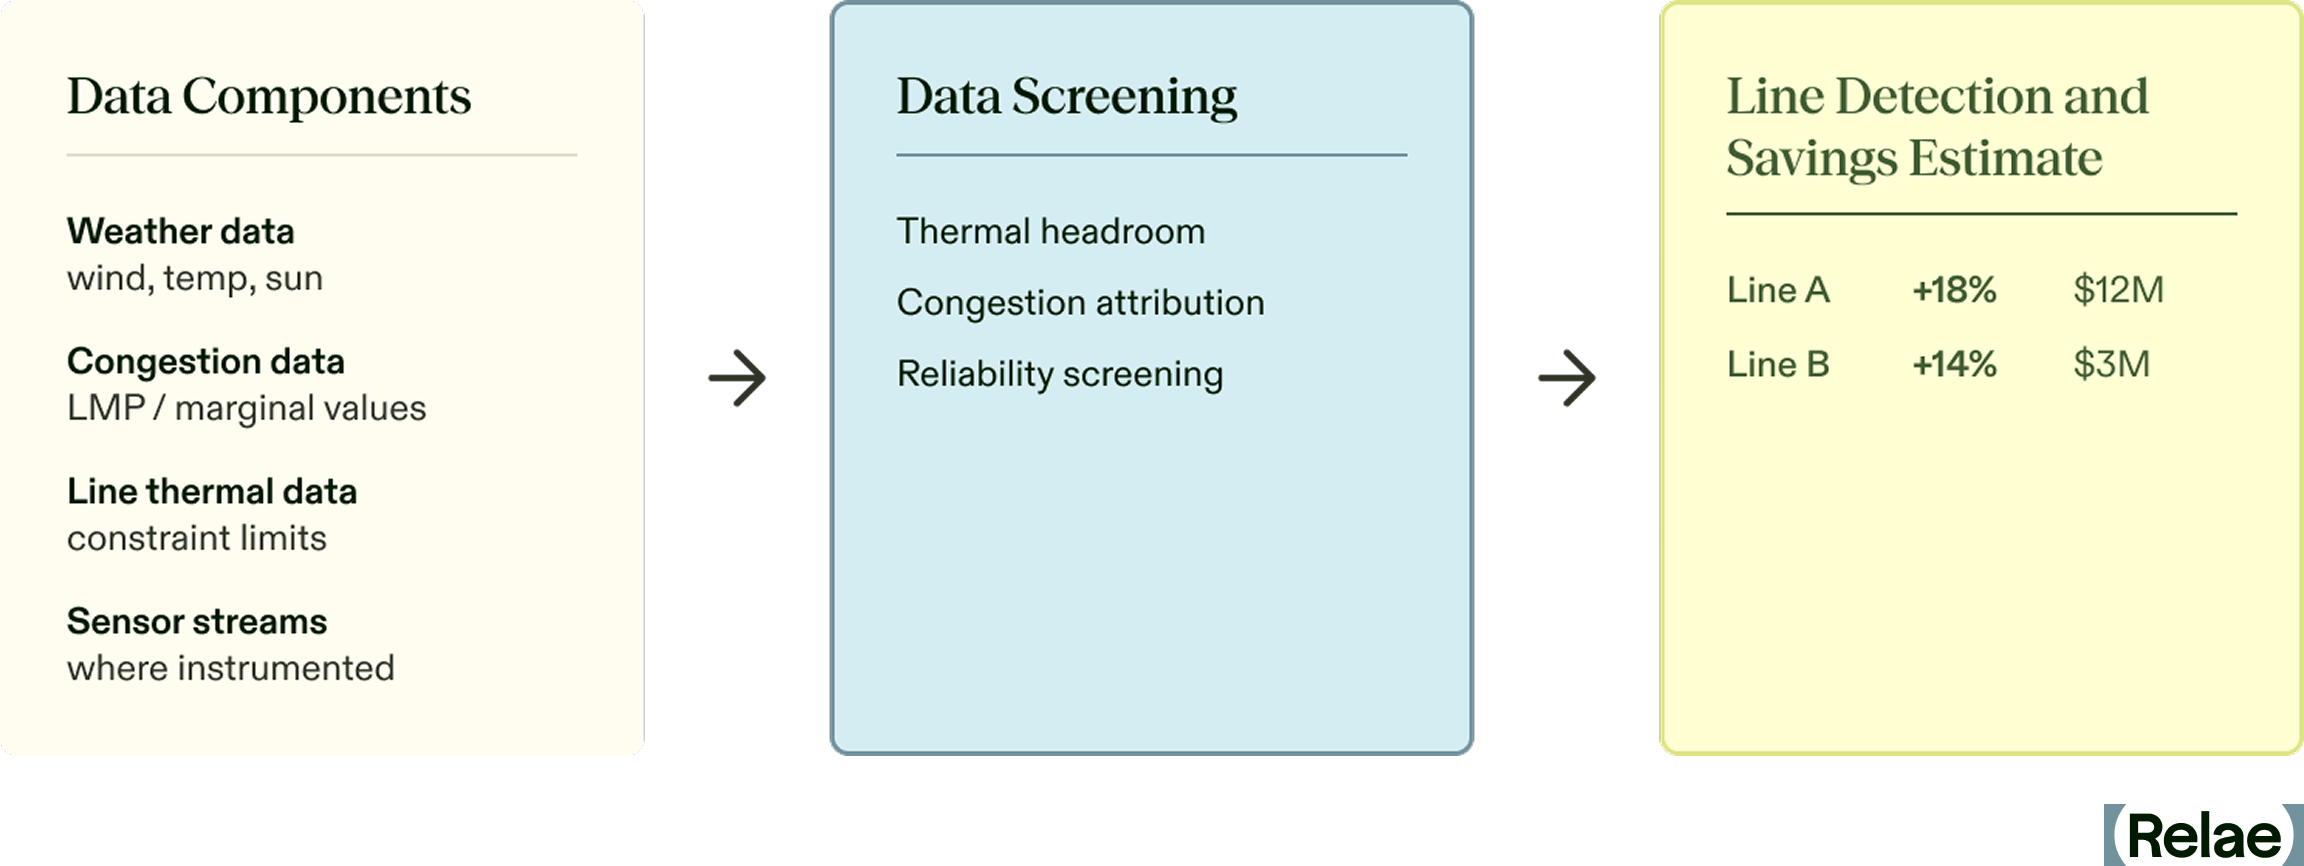
We ran the analysis on the Dominion (DOM) zone in PJM, home to Data Center Alley in Loudoun County, Virginia. Figure 2 shows a high-level section of the grid. The 500 kV bulk grid steps down through transformers to the 230 kV substations feeding the data centers, with the lines that experience recurring congestion highlighted. A handful of those 230 kV lines showed up as binding thermal constraints again and again.
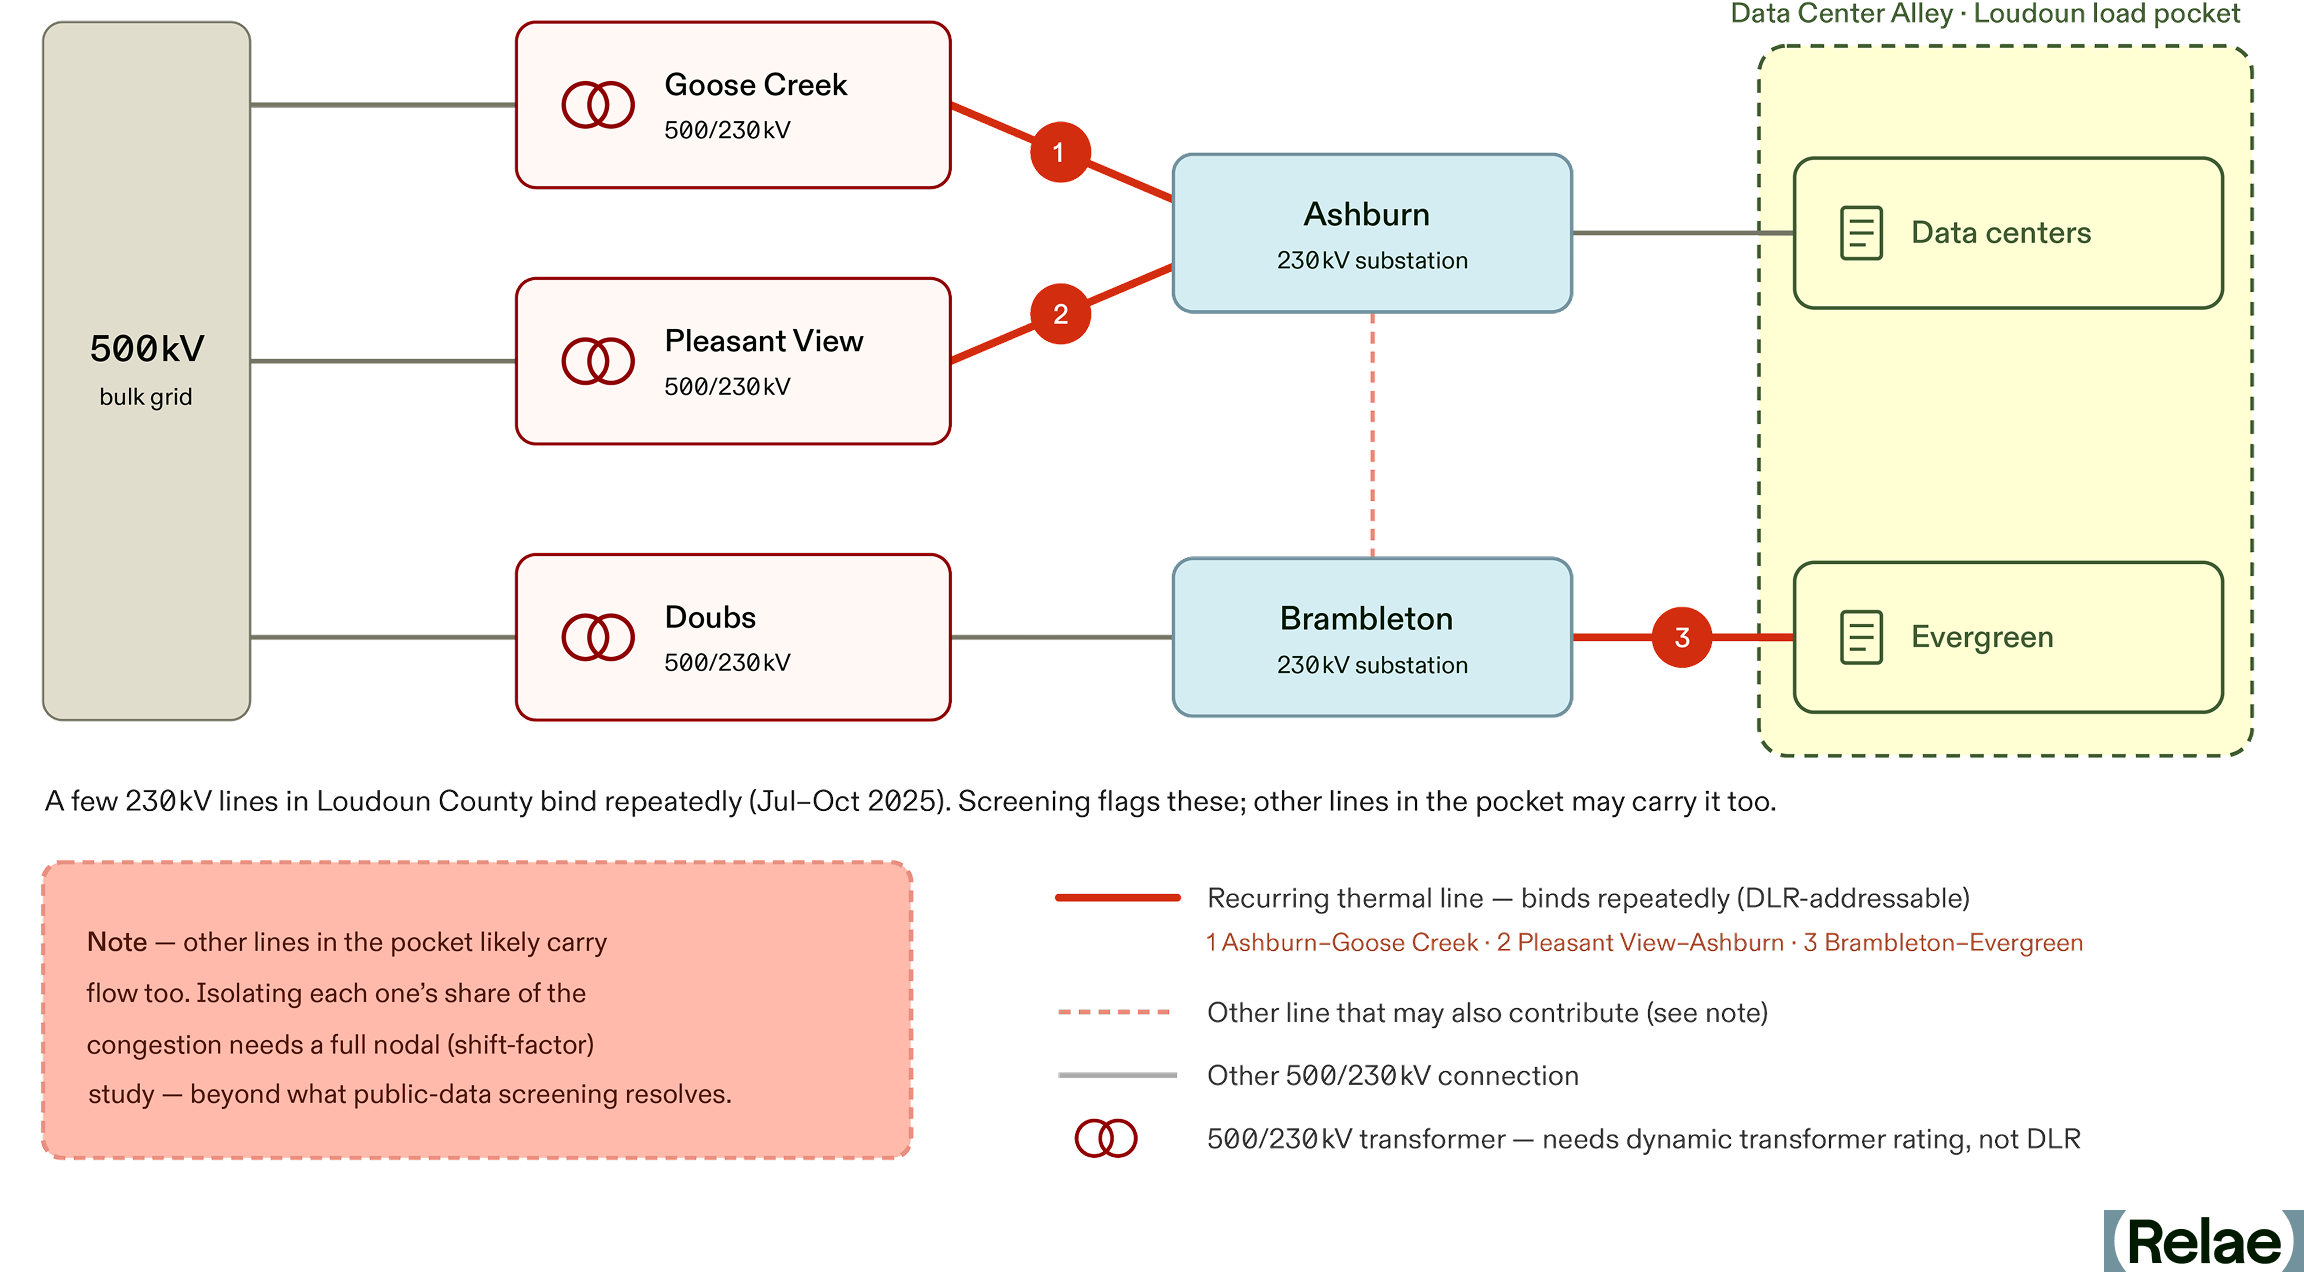
The congestion in DOM isn't constant, and it concentrates in particular months and within the day in particular hours. Figure 3 shows three transmission lines within the DOM zone and the number of hours each was thermally congested in each hour-of-day slot over 2025. Binding concentrates in the warm months and, within the day, from late morning through early evening.
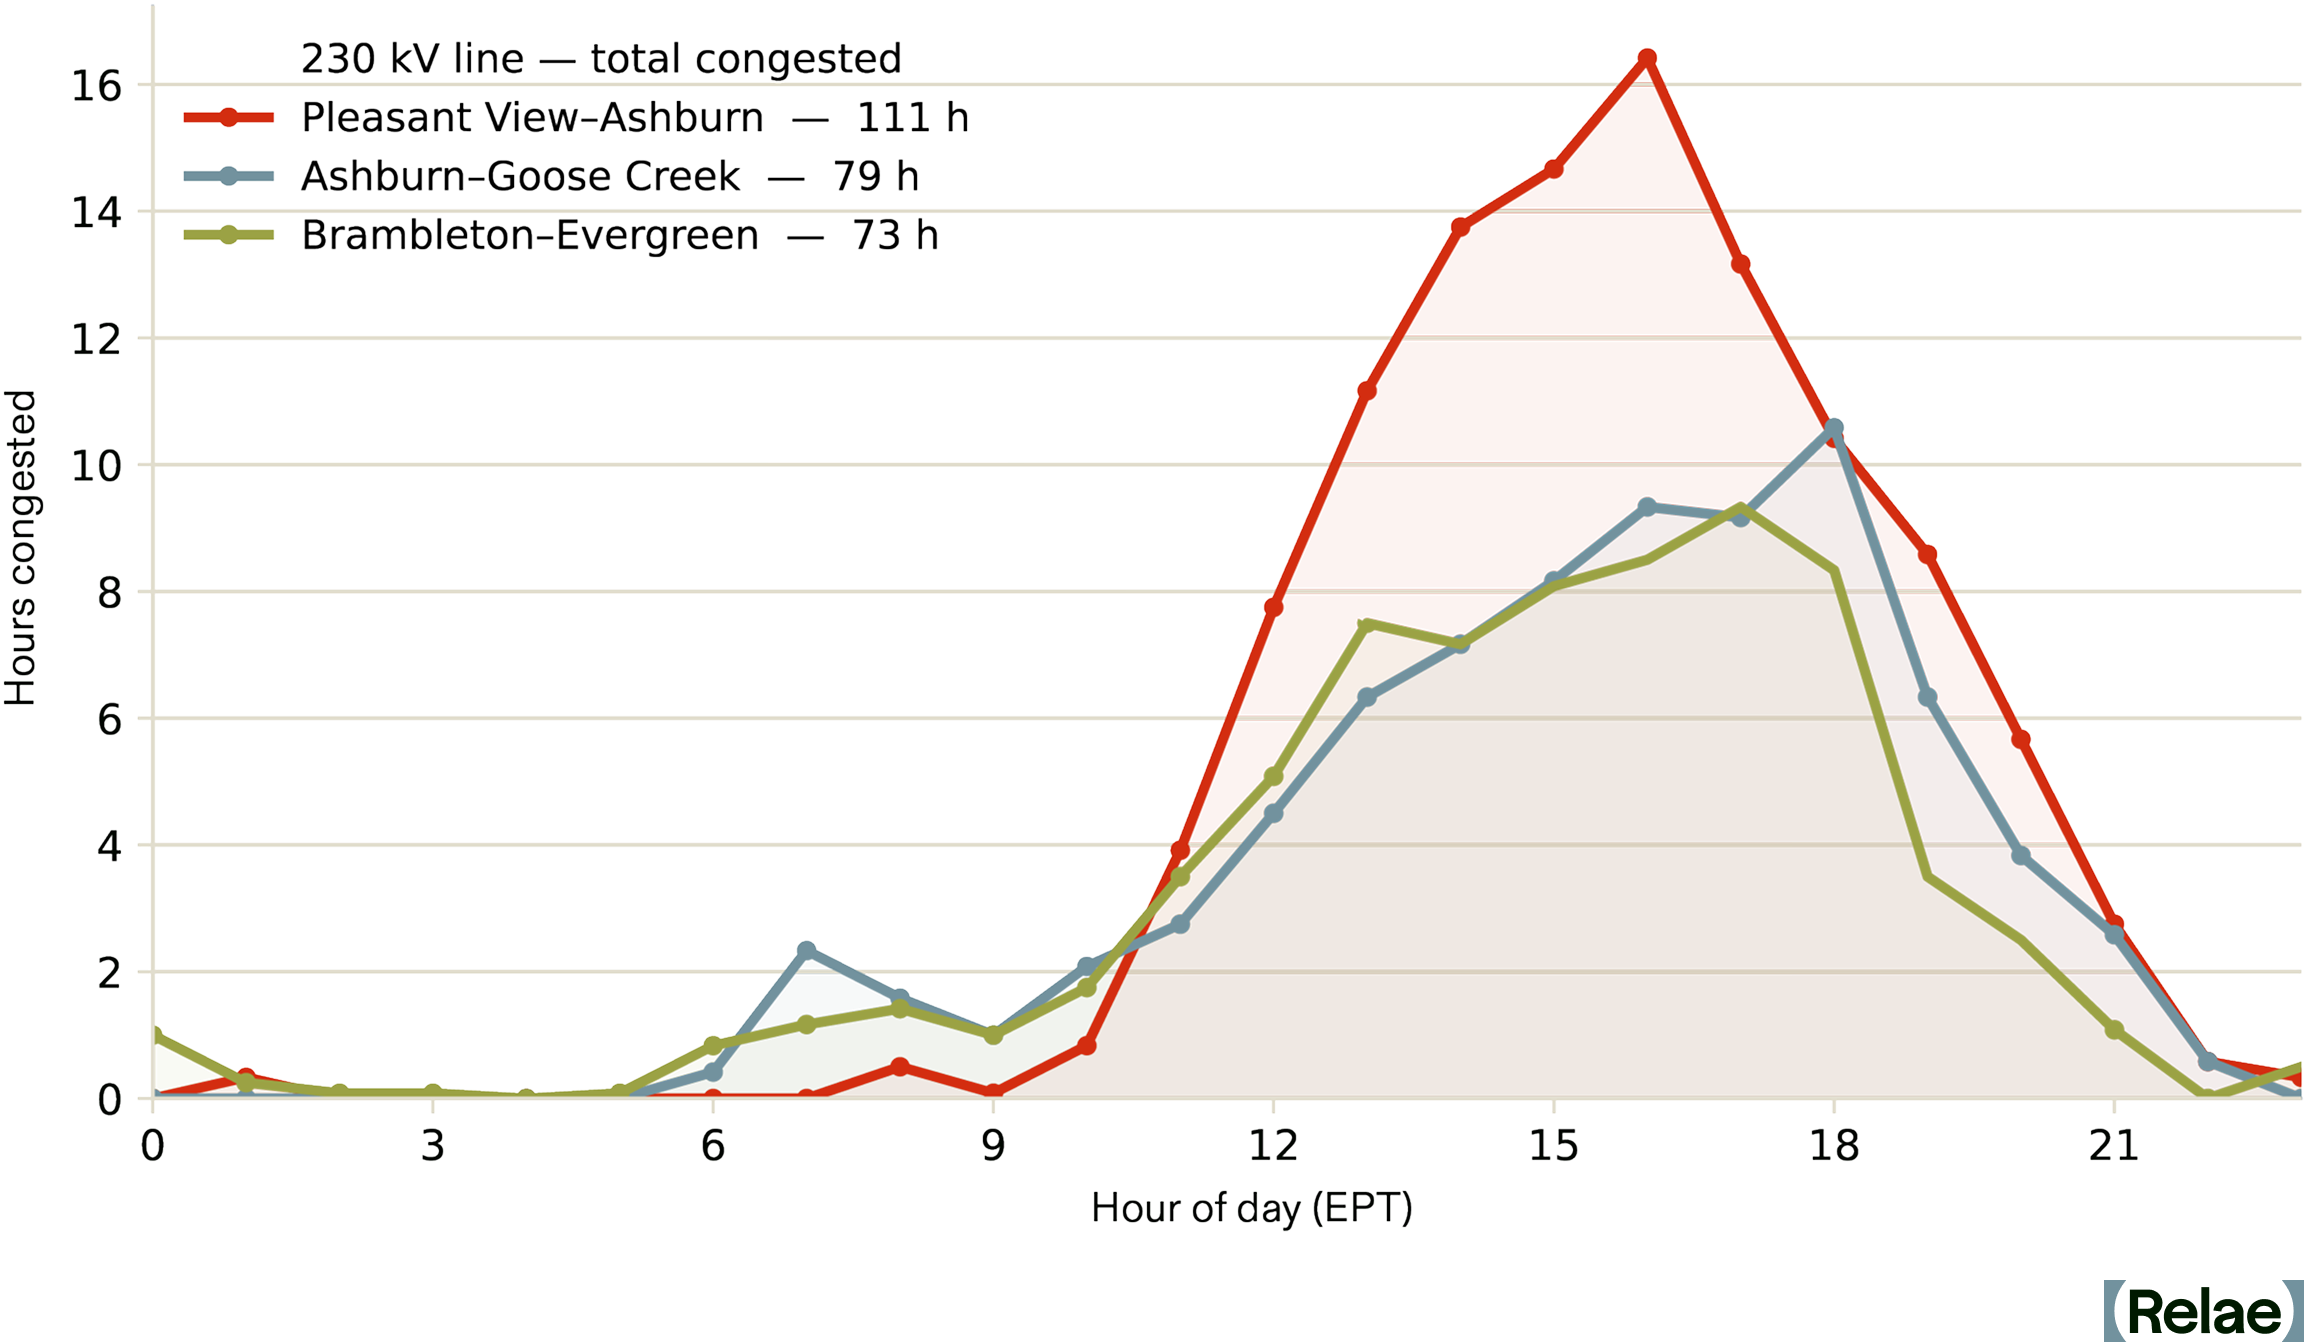
At first glance, this period looks like the wrong window for DLR. The local weather record says otherwise. These periods turn out to be some of the windiest hours of the day, not the stillest. Median wind speed at Dulles ran about 3.5 m/s, above the 0.6 m/s crossflow a static rating conventionally assumes, with fewer than 5% of observations falling below that threshold. Median ambient temperature in those hours was about 26°C, against the 35–40°C a static summer rating is typically built for. Across all three lines, the large majority of congested hours coincided with weather that would have supported a materially higher rating.
Valuing just one megawatt of DLR relief at each five-minute shadow price, the estimated savings are worth roughly $300,000 in this three-line example across about 263 line-hours.4
Because the value concentrates on a handful of thermally limited, heavily congested lines, and because the operational case has to be made line by line, capturing the opportunity is fundamentally an analytics problem: find the right lines, and prove the savings.

What Does It Take to Scale DLR?
DLR is cheap and effective, but two things stand between it and broader adoption: incentives and advanced grid analytics.
The utility cost-of-service model recovers investment in generation and transmission assets and earns its profit as a regulated return on the capital deployed. Because rates recover capital rather than power delivered, utilities have a stronger incentive to build or upgrade lines than to move more power across the ones they already own. That bias toward capital investment over optimization is why a mature technology has stayed niche in the US for years. Regulators have started to look more closely at this, but the main federal rule still mandates the milder AAR, not DLR, and leaves the return model untouched.
Contingency analysis compounds the problem. Current models are built around fixed line limits. A rating that changes hour to hour adds real modeling work, and more importantly, the system still has to hold under worst-case contingencies. So while operators already forecast weather daily for wind and solar, the harder step is trusting a forecast enough to commit a transmission limit against it. That takes significant predictive analytics built into system planning, not bolted on after.5
How Policy Is Starting to Shift the Calculus
Policy is starting to move the incentive problem. FERC's Order 881 made AAR the minimum for the transmission providers it regulates (effective July 2025, with several operators on extended timelines) and required markets to be capable of accepting dynamic ratings. PJM has started to implement this: PPL Electric has run sensor-based DLR on nine congested lines since 2022, feeding PJM's day-ahead markets.
Order 1920, FERC's first long-term transmission-planning overhaul in more than a decade, now requires planners to formally evaluate grid-enhancing technologies like DLR against conventional builds. It stops short of mandating deployment, but it forces a comparison utilities used to skip. That comparison is now written into filed tariff processes (PJM filed its plan in December 2025). Those first cycles only began in 2026, and the order allows up to three years to reach a selection, so the results are still pending.
A shared-savings incentive, letting a utility keep a slice of the congestion savings it creates, has been proposed to FERC and championed in the Advancing GETs Act, but it isn't yet a rule, so the core misalignment stands. DOE's GRIP program has funded grid-enhancing deployments, and by early 2026, 16 states had some form of advanced transmission technology requirement, with Colorado adding its Grid Optimization Act in April 2026.
The newest pressure is coming from the demand side. Through 2025–26, FERC began overhauling how large loads connect to the grid, and while none of it touches the utility's return on capital, it changes who sees the costs. FERC issued show-cause orders directing all six grid operators to justify or reform their large-load rules. This tees up consideration of alternative transmission technologies in study processes and greater transparency into costs.
And the rules are moving toward making the large load pay for the upgrades its connection requires. Pennsylvania's model large-load tariff, for example, recommends utilities charge data centers for the upgrades their interconnection makes necessary. It also instructs utilities to let those customers self-construct certain upgrades, including some affecting the wider grid. That combination is what matters. The party paying the bill now has a reason to ask whether a cheaper fix exists and, in at least one state, a route to build it. We have not yet seen a DLR deployment selected this way, because these frameworks are only months old, but the cost gap between a DLR fix and a rebuild is becoming visible to the party who pays the difference.
How Relae Helps Find the Value of DLR
Through our Power, Data, and Innovation practice, Relae combines transmission congestion data, line-level thermal constraints, and short-term weather forecasts into a single view of where dynamic ratings would actually pay. The output is a short list of candidate lines, each with a modeled capacity uplift and an estimated dollar value, turning a vague “DLR is promising” into a priced, line-by-line decision. It is the transmission-side complement to our work on the interconnection queue and demand-side flexibility. All three are ways of closing the gap between demand and delivered capacity faster than new construction allows.
The Business Case for Carbon Accounting: What It Is and Why It Matters
Key Takeaways
- Carbon accounting is a regulatory and strategic necessity, with policies like the European Union’s Corporate Sustainability Reporting Directive (CSRD) and California’s SB 253 requiring emissions tracking.
- Many companies track emissions inconsistently, underscoring the need for structured, repeatable carbon accounting to ensure accuracy and impact.
- Accurate carbon data drives efficiency and risk management, helping organizations reduce costs, streamline supply chains, and comply with climate regulations.
- Scope 2 emissions are increasingly challenging to quantify, especially for data centers and power-intensive operations. Grid-average emissions factors mask location-specific and time-specific variations that drive real procurement and siting decisions. Precise scope 2 accounting requires understanding which generators actually serve the load, when, and under what grid conditions.
- Scope 3 emissions have historically been a complex challenge, requiring better supplier engagement, standardized reporting, and expert guidance to support accuracy.
Carbon Accounting: More Than Compliance, a Strategic Advantage
Companies increasingly recognize the business value of reporting carbon emissions: it reduces regulatory risks, attracts sustainability-focused investors, enhances market competitiveness, and drives cost savings through efficiency. Transparent emissions reporting strengthens brand trust and aligns companies with global sustainability standards, ultimately turning climate accountability into a strategic advantage.
Yet, many companies struggle with incomplete and inconsistent tracking. According to the State of Corporate Climate Commitment, 80% of corporate professionals surveyed have tracked emissions at least once, but only 52% do so annually. Without a structured process and reliable data, businesses face compliance risks, financial penalties, and missed cost-saving opportunities.
This guide provides a clear roadmap to effective carbon accounting, equipping businesses with the knowledge to navigate regulations, enhance data accuracy, and implement effective strategies for compliance and operational success.
[stat]
What Are the Benefits of Effective Carbon Accounting?
By embedding annual carbon accounting into operations, organizations can enhance sustainability efforts while achieving financial and strategic benefits. Key benefits include:
Enhancing Transparency and Accountability
By providing accurate and verifiable emissions data, companies can showcase corporate responsibility and build a foundation of transparency. Aligning with recognized standards like the GHG Protocol strengthens confidence among investors and regulators. As climate disclosure laws tighten globally, ensuring credible emissions reporting reduces regulatory risks and enhances stakeholder trust. This commitment to authenticity minimizes the risk of greenwashing and strengthens brand reputation.
Guiding Regulatory Compliance and Risk Mitigation
Businesses navigating evolving environmental regulations must proactively align with policies to avoid financial and legal risks. Mandated emissions reporting, under policies like the European Union’s Corporate Sustainability Reporting Directive (CSRD) and Carbon Border Adjustment Mechanism (CBAM) as well as California’s SB 253, ensures compliance and enhances corporate accountability. Staying ahead of these evolving requirements prepares businesses for future policy shifts and safeguards their long-term resilience.
Improving Operational Efficiency and Reducing Costs
By analyzing energy consumption patterns, organizations can identify operational inefficiencies, optimize supply chains, and implement cost-saving measures while reducing carbon emissions. For example, evo, an outdoor experiences company, collaborated with Relae (formerly Carbon Direct) to assess its carbon footprint. This analysis revealed opportunities to reduce emissions across facilities, products, and shipping. By promoting sustainable practices throughout their supply chain, evo enhanced both environmental performance and operational efficiency.
Building a Competitive Advantage in a Low-Carbon Economy
Building a competitive advantage in a low-carbon economy requires prioritizing emissions transparency and sustainability. Companies that integrate emissions transparency into their operations build stronger relationships with supply chain partners and meet consumer demand for responsible brands. Aligning corporate values with sustainability fosters long-term customer loyalty and enhances market positioning.
Driving Strategic Planning and Net-Zero Alignment
Setting and tracking net-zero commitments requires structured, data-driven carbon reduction roadmaps. Businesses that measure emissions annually are more likely to set public sustainability goals and take action. Carbon accounting supports clean energy transitions, fosters supply chain collaboration, and integrates carbon removal strategies to address residual emissions. By embedding emissions measurement into long-term planning, organizations facilitate resilience and profitability in an evolving business landscape.
Carbon emissions measurement correlates to climate action: 61% of companies that calculate their footprint annually have both set a public goal and begun working toward it.
What Is Carbon Accounting? The Basics You Need to Know
Carbon accounting is the systematic measurement, analysis, and reporting of an organization's greenhouse gas (GHG) emissions. Using standardized metrics like carbon dioxide equivalent (CO₂e), companies can assess emissions across operations and supply chains, identify high-impact areas, and set and track progress toward emissions reduction targets. When conducted annually, carbon accounting supports regulatory compliance, risk management, and decarbonization strategies essential for long-term sustainability.
The GHG Protocol is the most widely used framework for carbon accounting, setting the baseline for how organizations measure and report their emissions. It classifies emissions into three scopes:
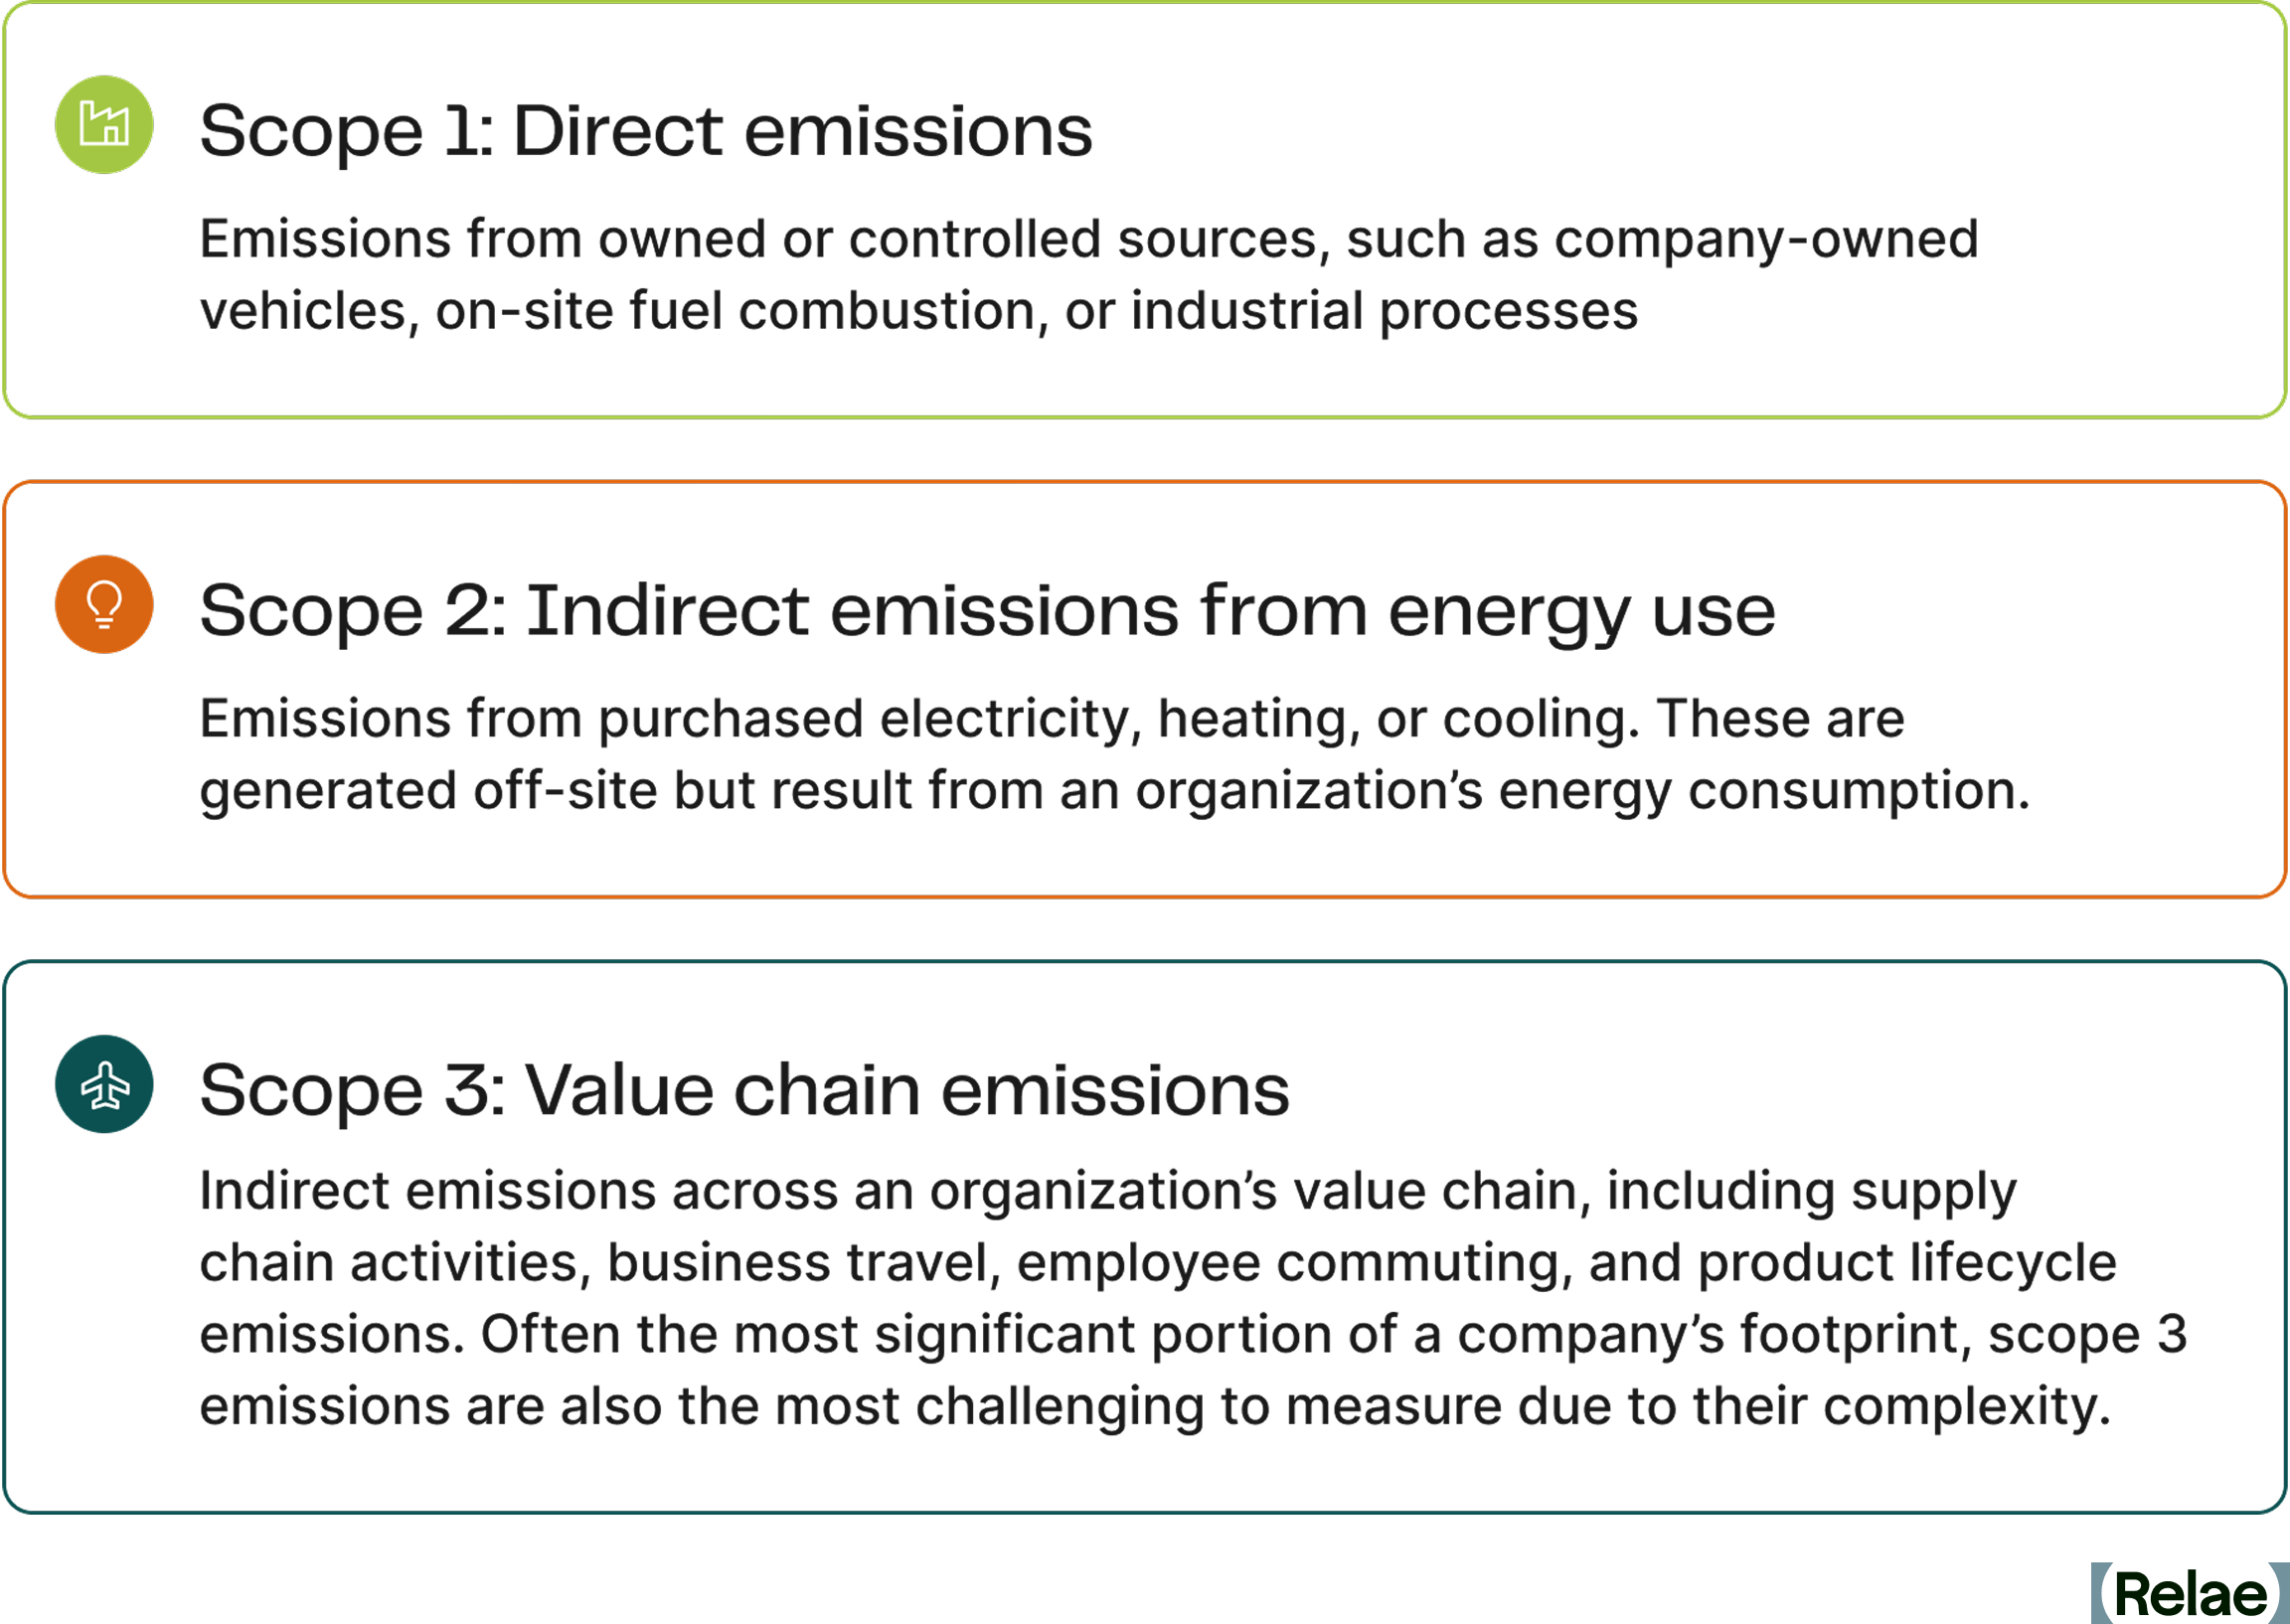
Keep in mind that scope 2 emissions are increasingly difficult to quantify using traditional methods, which fail to account for real-time grid fluctuations and locational energy variations. Cutting-edge, advanced carbon accounting methodologies now provide more precise tracking, particularly benefiting large power consumers like enterprise data centers and hyperscalers.
Scope 3 emissions also continue to pose a great challenge, requiring extensive data collection and supplier coordination, complexities that are difficult to navigate without expert guidance.
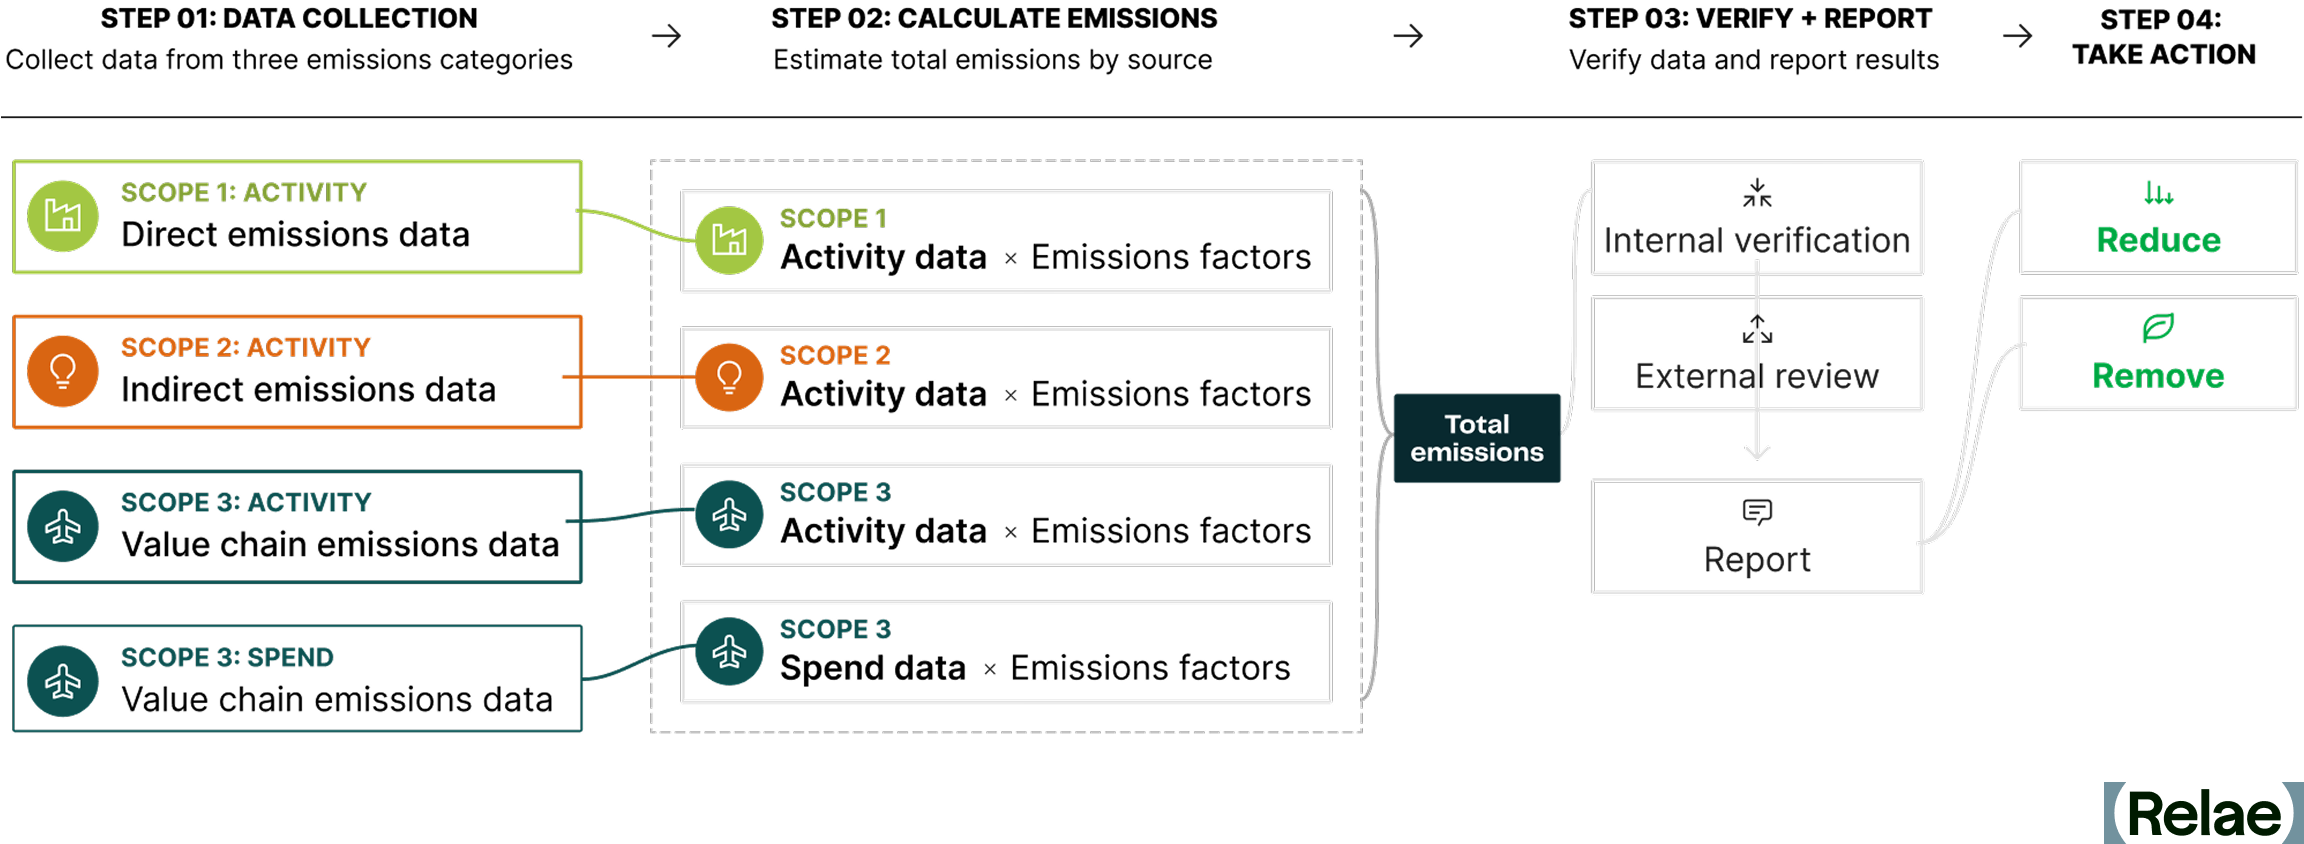
The Corporate Carbon Accounting Process: A Step-by-Step Guide
The carbon accounting process involves systematically measuring, analyzing, and managing an organization’s greenhouse gas emissions across its operations, supply chain, or product life cycle.
- Collect emissions data across all three scopes (scope 1, scope 2, and scope 3).
- Categorize and quantify emissions from each source to estimate the total impact.
- Verify data and report findings to promote compliance, accuracy, and transparency.
- Develop and implement reduction strategies based on insights from the data.
Activity Data Versus Spend Data
Carbon measurement primarily relies on two data types: activity data and spend data.
- Activity data includes direct measurements reflecting the physical amount of an emitting source, such as fuel consumption (in liters or gallons) or travel distance (in kilometers or miles). It accurately represents emissions from a particular operational emission source and allows for measurable decarbonization strategies.
- Spend data serves as an alternative when activity data is unavailable. It estimates emissions based on financial expenditures related to goods, services, or travel. While less precise, it is useful for approximating scope 3 emissions, where direct measurement is often challenging.
Tips for Accurate Data Collection
Effective carbon accounting relies on seamless collaboration across departments, suppliers, and external data sources. Key strategies include:
- Stakeholder engagement: Finance, operations, procurement, and sustainability teams must coordinate to track and validate emissions data. Engaging suppliers is essential for capturing and reducing scope 3 emissions.
- Addressing data gaps: When data is unavailable, proxy data can be used to estimate emissions, but it should be a temporary solution while organizations work toward obtaining accurate, real-world data.
- Standardization and verification: Implementing consistent methodologies and third-party audits enhances the credibility of carbon reporting, building stakeholder trust.
By leveraging precise data, understanding emission scopes, and adopting structured data collection methods, organizations can create a transparent, science-based approach to carbon accounting and lay the foundation for meaningful climate action.
Climate Standards Businesses Need to Know
Global standards and regulations define carbon accounting methodologies by establishing guidelines for how organizations set boundaries, measure, and disclose emissions. Several key frameworks and policies guide both the international and regulatory levels.
Guidance frameworks
GHG Protocol: The Foundation of Carbon Accounting
- The GHG Protocol is the most widely adopted framework for measuring and managing emissions across organizations globally.
- Developed by the World Resources Institute (WRI) and the World Business Council for Sustainable Development (WBCSD), it provides common standards for businesses, governments, and supply chains.
- Sector-specific guidance has been developed for industries such as energy, finance, manufacturing, and agriculture, which face stricter reporting requirements than service-based sectors.
- The GHG Protocol is currently undergoing its first major revision since its launch. Partnering with the International Organization for Standardization (ISO) to co-develop a consolidated corporate standard that merges the Corporate Standard, Scope 2 Guidance, Scope 3 Standard, and Actions and Market Instruments standard with ISO 14064-1. As of mid-2026, the effort is in active technical development, with a draft opening for public consultation targeted for mid-2027 and a final published standard expected by the end of 2028. Current standards stay in effect until that replacement is finalized, so nothing changes for reporting yet.
ISO 14064: Standardized Emissions Quantification and Reporting
- The ISO 14064 series, created by the International Organization for Standardization (ISO), offers detailed methodologies for greenhouse gas accounting.
- It includes guidelines for organization-level emissions quantification, reporting, and reduction projects.
- ISO 14064 serves as the foundation for independent verification and compliance with voluntary carbon markets, enhancing the credibility of emissions reduction projects.
Policies
EU CSRD: Expanding Mandatory Climate Disclosure
- The Corporate Sustainability Reporting Directive (CSRD) enforces detailed sustainability reporting requirements for companies operating in the EU.
- Following the EU's 2025 to 2026 Omnibus simplification package, CSRD's scope narrowed sharply. It now applies to roughly 5,000 large companies, with new thresholds of more than 1,000 employees and more than 450 million euros in net turnover (up from the original 250 employees and 50 million euros)
- In scope companies must still report scope 1, 2, and 3 emissions data aligned with the EU Taxonomy and European Sustainability Reporting Standards (ESRS).
California SB 253: State-Level Mandatory Emissions Disclosures
- California’s SB 253 Climate Corporate Data Accountability Act sets strict emissions reporting mandates within the US.
- It applies to companies with over US$1 billion in revenue doing business in California, requiring scope 1 and 2 emissions reporting by November 2026..
- CARB has said scope 3 reporting and third-party assurance requirements will be addressed in a subsequent rulemaking covering 2027 and beyond.
EU CBAM: Preventing Carbon Leakage and Promoting Decarbonization
- The Carbon Border Adjustment Mechanism Requirements (CBAM) requires importers of specific carbon-intensive goods to disclose embedded emissions to prevent carbon leakage and promote global decarbonization by ensuring that domestic and foreign producers face comparable carbon costs.
- During the transitional phase (2023–2025), importers were required to submit quarterly reports on embedded emissions.
- As of 2026, they must purchase CBAM certificates to compensate for the carbon footprint of imported goods.
Although carbon accounting requirements vary across regions and industries, they are all fundamentally rooted in the principles established by the GHG Protocol and ISO 14064. As global regulations like the EU CSRD and state-level legislation evolve, organizations must proactively align with these stricter standards to mitigate regulatory risks and support compliance with emerging sustainability expectations.
What Are the Industry-Specific Challenges of Carbon Accounting?
Carbon accounting presents unique challenges across industries due to varying operational structures, emissions sources, and reporting requirements. While the challenges outlined below focus on financial services, data centers, and philanthropies, similar complexities exist across manufacturing, transportation, healthcare, and other sectors. Tailored strategies are essential to effectively addressing these complexities.
Data Centers: Measuring and Reducing Scope 2 and 3 Emissions
Data center operators consume vast amounts of electricity making scope 2 emissions a major concern. In addition, data center developers and owners face significant scope 3 emissions from embodied carbon from the building materials and the IT hardware required to develop these assets. Effective strategies to reduce data center emissions include:
- Optimizing computing needs and power usage: Use real-time metering and AI-powered analytics to optimize electricity usage across time and locations.
- Procuring low-carbon electricity: Secure long-term access to compliant low-carbon electricity through power purchase agreements (PPAs) or high-impact renewable energy credits (RECs).
- Tracking life cycle emissions: To provide a comprehensive emissions assessment, account for embodied carbon in server manufacturing and end-of-life disposal.
Financial Services: Assessing Emissions From Investments and Portfolios
Financial institutions face significant challenges in evaluating scope 3 financed emissions from investments, loans, and asset portfolios. Key strategies to address these challenges include:
- Adopting industry standards: Frameworks like the Partnership for Carbon Accounting Financials (PCAF) can be used to standardize emissions calculations.
- Understanding asset level data: To accurately report on financed emissions, investors need visibility of emissions data, ideally at the company level.
- Prioritizing green investment strategies: Shift toward sustainable finance by integrating sustainability criteria and emphasizing green bonds or low-carbon funds or investments.
- Ensuring regulatory compliance: To enhance transparency, align with global disclosure frameworks like the International Sustainability Standards Board's (ISSB) IFRS S2 climate-related disclosure standard.
Philanthropies: Managing Emissions From Private Financing
Philanthropic organizations face challenges in tracking emissions across diverse funding activities, operational footprints, and investment portfolios. Effective strategies include:
- Assessing grantmaking impact: Many philanthropies support climate initiatives but may not track the carbon impact of grantees or funded projects. Establishing emissions metrics for grants can enhance transparency and effectiveness.
- Measuring operational emissions: While some philanthropies have relatively low direct emissions, travel, events, and office space still contribute to their carbon footprint. Implementing sustainable operations policies can help reduce emissions.
- Decarbonizing investment portfolios: Endowments and investment funds often hold assets with varying GHG emissions. Aligning investments with sustainability goals and engaging with asset managers on emissions reduction can drive impact.
Organizations across these sectors can enhance emissions transparency, improve sustainability efforts, and align with global climate goals by implementing industry-specific carbon accounting methods.
Navigating Evolving Standards and Scope 2 Complexity
Carbon accounting standards are actively evolving. In October 2025, the GHG Protocol released two proposals for scope 2 accounting revisions, with final standards expected by 2027. The proposals shift toward hourly and regional renewable energy matching, moving away from today's annual, region-agnostic approach. They also introduce consequential methodology that calculates actual emissions displaced by renewable projects, which varies significantly by region.
For organizations with 2030 climate targets, timing matters. Existing long-term contracts are expected to be grandfathered in under new rules. Meanwhile, new renewable projects face interconnection delays of 3 to 5 years, and the US power grid is experiencing sustained demand growth driven largely by data centers. These pressures converge: power demand is rising while new clean electricity supply is constrained.
Navigating these changes requires understanding emerging methodologies and their strategic implications. See our companion pieces on Navigating Scope 2 Accounting Changes and Scope 2 Emissions Explained for detailed context.
Frequently Asked Questions
How long does carbon accounting implementation take?
Initial measurement typically takes 3 to 6 months, depending on data availability and organizational coordination. Starting with data you already have (utility bills, fuel records) accelerates the process. Scope 2 and scope 3 require more extensive work than scope 1, so actual timelines vary based on which scopes are your focus.
What are the biggest obstacles to getting accurate emissions data?
Data siloes across departments (finance, operations, procurement track separately). For scope 2, grid-average factors mask location- and time-specific variations that actually drive emissions. For scope 3, extensive data collection and supplier coordination are required. Seamless collaboration across departments is essential.
Do we need to measure all three scopes to start?
Yes. Organizations should measure all three scopes. Start where your business is most materially affected, but eventually measure all three for compliance and complete visibility into your emissions sources.
Inside NERC’s Level 3 Alert on Data Center Loads
Key Takeaways
- On May 4, 2026, the North American Electric Reliability Corporation (NERC) issued a rare Level 3 “Essential Actions” Alert in response to repeated events in which 1,000+ megawatts (MW) of computation load dropped off the bulk power system in seconds, leading to major grid stability issues.
- The pattern has since escalated: on July 22, 2026, a transmission fault in Ashburn, Virginia took more than 3 GW of data center load offline in seconds—roughly 3% of PJM demand at the time.
- NERC also published Reliability Guidelines that push the same concerns into long-term planning, explicitly recommending resource adequacy models that capture firm vs. flexible load, behind-the-meter resources, and AI training operating windows.
- For transmission operators and balancing authorities, the releases compel new scrutiny of how computational loads affect stability and resource adequacy. For hyperscalers and other large loads, those assessments now sit on the critical path: if operators cannot show through advanced modeling that they can integrate the new loads, interconnection and buildout plans stall.
- Meeting the bar takes advanced grid modeling at multiple time and spatial scales, from sub-second stability through long-horizon capacity and resource adequacy, to evaluate the role of large load portfolios considering demand response, storage, and co-located generation.
Why Grid Frequency Matters for Large Loads
When we turn on the lights or charge our phones, it’s easy to forget that electricity travels through the power grid as alternating current. Sixty times a second—far faster than our eyes can see—the flow of electricity alternates back and forth along the wires making up both the transmission and distribution parts of the North American grid.
Power generation equipment and most large industrial loads are designed to work with this 60 Hertz (Hz) alternating flow and must be synchronized precisely to this rhythm to function. Grid synchronization is so important that it can even have geopolitical implications.
For some electrical equipment, getting out of sync with the grid’s frequency can lead to malfunctions or even physical damage and destruction. That’s why grid-connected equipment is protected by circuits that automatically disconnect from the grid (“trip offline”) if the grid frequency begins to deviate by even one percent. For minor equipment, this is easily managed. However, when large amounts of generation or load trip offline quickly, it can lead to rapidly cascading grid blackouts affecting tens of millions of people with costs in the billions.
Grid operators pay extremely careful attention to factors that could cause grid frequency to deviate. The grid’s frequency stays near 60 Hz only when total power generation and consumption (load) are closely balanced. If load suddenly drops below generation, physical rotating generators like gas turbines can begin to speed up, making grid frequency rise.
This becomes particularly dangerous when large grid-connected loads all trip offline simultaneously because of minor frequency deviations or other factors. If these loads are large enough, they can trigger a cascading sequence of rising frequency and further equipment and generator trips, potentially causing a complete “grid collapse” blackout. The North American grid may be getting closer to this scenario.
What Triggered NERC’s Highest-Urgency Alert
Data center load drops are now a documented grid stability threat. On May 4, 2026, NERC issued a rare Level 3 “Essential Actions” Alert—its highest-urgency notification—in response to a pattern of customer-initiated load reductions in which 1,000+ MW of computational load (data centers) dropped off the bulk power system (tripped offline) in seconds. These were “customer-initiated” because protection circuits at data centers detected problems with grid-supplied power and automatically disconnected to protect their sensitive computing equipment from electrical damage.
Paired with a new Reliability Guideline on emerging large loads, the alert highlights the urgent need to better understand the potential for these events to cause grid instability or even blackouts. Together, these two documents reset the bar for the detailed grid modeling and planning needed for any utility, independent system operator (ISO), or hyperscaler with material data-center growth in its footprint.
Customer-Initiated Load Reductions
A customer-initiated load reduction (CILR) is an event in which a large load, most often a data center, AI training facility, or crypto miner, abruptly and without warning reduces or disconnects its electricity draw from the grid in response to a frequency or voltage disturbance that the grid’s internal protection circuits interpret as unsafe.
Compute-based loads like AI data centers are particularly sensitive to changes in the expected voltage and frequency from grid-supplied power, and their automated electrical protection systems tend to react more quickly and at smaller deviations than conventional industrial, commercial, and residential loads.
NERC has documented multiple events of 1,000+ MW since 2022, with reductions occurring in seconds, much faster than real-time operators can respond. This makes these events a significant risk to grid frequency stability that is distinct from more traditional load loss events that occur at a smaller scale or over slower timescales, allowing grid operators to take action to compensate.
How the Alert Reshapes Grid Interconnection
For utilities and ISOs, the alert and guideline raise the standard of evidence required to connect computational loads safely to the grid. Modeling assessments now sit on the critical path for large load interconnection decisions, and the same studies will increasingly inform reserve margin, transmission, and dispatch program designs.
For hyperscalers and other large loads, the consequence is direct. Plans that assume firm service without supporting analysis will face longer queues and tougher interconnection conditions. Buildout timelines now depend on whether utilities and ISOs can show, through stability and resource adequacy modeling, that the system can absorb the load and respond safely to its disturbances.
For storage developers, particularly long-duration and fast-responding assets, these events elevate the reliability value of rapid response and load-shifting resources. The same grid modeling improvements that capture flexible load behavior also surface storage's full reliability contribution.
For flexibility platforms, the same modeling work that satisfies NERC's expectations unlocks faster, cheaper interconnection. Demand response, large-load shifting, and co-located dispatch coordination are now both technical and commercial enablers.
A Higher Bar for Power Analysis
These pressures point to a higher bar for power analysis at multiple time and spatial scales, for utilities and the large loads they serve.
At sub-second to second timescales, electromagnetic transient (EMT) models capture fast electrical switching and the uninterruptible power supply behavior that determines whether a data center stays connected during a disturbance (“rides through”). The alert asks for these models to be more detailed, validated against actual equipment, and shared between large loads, transmission owners, and planners.
At seconds-to-minutes, dynamic stability simulation covers system frequency response, voltage recovery, and oscillation behavior after disturbances. NERC now expects annual stability studies and explicit load drop contingencies in planning files.
At hours-to-years, capacity expansion and production cost modeling determine whether the system has enough resources, in the right places, with the right flexibility, to keep up with computational load growth. NERC’s May 2026 Large Loads Reliability Guideline is most explicit at this scale, calling for resource adequacy studies that represent firm and flexible load components, behind-the-meter resources, AI training operating windows, and probabilistic scenarios across many weather, load, and outage combinations on a network-aware footprint.
Rising to the Challenge
Since the alert was issued, its expectations have begun hardening into rules. Registered entities were required to report to NERC on their progress against the seven Essential Actions by August 3, 2026, and on July 16, 2026, FERC directed NERC to go further: to develop mandatory reliability standards for computational loads and revise its registration criteria, with the first standards and Rules of Procedure changes due December 31, 2026 and a second-phase work plan due March 1, 2027. NERC's Large Loads Action Plan anticipates new "Computational Load Owner" and "Computational Load Operator" registered entity types alongside the first three computational load standards.
The practical consequence is that the modeling described above is no longer only good planning practice: utilities, ISOs, hyperscalers, and other large loads should expect the data-sharing, study, and commissioning expectations in the alert to return as auditable requirements, and should build the capability before the compliance deadline rather than after it.
Frequently Asked Questions
What is a NERC Level 3 Alert, and what does it require?
A Level 3 “Essential Actions” Alert is the most urgent of NERC's three alert levels, reserved for risks that need immediate, documented industry response. The May 4, 2026 alert directed registered entities to take seven essential actions on computational load—covering modeling, system studies, commissioning, protection, fault recording, and direct operational communication with large load operators. Written responses were due to NERC by August 3, 2026.
Why do data centers disconnect from the grid during minor disturbances?
Data centers run voltage- and frequency-sensitive computing equipment protected by automatic transfer systems that switch to on-site UPS or backup generation the moment grid power looks abnormal. Those protection settings trip faster, and at smaller deviations, than conventional industrial loads, so a fault lasting milliseconds can move a gigawatt of demand off the system in seconds. Because the shift is customer-initiated, grid operators get no warning and no time to rebalance.
How does the alert change interconnection for hyperscalers and other large loads?
Modeling assessments now sit on the critical path for large load interconnection. A plan that assumes firm service without stability and resource adequacy analysis behind it will face longer queues and tougher interconnection conditions, because the utility or ISO has to be able to show the system can absorb the load and respond safely to its disturbances. In practice, buildout timelines are now tied to someone else's study queue.
What modeling do utilities and large loads need to meet NERC's expectations?
Electromagnetic transient (EMT) models validated against actual equipment for sub-second ride-through behavior; dynamic stability simulation with explicit load-drop contingencies for seconds-to-minutes frequency and voltage response; and capacity expansion and probabilistic resource adequacy modeling that separates firm from flexible load, represents behind-the-meter resources, and reflects AI training operating windows. The paired Reliability Guideline is most explicit about the last of these.
Who Pays for AI? The Hidden Cost of Rising Data Center Demand
Key Takeaways
- AI data centers are driving the fastest electricity demand growth in decades: US data centers consume an estimated 4 to 5% of US electricity today, projected to reach as much as 9 to 17% by 2030 (EPRI).
- Without deliberate cost allocation, residential and small-business ratepayers subsidize private AI infrastructure.
- Peer-reviewed modeling projects data center growth could raise US power costs 6 to 29% nationally by 2030, and up to 57% in the hardest-hit regions.
- Utility commissioners, state regulators, and policymakers now have working models to draw from, including large-load tariffs, dedicated rate classes, and direct assignment of transmission costs.
AI Data Center Energy Demand Is Testing the Limits of the Grid
AI is driving electricity demand at a pace the US grid has not seen in decades. US data centers already consume an estimated 4 to 5% of the nation's electricity, and EPRI projects that share could reach 9 to 17% by 2030. Behind nearly every AI model and digital product is the invisible infrastructure that powers it: data centers. These facilities are resource-intensive, requiring massive amounts of electricity to power servers, substantial water for cooling, and extensive new grid infrastructure.
In the race to decarbonize the grid, data centers are emerging as a critical pressure point. This infrastructure sits at the intersection of digital growth and climate action, forcing a difficult question: who pays to power AI?
Legacy Utility Models Weren’t Built for this Growth
Utilities must upgrade aging grid infrastructure to meet this new surge in electricity demand, while maintaining reliability. Under legacy utility frameworks, it's often ratepayers who foot the bill for those upgrades. And the costs are not distributed equitably.
Traditional utility planning assumes that increased demand justifies expanded investment in generation and transmission infrastructure. When a new type of large customer, like a tech company, moves into a utility’s service territory, utilities plan new infrastructure to meet that projected demand.
Utilities typically recover the cost of new infrastructure through a process called rate base cost recovery. This allows utilities to charge all customers in the “rate base” for the expenses incurred, including thousands of individuals, families, and small businesses, even when those costs stem from the demands of just a few large users.
This legacy model struggles to keep pace in the AI boom era, where massive new electricity demand can double within a few years, a scale of growth that used to take decades. Additionally, while data centers create short-term construction jobs, there are almost no lasting employment benefits for local communities.
It's clearly inequitable for all ratepayers to bear the costs of upgrading the grid to benefit just a small number of massive data centers. But that's not the only problem. If utilities decide to meet new power demand from large data centers with new fossil fuel generation, such as gas peaker plants, they risk creating stranded assets: infrastructure that becomes obsolete or uneconomical as climate targets, clean energy mandates, or the cost-effectiveness of renewables accelerates. Once built, ratepayers will have to continue paying for these long-lived investments for years, even if they are underutilized or retired early due to policy shifts. This risk is no longer hypothetical: to serve projected data center load, Georgia regulators approved a plan to extend the lives of two massive coal plants to as late as 2038, and Virginia regulators stripped roughly $350 million tied to speculative early-stage data center projects out of Dominion Energy's revenue forecast.
If utilities are locking in decades of new fossil fuel generation to meet short-term data center growth, ratepayers may be left holding the bag for infrastructure that contradicts their climate goals and state mandates, with little ratepayer or community input into the decision. Effectively, local communities may be subsidizing a technology that they did not directly ask for in the first place and has little to no direct community benefits. The result is a long-term misalignment between utility investment strategy and the public interest.
Ratepayers Bear the Cost of Private AI Expansion
The economic burden of data center expansion can fall disproportionately on households and small businesses. But data centers, as the largest and fastest-growing users, often negotiate bespoke contracts, subsidized rates, or fixed-price electricity agreements that shield them from long-term cost volatility.
This can result in other customers, especially residential and low-income ratepayers, bearing a disproportionate share of the infrastructure and maintenance costs. In many states, residential and low-income customers already experience energy cost burdens that exceed affordability thresholds. Adding the weight of infrastructure investments to serve energy-intensive data centers, without sharing those costs equitably, exacerbates an already regressive utility cost allocation system.
Georgia shows how these costs reach ratepayers even when regulators act. Georgia Power customers absorbed six rate increases totaling roughly $43 per month between 2023 and 2025, and while regulators approved a base-rate freeze through 2028, the freeze excluded fuel and storm costs. In 2026 fuel-cost proceedings, testimony showed that large industrial and data center customers raise other customers' monthly fuel costs by 5 to 11%, prompting the Georgia Public Service Commission to open an investigation into how fuel costs are allocated between large loads and residential customers. Ratepayers noticed: in November 2025, both Georgia PSC seats flipped in elections run explicitly on utility bills and data center cost-shifting. In Virginia, regulators approved a rate increase of roughly $16 per month for typical Dominion Energy residential customers amid surging data center demand.
These examples are not anomalies. A peer-reviewed study in Environmental Research Letters projects that data center growth could raise US power costs 6 to 29% nationally by 2030, and up to 57% in the hardest-hit regions, with Virginia among the steepest. This is a systemic shift in energy demand, one that places a growing burden on communities and lacks clear public benefits.
Environmental and Community Impacts Are Mounting
Beyond economic impacts, the geography of data center development reveals another layer of inequity: environmental justice. Data center siting often prioritizes affordable land, low resource costs (e.g., electricity, water), and climate considerations like heat variability. They also rely on proximity to pre-existing fossil fuel generation and transmission infrastructure. Research now confirms the pattern this creates: an analysis of 550 EPA-regulated data centers found that air pollution burdens near data centers rise with the share of people of color living nearby, and a 2026 Washington state study found more than half the state's data centers sit in census tracts with the highest concentrations of people of color.
These communities often absorb the negative externalities beyond their electricity bills, including increased air pollution from peaker plants and on-site diesel or gas backup generators, traffic and construction noise, water stress, and land use changes. Simultaneously, they do not receive direct net positive benefits. Frontline communities are paying attention to this trend, and opposition has become a defining force in where AI infrastructure gets built. Gallup finds 71% of Americans now oppose a data center in their own area, and Data Center Watch counted roughly $130 billion in projects blocked or delayed in the first quarter of 2026 alone. The stakes of community opposition are increasing and intensifying.
The consequences of ignoring communities are now playing out in federal court. At xAI's Colossus facility in Memphis, developers operated dozens of on-site gas turbines without air permits in a majority-Black area already burdened by industrial pollution. After the Shelby County Health Department granted permits for a subset of turbines in July 2025, the fight moved to xAI's second campus across the state line: in April 2026, the NAACP filed a Clean Air Act lawsuit over roughly 27 unpermitted gas turbines at the Colossus 2 site in Southaven, Mississippi, seeking penalties of more than $100,000 per day. On-site power can help reduce demand on the grid, which can be a benefit. But when that generation runs without permits or oversight, nearby communities bear unmeasured health and environmental impacts from hazardous emissions, and the litigation now underway shows how quickly unpermitted power becomes a legal and reputational liability.
To date, data center developers do not appear to have maximized potential community benefits or engagement. Data centers have not typically employed many local residents beyond construction phases, resulting in limited economic benefits, particularly when facility ownership is distant from the local community or has few local ties. When these same communities already experience high pollution burden or economic precarity, the cumulative impact of a new data center can deepen existing vulnerabilities.
Water use is also a mounting environmental justice concern. Many data centers rely on evaporative cooling systems that draw millions of gallons of water per day, and peer-reviewed research finds significant gaps in how the industry discloses its water footprint. In drought-prone regions, this can stress already-depleted aquifers and heighten tensions over water access.
The result is a high-stakes tradeoff between digital infrastructure and local resource resilience, one that communities should be a part of deciding.
States and Regulators Are Writing the New Rules
Virginia, the "Data Center Capital of the World," is home to 674 data centers that consume an estimated 25% of the state's electricity, a share EPRI projects could reach 39 to 57% by 2030, the highest of any state. After legislators considered but did not pass data center bills in the 2025 session, the 2026 General Assembly passed roughly 15 data center bills, including legislation, signed in May 2026, directing regulators to ensure data center costs are not subsidized by other customers, along with new requirements for site impact assessments and water-use reporting. Virginia's State Corporation Commission had already created a dedicated rate class for high energy use customers, with 14-year contract terms and minimum charges that apply whether or not the projected load materializes, and in August 2026 it went further, ordering Dominion to develop a tariff that directly assigns transmission costs to the data centers that trigger them.
Virginia is not alone. Ohio regulators approved a landmark tariff requiring large data centers to pay for 85% of the capacity they request, whether or not they use it. Oregon's POWER Act created the nation's first legislated rate class for data centers. Texas gave its grid operator authority to curtail large loads during emergencies. Minnesota, California, Alabama, Tennessee, South Dakota, Nebraska, and Florida have all enacted their own ratepayer-protection measures, and at the federal level, FERC ordered the nation's largest grid operator to write new rules for data centers that co-locate with power plants, citing the need for consumer protection and clear cost allocation. State energy officials are also proactively planning for data center expansion.
The direction is clear. The unresolved question is whether these reforms move faster than the costs already flowing to ratepayers.
What Is the Public Good of Data Centers?
AI infrastructure powers innovation, job creation, research, and the technologies we rely on every day. But it may also bring inequitable social and direct financial costs. Like highways, factories, and pipelines before them, the question remains: What is the public good of AI data centers? How should we hold data center developers accountable to the public interest, which values a clean energy future? We need clear-eyed assessments of how data centers impact energy affordability, climate progress, and environmental equity.
Yesterday's utility policy frameworks were not designed for hyperscale AI data centers. The reforms now underway are a start, but without sustained attention they may still force the public to subsidize private expansion, through economic and environmental costs, often without equitable community engagement, climate accountability, or local benefit.
AI Data Center Growth Needs Accountability, Equity, and Reform
To align data center growth with the public interest, the stakeholders involved now have proven models to build on:
- Utilities and regulators can require large customers to pay an equitable share of new infrastructure costs, as Ohio's minimum-take tariff and Virginia's dedicated rate class now do.
- Public Utility Commissions can mandate equity and community impact assessments during siting and permitting, following Virginia's new site assessment requirements.
- States can condition tax incentives and zoning approvals on local hiring, emissions reductions, and community benefits agreements.
- Data center developers can prioritize clean power and commit to transparent, equitable community engagement and benefits plans before opposition, litigation, and cancellations decide the outcome for them.
As we build the digital backbone of the next century, we must avoid repeating injustices of the past. A just energy transition requires more than megawatts: it demands equity, policy interventions, and real climate progress.
[cta]
Frequently Asked Questions
How do utilities typically recover the cost of infrastructure built to serve large data center customers, and why does this burden fall on other ratepayers?
Utilities recover infrastructure investments through rate base cost recovery: regulators approve new generation, transmission, and distribution spending, and the costs are spread across all customers in the rate base through their monthly bills. That model worked when demand growth was gradual and diffuse, but when a single data center campus drives hundreds of megawatts of new investment, standard cost allocation spreads those costs across households and small businesses unless regulators adopt a special tariff or rate class that assigns them to the customer who caused them.
What are stranded assets in the context of data center power demand, and how do they create long-term risk for utilities and ratepayers?
Stranded assets are long-lived infrastructure investments, like new gas plants built for projected data center load, that become underused or uneconomical before they are paid off, whether because demand never materializes or because policy and market shifts overtake them. Because utilities recover those costs through rates over decades, ratepayers keep paying even if the asset sits idle. The risk is acute today because data center demand forecasts are highly uncertain: Virginia regulators removed roughly $350 million tied to speculative data center projects from one utility's revenue forecast in 2025.
Why do data centers often locate in rural or low-income communities, and what are the environmental justice implications?
Data center siting favors cheap land, fast permitting, low-cost power and water, and proximity to existing generation and transmission, conditions most common in rural, low-income, and historically marginalized communities. Research confirms the consequences: analysis of 550 EPA-regulated data centers found air pollution burdens rise with the share of people of color living nearby. These communities absorb the air pollution, water stress, noise, and land use impacts while receiving few lasting jobs or direct benefits.
What regulatory or policy tools can states and Public Utility Commissions use to ensure data center growth doesn't unfairly shift costs to residential and small-business ratepayers?
The toolkit has expanded rapidly since 2025. Commissions can create dedicated large-load rate classes and tariffs with minimum take-or-pay provisions, long contract terms, collateral requirements, and exit fees, as Ohio and Virginia have done; directly assign infrastructure enhancement costs to the customers that trigger them; and require site impact assessments during permitting. Legislatures can codify ratepayer protections, require water and load-forecast transparency, and condition tax incentives on community benefits, models now in place in at least eight states.
This commentary reflects public policy analysis and opinion, not legal advice or regulatory determinations.
From Capture-Ready to Capture-Committed: Decarbonizing Natural Gas with CCS
Key Takeaways
- Data centers are driving surging demand for new, firm electricity supply, accelerating natural gas-fired power generation.
- Carbon capture and storage (CCS) offers a practical way to balance long-term climate commitments with the need for new electricity generation in the near term.
- New natural gas-fired power plants must be capture-committed, not just capture-ready, potentially delivering power in 18 months and decarbonized power 18-24 months later.
- Capture-committed plants integrate planning and finance for the CO₂ capture, transport, and storage value chain from the start.
- Relae believes early investment in engineering, infrastructure, and community engagement is essential to meet capture commitments.
A New Era of Electricity Demand and Climate Pressure
The US and much of the developed world are experiencing profound growth in electricity demand. Two main forces are driving this trend: (1) the push to electrify existing uses, such as vehicles and heating, to improve energy security, enhance system efficiency, and reduce air pollution; and (2) the growth of energy-intensive sectors like manufacturing, telecommunications, and AI data centers.
Among these drivers, AI is creating unique demands that catalyze specific investments in electric power generation. Astonishing AI data center buildout, led by a handful of large technology firms (sometimes called “hyperscalers”) and their utility and construction partners, is accelerating energy consumption. These firms prioritize speed. When asked for their top five criteria for bringing new AI infrastructure online, one executive responded: “Speed, speed, speed, cost, and carbon emissions.”
Data centers require reliable, always-on power (referred to as “firm power”). This differs from other use cases, such as residential or commercial, which do not need the same amount of power across all hours. While hyperscalers and their partners are investing in renewables, nuclear, and geothermal energy at a remarkable pace, renewable resources alone do not yet meet the exploding demand for firm power.
Natural Gas Provides Firm Power but Drives Emissions Higher
The mismatch between data center power needs and variable renewable generation is fueling a boom in natural gas-fired power generation. The pipeline of new natural gas-fired power plants is enormous. Plants under construction in 2025 would, by themselves, add roughly 25 million tonnes of greenhouse gases each year to the air and oceans. The full suite of plants in planning is at least 10 times larger. Existing gas plants are also being used more and staying online longer.
.png)
This rapid buildout is creating tension with corporate climate goals. Hyperscalers remain seriously committed to reducing emissions, but their ability to hit those targets is undermined by the need to procure new, large-scale electricity generation quickly.
Carbon Capture Aligns with Data Center Energy Demands
Carbon capture and storage is one way to bridge the gap. Data centers operate continuously and may have the ability to shift or curtail load. This demand profile suits the duty cycles of natural gas turbines and CCS facilities well. The potential to reduce direct emissions is profound: today’s CCS technology can capture 95% or more of CO₂ emissions at competitive costs in many markets.
This has led to a resurging interest in the concept of capture-ready gas power generation. New natural gas power plants can be built and brought online in 18 months. In a capture-ready plant, the developers integrate the necessary interfaces and reserve additional land, water, and energy to enable a carbon capture project to be built at a future date. In favorable locations, carbon capture can be added to a capture-ready plant in 18-24 months.
However, past experience shows that capture-ready plants rarely deliver. The ambition and commitment of the developers were contingent on policy and market signals that were either too small or never materialized. While the base plant may have made economic sense in terms of energy value for investment, it does not appear anyone was willing to pay the climate premium for CCS.
As David Hawkins of the Natural Resource Defense Council famously said, “If your plant is capture ready, my driveway is Ferrari ready.” To bring David’s humorous analogy back to the specifics here: don’t build a new driveway without at least a downpayment on the car.
How to Build Capture-Committed Power Plants for CCS
A better approach is building capture-committed plants, namely facilities that integrate CCS from the start. To be capture-committed, project developers must:
- Identify geologic storage for the many millions of metric tons of CO2 that these plants will produce each year over the next 20-30 years.
- Plan reliable CO₂ transportation from power generation to geologic storage by pipeline, rail, barge, or truck.
- Engage credible vendors of carbon capture technology that serve their needs and fit their goals.
- Fund front-end engineering design (FEED) studies.
- Arrange, or help to arrange, financing for the construction, commissioning, and operation of all necessary components in the CO₂ capture, transportation, and storage value chain.
- Ensure natural gas supply has near-zero fugitive methane emissions.
- Partner with local and frontline stakeholders to incorporate community impact into project planning, design, and financing.
Capture-committed plants send strong market signals. They help build the permitting pathways and develop the workforce, infrastructure, and community acceptance needed to avoid extra expense and delays. Done well, early commitments and investments will likely create repeatable models that reduce build times and costs.
A Path Toward Power That’s Clean Firm and Future-Ready
Eventually more carbon-free power in the form of renewables, nuclear, and geothermal energy will be deployed to serve national and international electric load growth for all types of electrification. Over time, these resources will likely displace natural gas. Until then, hundreds of millions of tons of CO₂ will be emitted each year unless commitments are made to take tangible action now.
Capture-committed natural gas-fired plants offer a pragmatic solution. With the right planning, financing, and community engagement, they can provide reliable power without locking in emissions, and they can deliver enormous benefits compared to uncontrolled operation. Federal and state governments can accelerate this transition by honoring and increasing CCS grants, supporting shared infrastructure, and streamlining permitting for CCS plants as they have for other clean energy supplies. These investments will enable the construction of cleaner, more resilient power infrastructure for the industries driving demand, from AI data centers to heavy industry.
[cta]
Frequently Asked Questions
What is the difference between a capture-ready and a capture-committed power plant?
A capture-ready plant creates an option to add carbon capture in the future, whereas a capture-committed plant treats capture as part of the project from day one. In a capture-ready plant, developers install the right interfaces and reserve extra land, water, and energy, but nothing obligates them to build the capture project, ever. A capture-committed developer secures options for CO₂ transportation and geologic storage, relationships with capture equipment vendors, funding for engineering studies, and financing across the full value chain before the base plant comes online.
Why have capture-ready plants historically failed to add carbon capture?
Nobody was willing to pay the climate premium. Capture-ready developers built plants that made economic sense on energy value alone, then waited for policy and market signals to justify carbon capture. Those signals were either too weak or never arrived, so the option went unexercised and no capture project was ever designed. The base plant runs uncontrolled for decades while the reserved land sits empty. David Hawkins of the Natural Resources Defense Council captured the problem well: "If your plant is capture ready, my driveway is Ferrari ready." Preserving an option costs very little. Exercising it costs a great deal, and capture-ready facilities rarely came with the funding to do so.
If renewables, nuclear, and geothermal will eventually displace gas, why invest in CCS for gas plants now?
Because greenhouse gas emissions happen in the meantime. Gas plants being built today will operate for 20 to 30 years, long before carbon-free resources scale enough to displace them. Left uncontrolled, they will emit hundreds of millions of tons of CO₂ over that span. Capture on those plants avoids most of it. Today's technology can capture 95% or more of CO₂ emissions at competitive costs in many markets.
What can federal and state governments do to accelerate capture-committed projects?
Three kinds of support matter most: funding, infrastructure, and permitting. Governments should honor and extend existing CCS incentives. Developers make capture commitments years before any revenue arrives, so uncertainty in government funding undermines the confidence these projects require. Governments should also support shared CO₂ transport and storage infrastructure. Common pipelines, rail terminals, and storage hubs make it easier for developers to secure physical CO2 offtake. Finally, permitting for CCS should be streamlined the way it has been for other clean energy supplies. Permitting delay is a leading cause of cost overruns, and a capture-committed plant should be able to pursue capture and storage with the same intensity and speed as electricity generation.
How to Reduce Grid-Wide Emissions for Carbon Capture and Storage
Key Takeaways
- The opportunity: Clean, firm power is a strategic priority for large electricity buyers. Natural gas-fired generation equipped with carbon capture and storage (CCS) is emerging as a key tool in meeting this demand. The existing gas-fired power fleet in the US should be assessed to identify plants well-positioned for carbon capture retrofits that would benefit grid decarbonization.
- The challenge: The climate benefits of CCS-equipped natural gas plants depend entirely on how often they actually run. Adding carbon capture technology increases the cost to operate the equipment. These higher running costs can make the plant less competitive in auctions where the grid operator picks the cheapest power first. Without mechanisms to keep these plants running continuously, they may be outbid by cheaper, higher-polluting plants, causing grid-wide emissions to stay the same or even increase.
- The solution: Hyperscalers and other large energy buyers are creating a robust market for clean, firm power. By paying a "clean, firm premium" through long-term offtake agreements, these buyers can offset the higher operational costs of CCS, ensuring these plants are continuously utilized. This corporate leadership not only maximizes the grid-wide climate impact of each retrofit but also provides an important hedge against policy volatility, securing the investment case for clean innovation even when the future of subsidies like the 45Q tax credit is uncertain.
We Need Clean, Firm Power Now
The market signals for clean, firm power are clear. Meta’s nuclear energy projects and Microsoft’s Crane Clean Energy Center demonstrate growing interest in reliable, low-carbon electricity to support the rapid expansion of AI. Similar commitments by Google and Meta to advanced geothermal power also illustrate this trend.
One of the near-term options to meet this demand is natural gas with carbon capture and storage (CCS). As explored by Relae (formerly Carbon Direct), retrofitting existing gas facilities offers a path to reliable baseload power with low direct emissions, leveraging existing infrastructure to bypass the years-long delays typical of new grid interconnections.
Recent initiatives from Google and Calpine are already working to prove this concept at scale. This type of corporate leadership is driving the market; over the last decade, voluntary corporate procurement led to more than 40% of new clean energy capacity in the US. Further, recent procurement decisions illustrate that these players are willing to pay a “clean, firm premium” to secure round-the-clock, low-emissions sources of power.
Why Systems-Level Analysis Matters for CCS
While news of corporate procurements often makes headlines, recent analysis finds the number of supply contracts for natural gas power with CCS may outpace the number of secured offtake agreements. Without a power purchase agreement (PPA) to ensure competitive operation, or strong policy support, a generator may need to operate as a “merchant plant” in power markets, competing solely on cost.
A power plant’s ultimate climate impact is determined primarily by how it is positioned in the market, not just its facility-level technology.
How Power Markets Determine Which Plants Run
Understanding the potential of CCS to deliver clean, firm power and grid-wide decarbonization requires looking beyond the technology performance at a single facility. A retrofitted plant does not operate in isolation; its impact depends on how it interacts with the broader power market’s merit order.
The merit order is the ranking system in competitive power markets where the grid operator dispatches the cheapest offers first. Since carbon capture units are energy-intensive, the retrofitted natural gas plant incurs higher operating costs. This cost increase can inadvertently price the lower-emitting plant out of the market. Without mechanisms to ensure continuous utilization, the CCS plant is potentially outbid by cheaper, more carbon-intensive resources. This creates a risk of increased overall grid emissions.
To illustrate this dynamic, we’re sharing the results of our detailed grid modeling analyses of the Electric Reliability Council of Texas (ERCOT), which serves most of Texas, and the Southwest Power Pool (SPP), which covers parts of 14 states across the central US. Our analysis highlights the value of corporate “clean, firm premiums” in achieving maximum climate benefit and mitigating policy risk present in government subsidy support.
This type of systems-level grid modeling is necessary in understanding how facility-level reductions translate into real climate benefits. Support to incentivize continuous operation, such as corporate offtake agreements or the 45Q tax credit, is key to ensuring that retrofitting a gas power plant with CCS reduces overall grid emissions.
Offtake Agreements and Policy Support as Solutions
Power offtake from CCS retrofitted gas plants can meaningfully reduce system-level emissions. By directly matching electricity demand with the supply of power, large energy buyers – the offtakers – ensure the power plant is effectively utilized. This type of arrangement helps ensure any changes to reduce emissions intensity at the facility level translate into broader emissions reductions on the grid.
For these offtakers, the decision to pay a premium for clean power is driven by the goal of additionality – ensuring their procurement has a measurable, additional emissions reduction impact. Beyond physical energy, buyers secure Energy Attribute Certificates (EACs) for CCS, which serve as the verified proof of low-carbon generation required to satisfy corporate zero-emissions targets. As seen in the recent Google and Calpine agreement, these certificates allow buyers to claim the specific climate benefit of the CCS retrofit, justifying a premium over standard wholesale market rates to secure firm, clean delivery.
In the absence of offtake agreements, policy frameworks like the 45Q tax credit (up to $85 per ton of CO2 sequestered) serve a similar function by offsetting production costs.
However, access to this credit is not a guarantee and carries operational hurdles. To unlock the full credit value, facilities must meet stringent prevailing wage and apprenticeship requirements. Furthermore, the credit is limited to a 12-year window once the facility is placed in service, and requires construction to commence by 2033.
Beyond these eligibility requirements, the long-term outlook for 45Q involves inherent uncertainty. Recent regulatory shifts, including potential changes to the Greenhouse Gas Reporting Program (GHGRP), pose risks to the verification mechanisms required to substantiate captured tons.
Corporate offtake agreements offer a crucial private-sector complement to this landscape; they provide a stable revenue model independent of policy cycles, ensuring the investment case remains robust over the full life of the asset.
Understanding the Merit Order in Power Markets
Most US power plants operate in competitive deregulated markets, where grid operators dispatch generators based on their marginal cost of production – the cost of generating one additional unit of electricity. The operator ranks these offers from lowest to highest price, creating the "merit order.”
In these auctions, the cheapest resources (typically renewables and base load) are dispatched first. Progressively more expensive units (gas and peaking plants) are called upon until demand is met. The price of the final, most expensive unit required sets the market-clearing price received by all generators in that period.
The Figure below shows an example generation merit order in the ERCOT energy market.
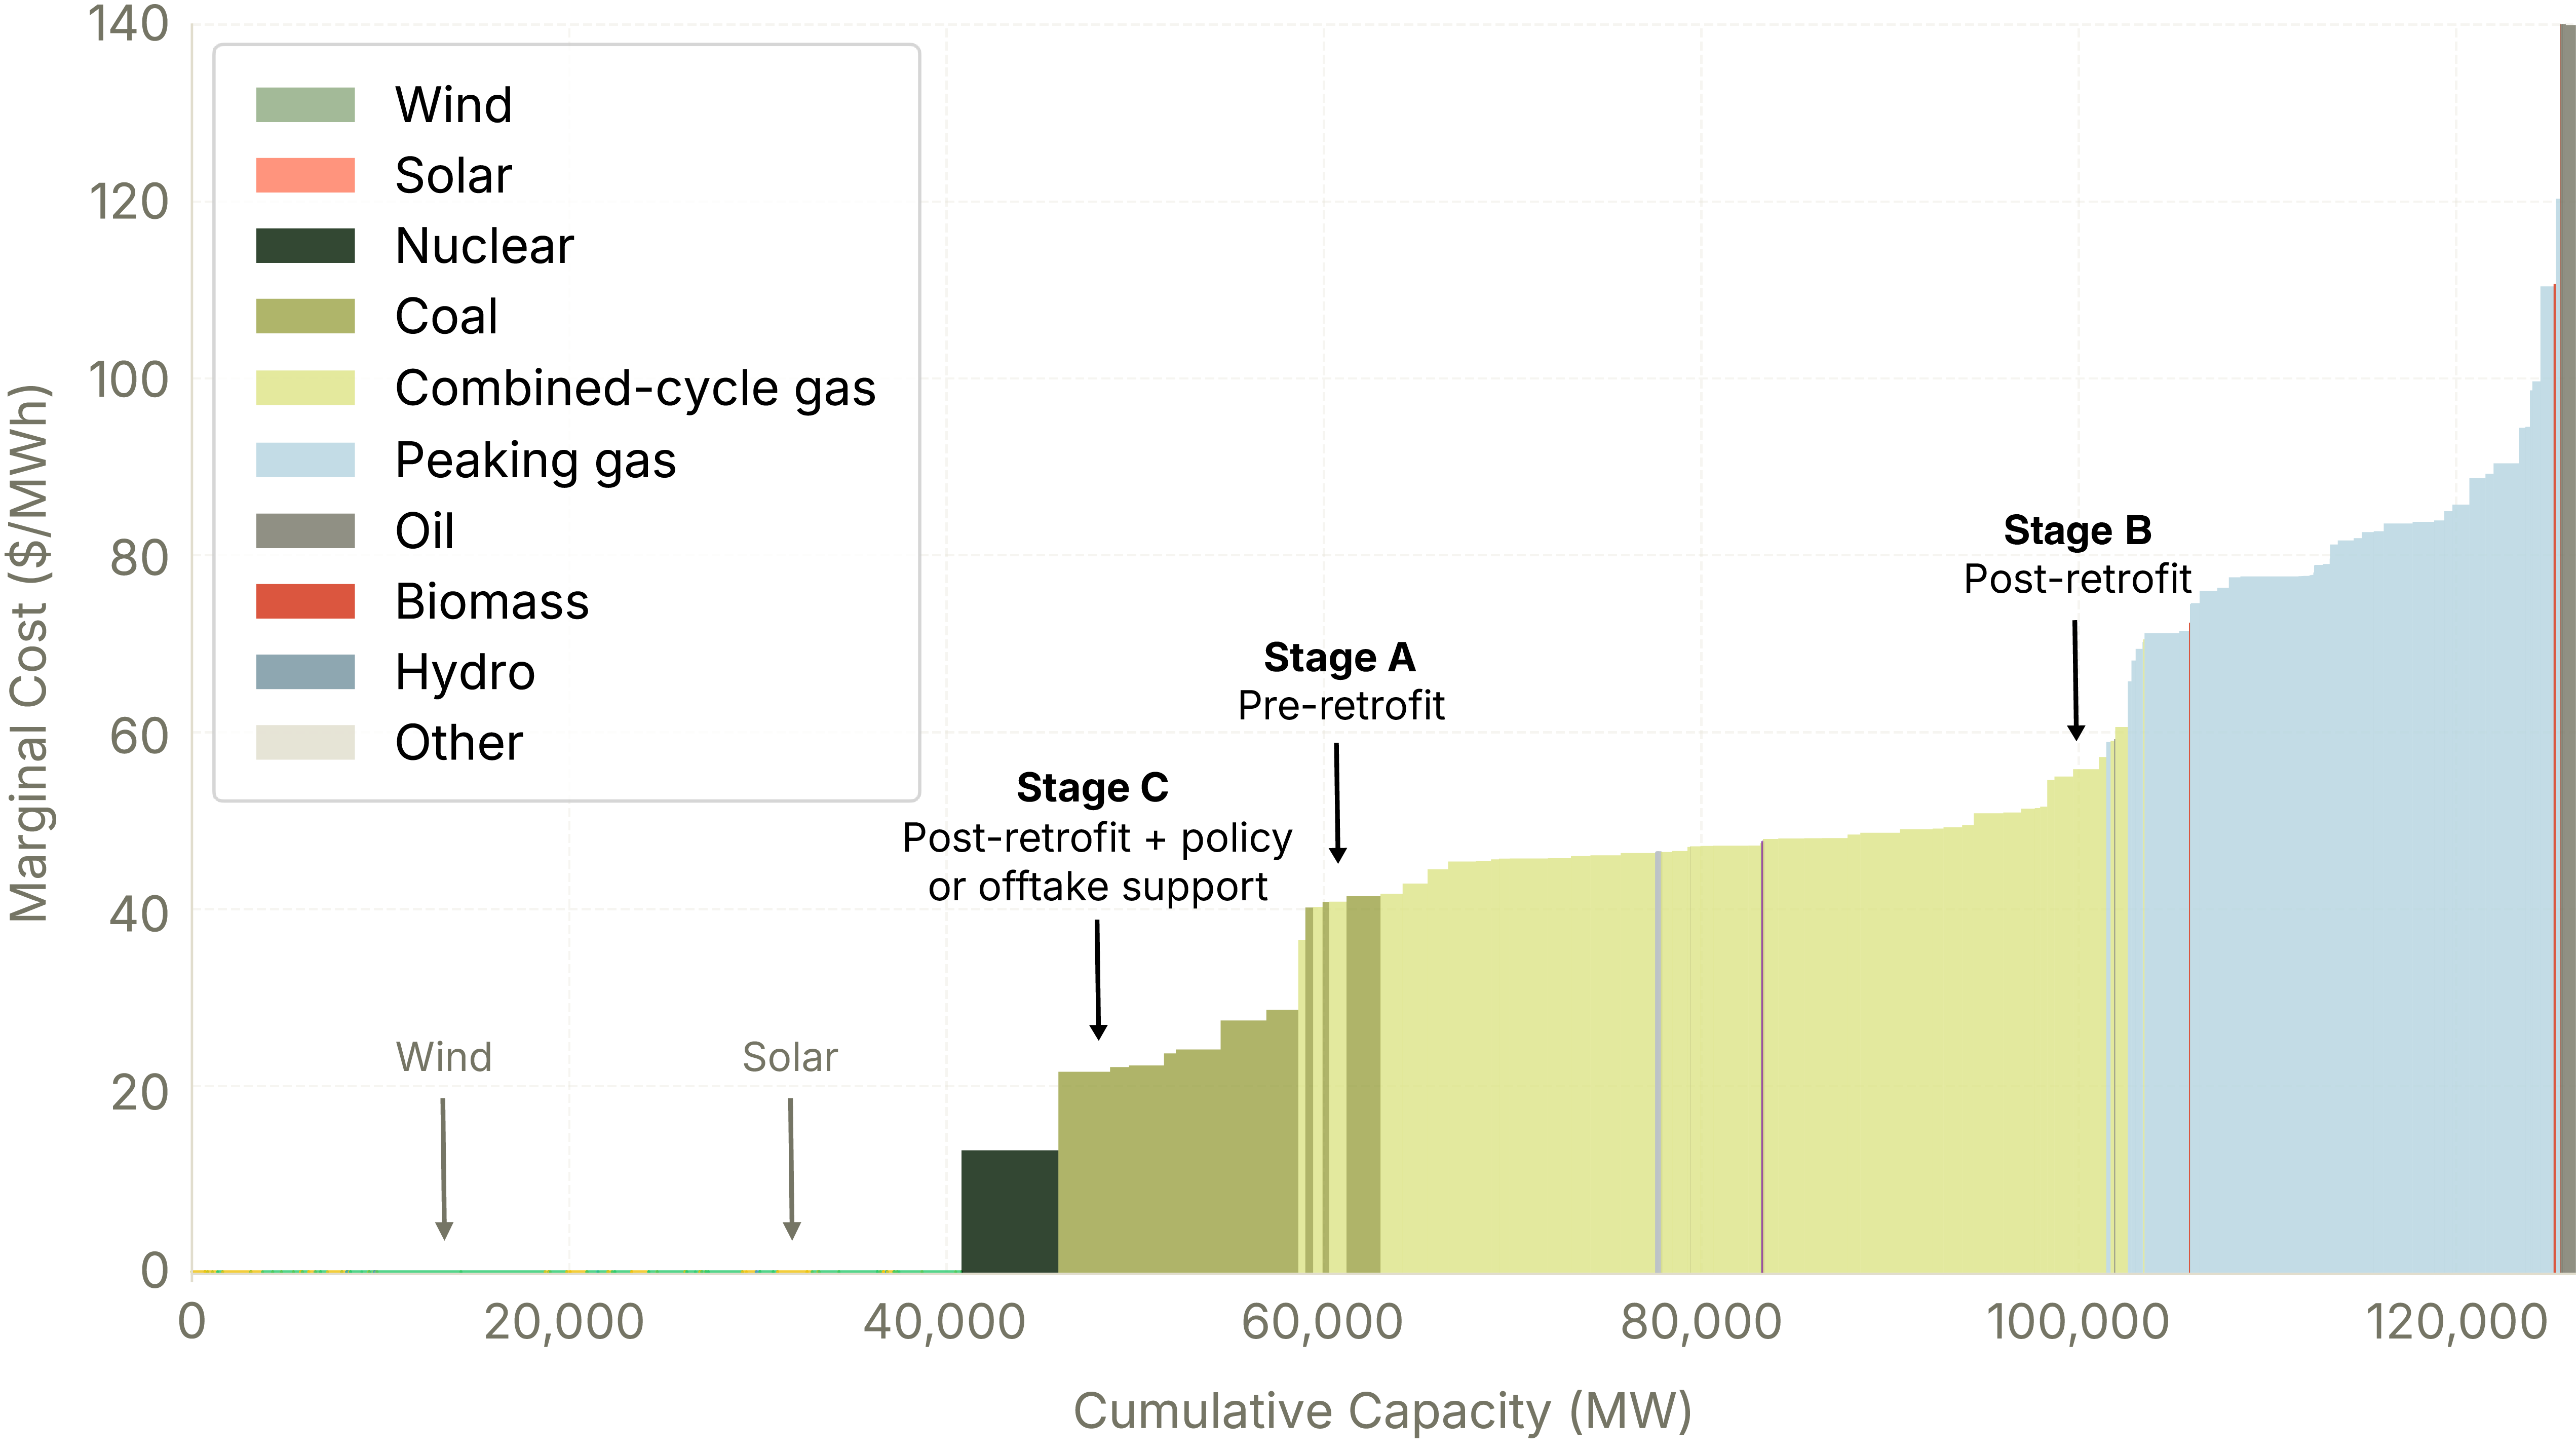
Case Study: How Support Structures Influence Dispatch
The merit order figure illustrates a hypothetical scenario for a natural gas generator, showing how its market position changes based on technical and policy variables:
- Pre-Retrofit (Stage A): The plant operates with standard marginal costs, sitting competitively in the middle of the supply stack.
- Post-Retrofit (Stage B): Retrofitting with CCS introduces higher operating costs due to the energy-intensive nature of carbon capture. Without external support, the plant’s marginal cost increases (A to B), making it less competitive. The retrofitted plant may be utilized less while cheaper units are dispatched to meet demand.
- Post-Retrofit + policy or offtake support (Stage C): Financial support, whether through the 45Q tax credit (approx. $33/MWh1) or a corporate offtake agreement, can effectively offset the plant’s higher operational costs (B to C). This effect restores the plant’s competitiveness, ensuring it dispatches consistently.
Testing This With Grid Modeling
At Relae, we apply state-of-the-art grid analysis tools to answer these and more complex analytical questions related to the future energy system. Our custom modeling framework has been used to simulate clean power strategies, assess data center demand response programs, and understand how procurement decisions today impact the future energy system.
While the theoretical impact of a CCS retrofit, a PPA agreement, and the 45Q tax credit on a plant’s dispatch is clear, it’s important to put the theory to the test by modeling their effects on system-wide emissions.
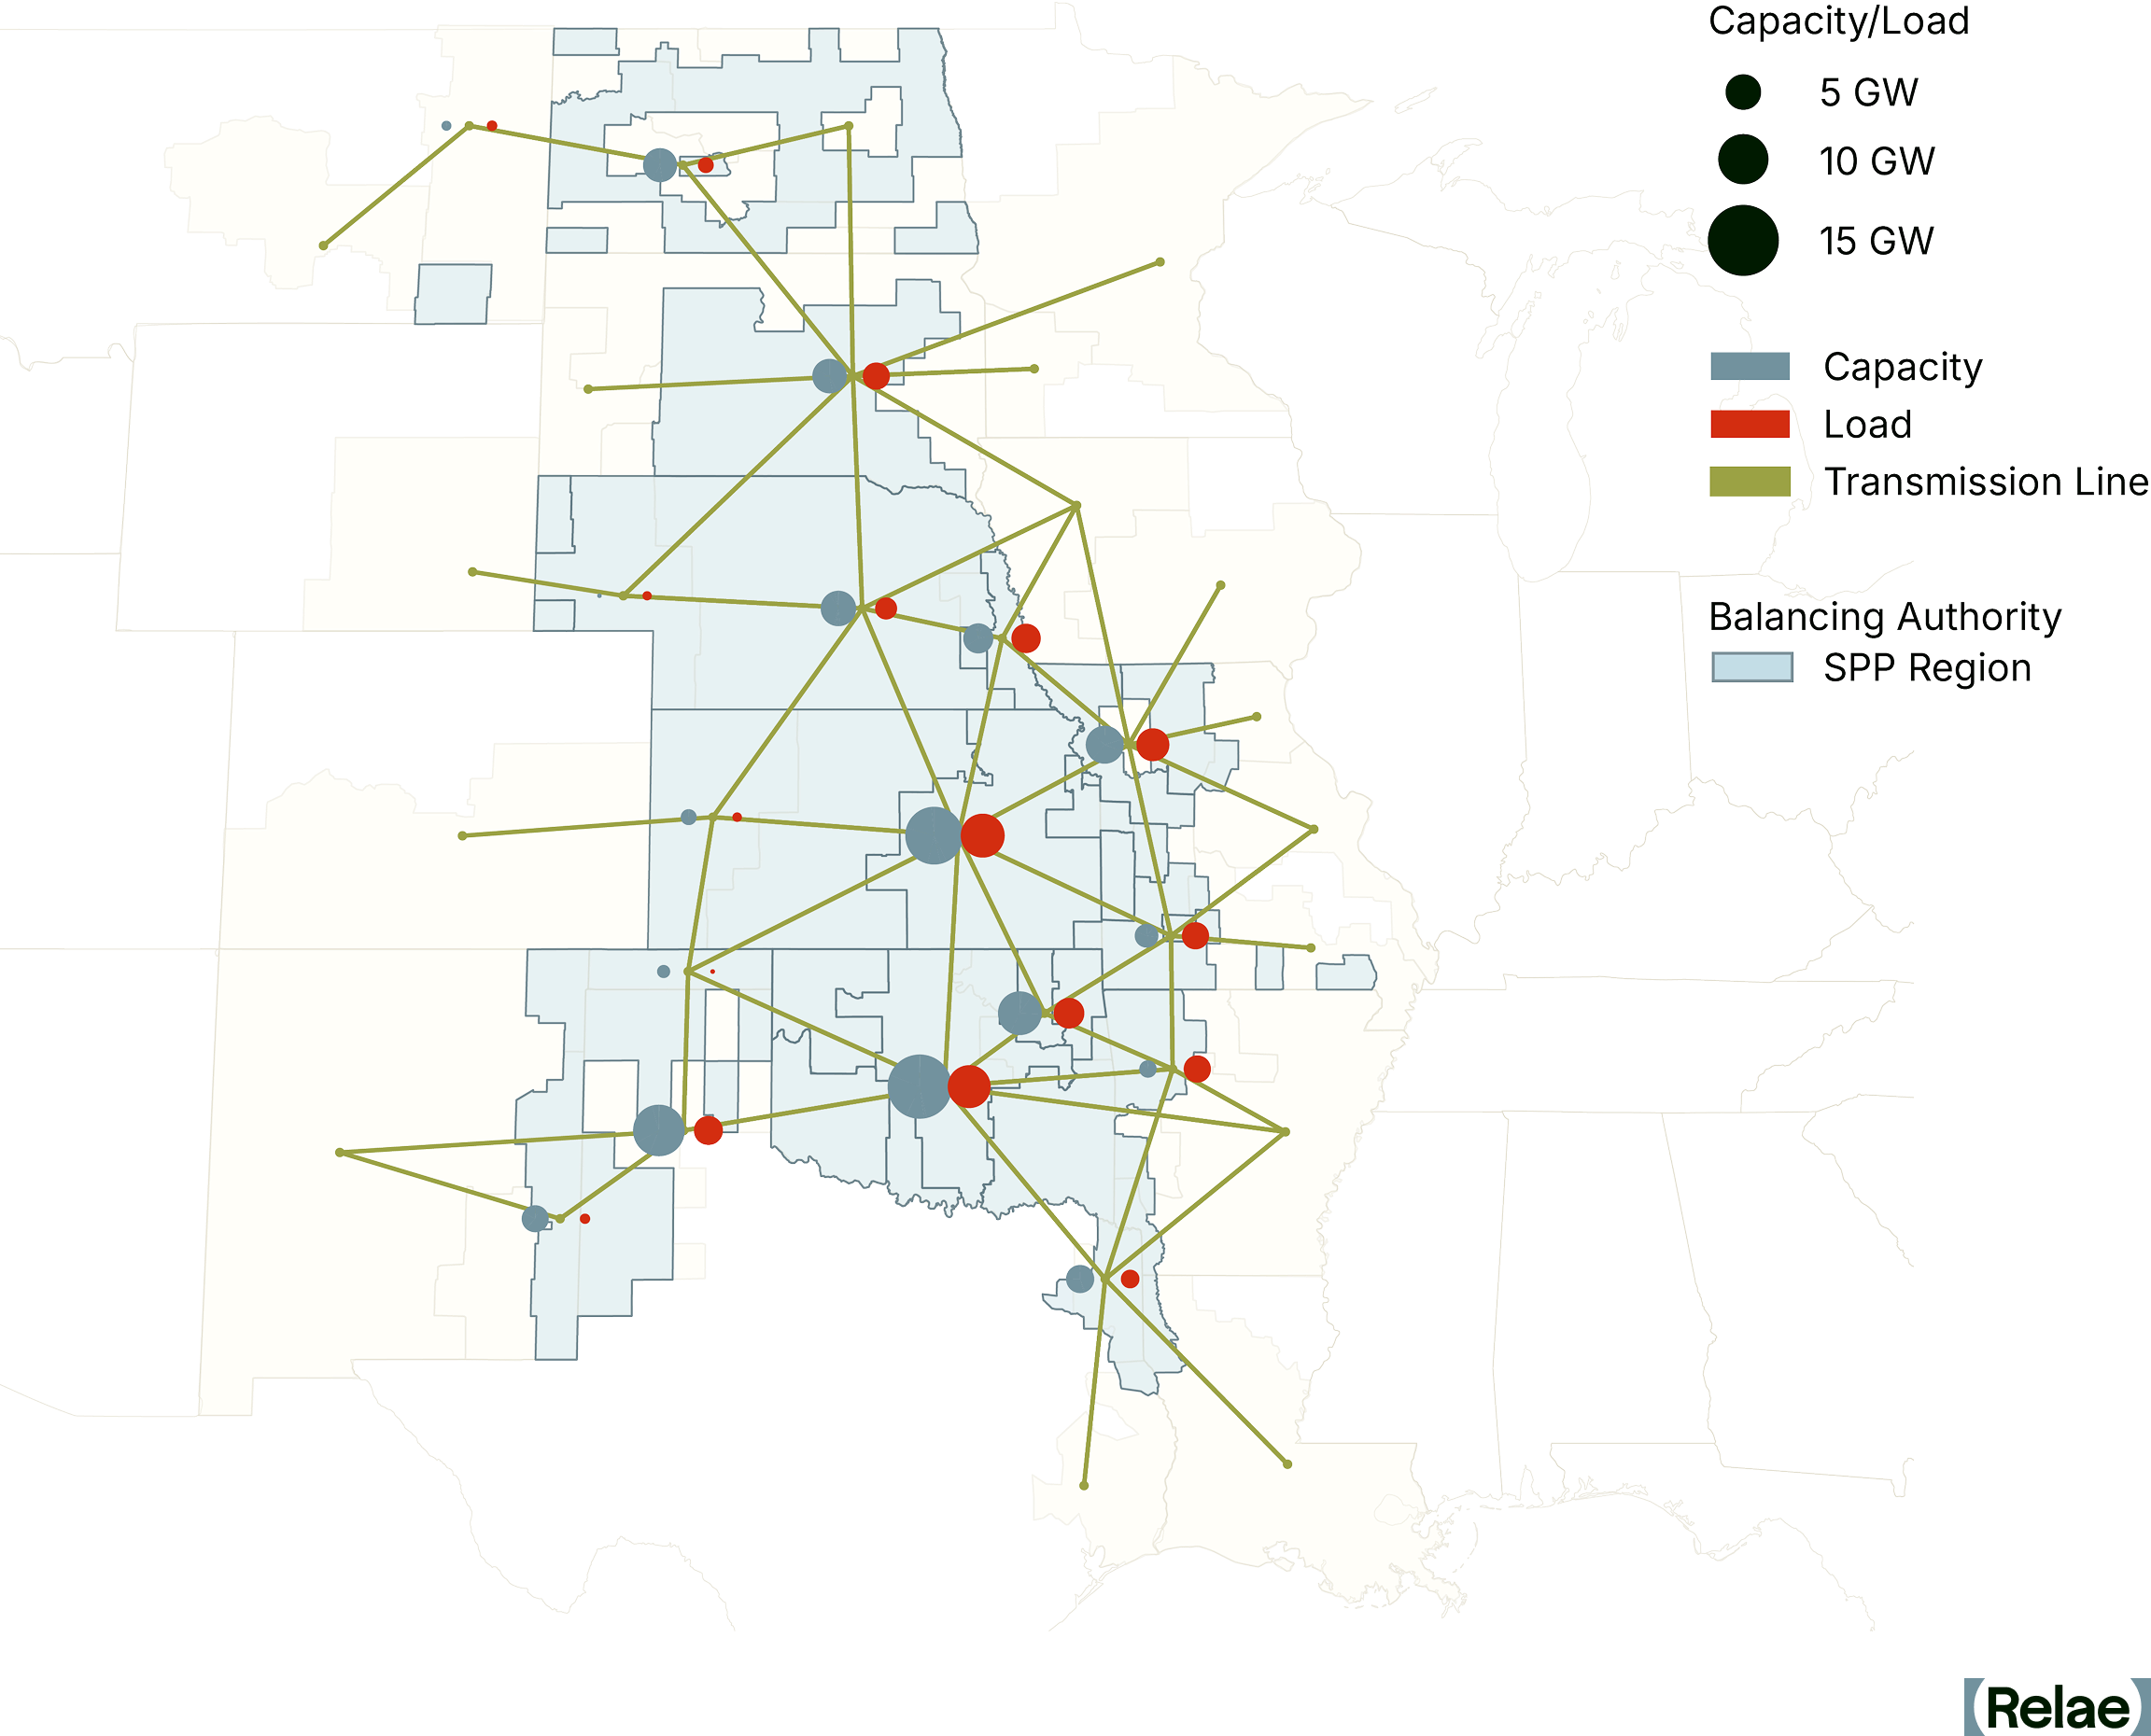
Our Modeling Approach
Because each grid region has distinct power plants and load requirements, they must be modeled separately. For this analysis, we chose to model the ERCOT and SPP power markets to determine the region-specific, grid-wide emissions impact of hypothetical CCS retrofits of natural gas power plants.
As part of this modeling, we:
- Deployed detailed hourly simulation: We used our custom PyPSA-USA grid model to produce a set of hourly simulations of the ERCOT and SPP electricity markets.2
- Identified suitable retrofits: We identified suitable combined cycle gas power plants for a CCS retrofit in each of the markets, based on key commercial and operational criteria, including size, age, generation profile, and proximity to CO2 transport/storage.
- Modeled plant and energy assumptions: To reflect the retrofit, we adjusted generator cost and energy use for the identified plants (up to 1.4 GW capacity), fitting all combustion turbines with capture and requiring each plant to consume 20% more fuel per unit of electricity produced to power CCS.3
- Carried out comparative scenario analysis: We simulated several scenarios, including (1) pre-retrofit, business-as-usual, (2) post-retrofit, with and without a PPA, and (3) post-retrofit, with and without the 45Q tax credit, to isolate the impact of different procurement agreements and policy landscapes on grid-wide emissions.
What Our Analysis Reveals
Results of this analysis reveal how CCS deployment in the power grid interacts with market economics and the role mechanisms that drive high utilization of CCS retrofit plants can have in ensuring system-wide emissions reductions:
CCS With a Firm Offtake Agreement Can Significantly Reduce Grid-Wide Emissions
Pairing a retrofitted plant with a dedicated offtaker can drive meaningful emissions reductions in both ERCOT and SPP compared to business-as-usual (-0.8% to -1.7% CO2 in ERCOT; -5.2% to -7.3% CO2 in SPP). Under these arrangements, system-wide emissions fall because the PPA acts as an operational anchor, ensuring the retrofitted plant maintains high utilization rates despite its higher running costs. Ensuring the plant stays utilized prevents the grid from reverting to more carbon-intensive generation to fill the gap.
Our analysis finds the value of the operational “clean, firm premium” for natural gas with CCS power is up to $60 per MWh. This value varies by hour, region and scenario but results generally align with our previous estimate of a $30 per MWh value associated with this type of generation. Other estimates put this value between $19 and $72 per MWh.
CCS Without an Offtake Agreement Can Reduce Emissions, But Is More Reliant on Policy Support
Without a dedicated offtake agreement or policy support, retrofitting natural gas plants with CCS runs the risk of a small increase in grid emissions (+0.7% CO2 in ERCOT; -0.0% CO2 in SPP). System-wide emissions are higher because other power plants displace the plants with carbon capture. The higher operational costs of CCS mean the CCS plants have a less competitive place in the merit order and run for fewer hours in the year.
The story changes with the application of 45Q, and grid-wide emissions are lower for both ERCOT and SPP (-1.7% CO2 in ERCOT; -3.4% CO2 in SPP). Access to the 45Q tax credit improves each CCS plant’s position in the merit order, meaning that it runs for more hours and successfully displaces higher-emitting generation with clean, firm power.
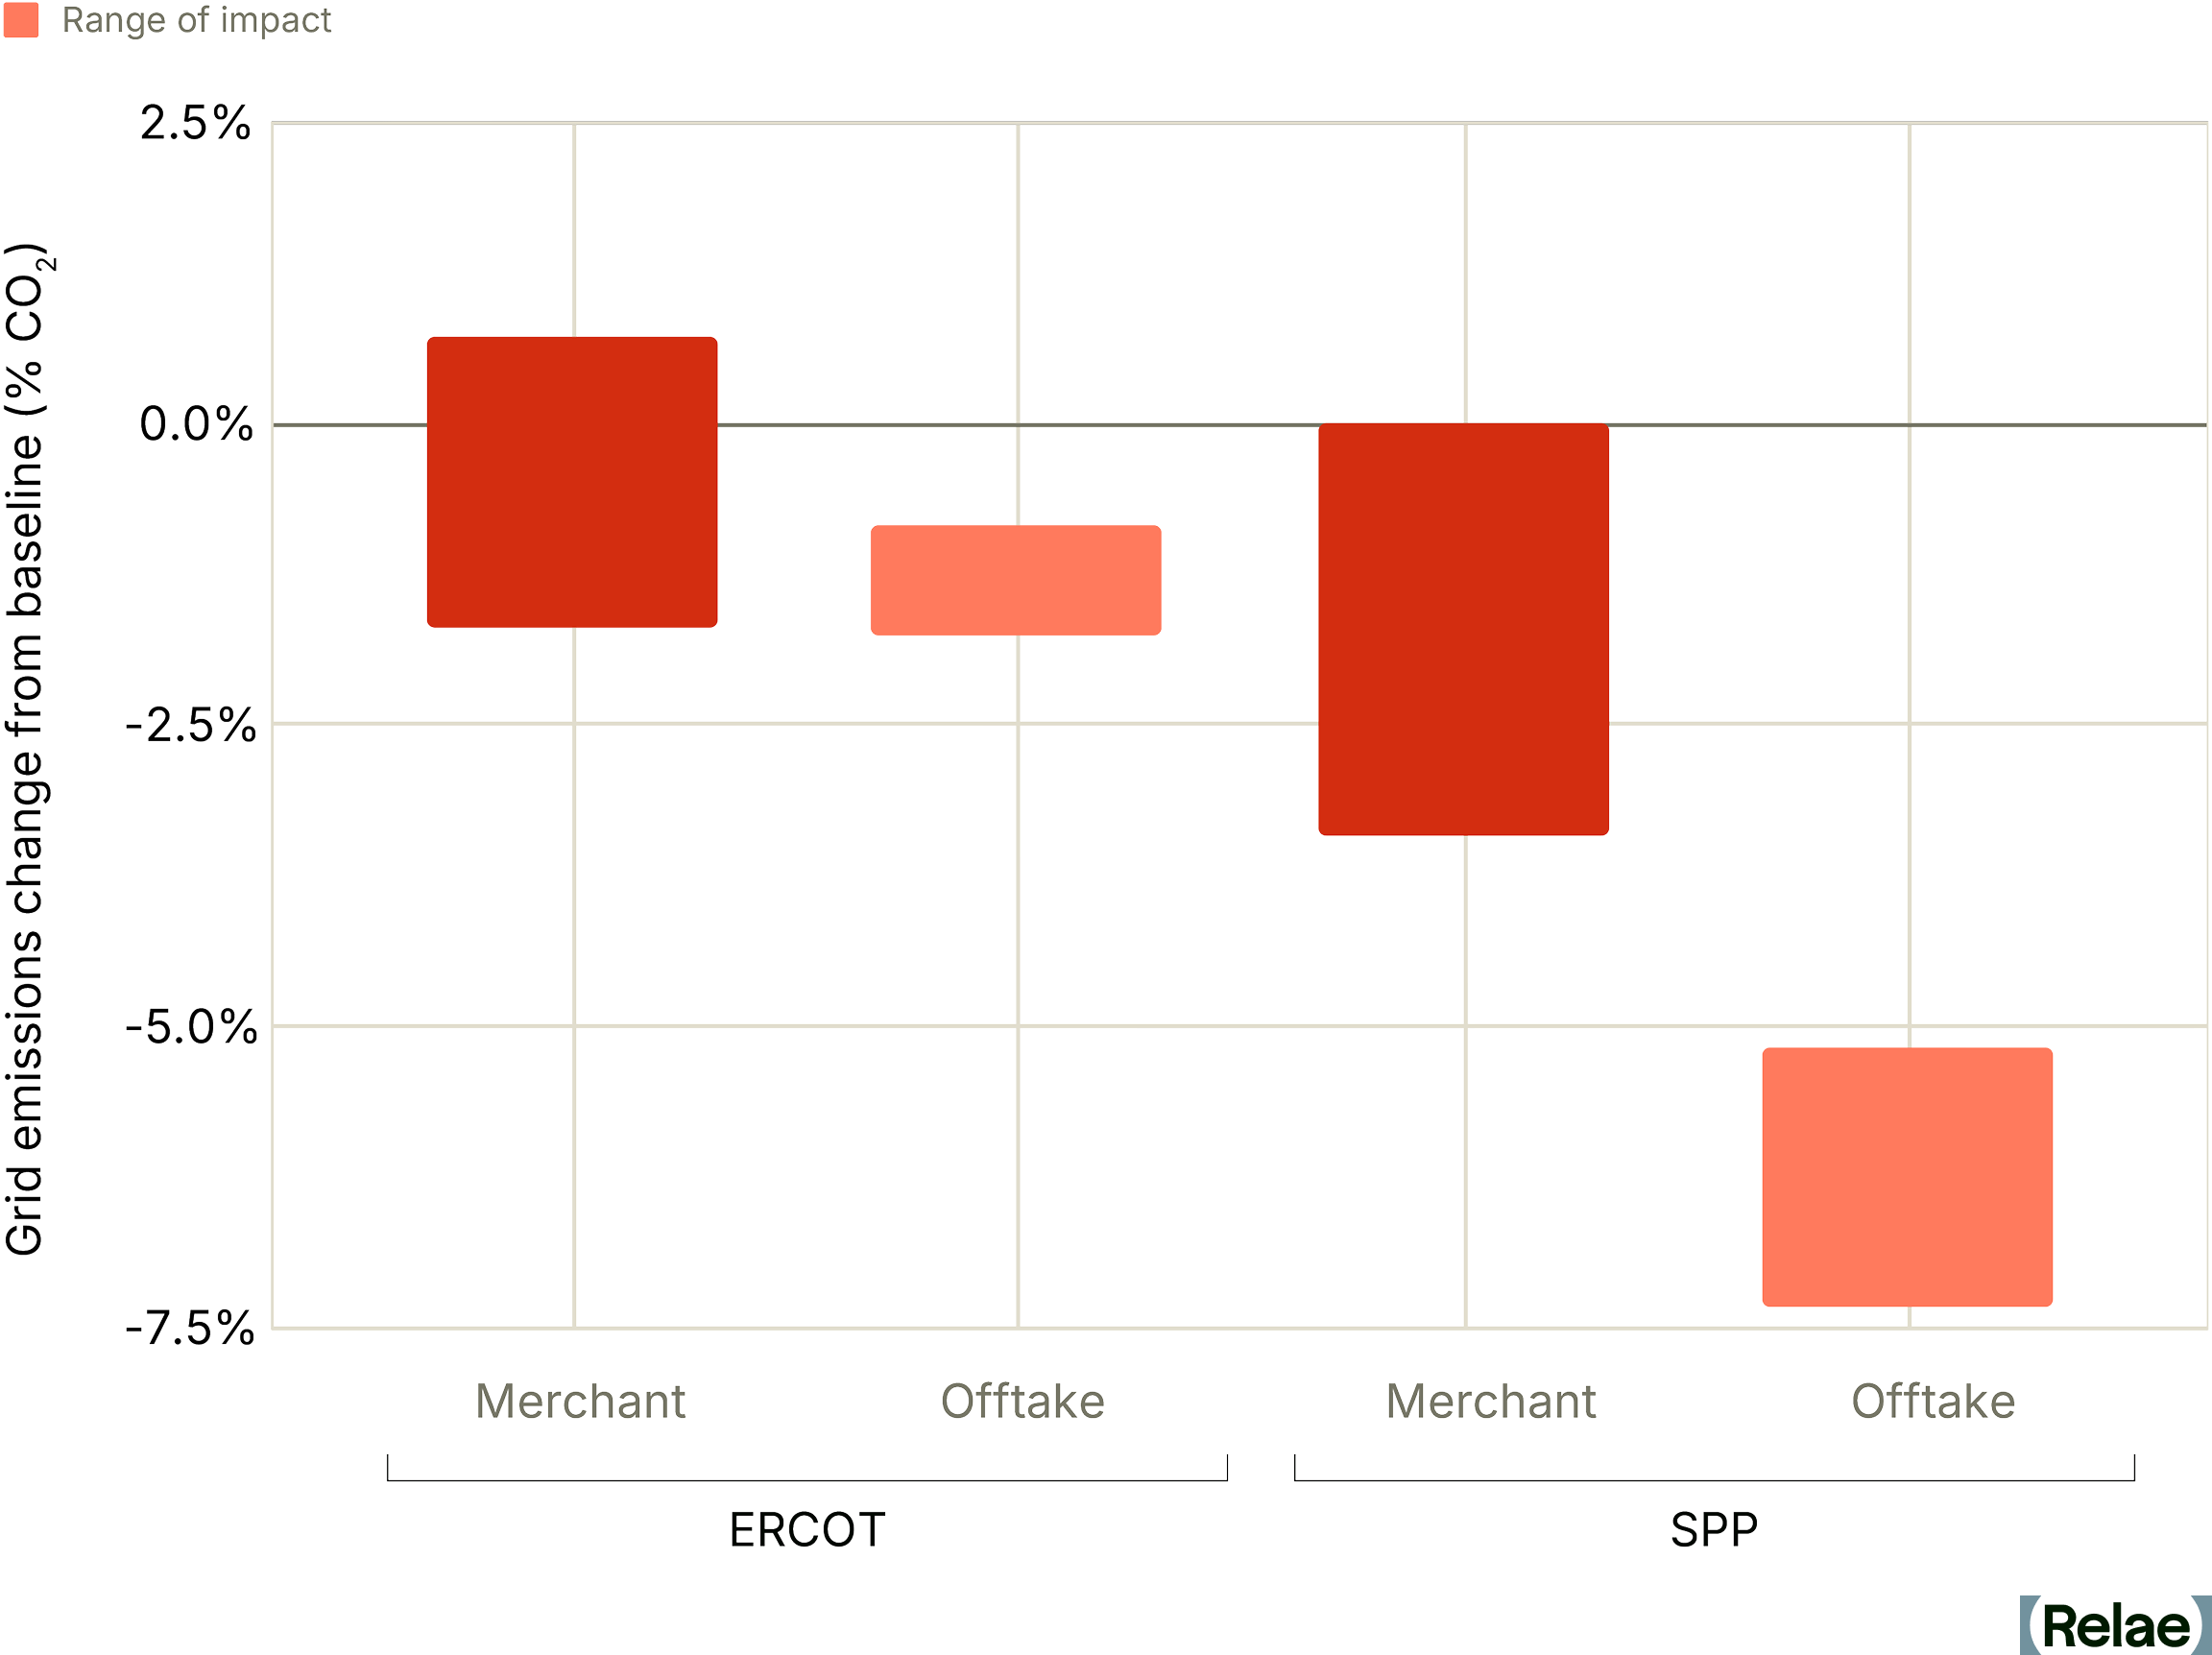
The Path Forward for Clean, Firm Power
Our analysis illustrates that in competitive power markets, the overall carbon emissions impact of natural gas generation with CCS cannot be measured solely at the power plant level. While clean, firm power remains a strategic priority for large electricity buyers, and CCS is a key tool to meet this demand, the overall climate value of a successful retrofit is linked to the availability of offtake agreements and the plant’s position in the merit order.
A systems-level perspective captures what facility-level analysis misses: how market dynamics determine the true climate impact of decarbonization investments. Support mechanisms for the continuous operation of low-carbon power plants, like PPAs and the 45Q tax credit, are important tools that ensure clean, firm power reaches the grid, effectively bridging the competitiveness gap.
Frequently Asked Questions
How can companies ensure CCS retrofits actually reduce grid-wide emissions?
By securing the plant’s dispatch through a long-term offtake agreement, or by utilizing a policy incentive like 45Q. Relae’s modeling found that offtake agreements have a substantial impact on the emissions reduction potential of CCS retrofits.
Why would the dispatch decisions of one power plant affect others?
Power plants dispatch according to marginal cost, and grid stability requires that total supply remain constant at any given moment. So, if one large plant suddenly dispatches less (say, because its operating costs have increased), other potentially dirtier plants may ramp up to fill the gap, increasing total system emissions.