The $5.5 Billion-Dollar Case for Enabling Data Center Load Flexibility
Key Takeaways
- The electricity demand surge is real and accelerating. Just last year, data center load in the US was projected to increase from 25 GW to 120 GW by 2030. Today, Texas’ preliminary long-term load forecast projects over 187 GW of data center load by 2030, more than double today’s total peak demand of approximately 91 GW.
- Flexible loads that respond dynamically to policy signals are becoming a regulatory requirement. Texas Senate Bill 6 (SB6), signed into law in June 2025, is the clearest signal yet. It makes remote curtailment equipment a condition of interconnection for new loads of 75 MW or more, so utilities can disconnect them during declared firm load shed events, and separately creates a voluntary demand response program that those loads can elect to join.
- Relae’s power system modeling puts a dollar value on what data center load flexibility is worth. Our ERCOT analysis shows that data center demand response can eliminate forced load shedding risk, even at 40 GW of data center buildout – preventing $5.5 billion in annual consumer welfare losses by curtailing an average of 5% of demand for under 1% of operating hours.
- Flexible load curtailment and compute uptime do not need to be in conflict. In our modeling, demand response operates as a "ghost battery" at the data center's grid node, absorbing grid stress as a physical battery would. That construct has a direct real-world analog: on-site battery storage lets data centers draw from stored energy during grid stress events rather than curtailing workloads. Technologies such as those demonstrated by Emerald AI have shown 25% load curtailment at cluster scale while preserving compute service quality.
Data Center Electricity Demand is Testing Grid Limits
Electricity demand in the United States is growing at its fastest pace in decades. Leading the surge is a rapid buildout of data centers, driven by the expansion of artificial intelligence. ERCOT, the grid serving most of Texas, is projecting up to 187 GW of new data center load by 2030, against a total peak demand today of approximately 91 GW.
The scale of this shift extends across the country. According to NERC's 2025 Long-Term Reliability Assessment (LTRA), summer peak demand across the US bulk power system is forecast to grow by 224 GW over the next 10 years, 69% above the prior year’s 10-year projection of 132 GW, with data centers as the dominant driver. As previously explored by Relae, data center energy capacity in the US is projected to increase from 25 GW to 120 GW by 2030, characterizing it as the first wave of a longer demand surge that electrification of buildings and transport will reinforce.
Policymakers are responding in real time, and regulatory responses like Texas SB6 are already rewriting the rules for how data centers connect to the grid. The pace of change is fast, but the siting, infrastructure, and interconnection decisions made today will have lasting consequences: they will determine whether data centers are grid assets or grid liabilities, and the financial difference between the two is measured in billions.
New Solutions for Data Center Demand Response: Texas SB6 as a Test Case
The rapid nature of this new wave of load growth means traditional approaches to managing the grid may not be sufficient. In the past, lead times on new sources of electricity demand allowed utilities to procure supply-side resources in advance. The scale and immediacy of data center deployment is revealing limitations of this approach. States, utilities, independent system operators (ISOs), and regulators are actively pursuing novel approaches for grid management in response.
Texas has become a focal point of US data center expansion, with SB6 as a leading policy response. The bill, which took immediate effect upon Governor Greg Abbott's signature on June 20, 2025, is the most significant restructuring of large-load interconnection rules in ERCOT's history. It requires large loads over 75 MW to install remote curtailment equipment as a condition of interconnection, so grid operators can disconnect them during declared firm load shed events, and creates a separate voluntary demand response program, procured competitively with at least 24 hours’ notice, that those loads may elect to join. If data centers are adding substantial new load to the grid, this reasoning goes, they should also contribute to grid stability by demonstrating load flexibility—reducing power draw at times of peak demand.
While demand response programs currently exist, incentivizing voluntary curtailment from data centers is challenging. In an AI compute arms race, the value of uninterrupted compute time far exceeds any available curtailment payment, such as via PJM’s capacity market mechanisms.
Approaches to bridge that gap are coming to fruition: EPRI’s DCFlex program is working with hyperscalers and utilities to develop the technical protocols, measurement standards, and contractual frameworks that would make large-load demand response a routine grid service. Innovators like Emerald AI have demonstrated a 25% power reduction across a 256-GPU cluster over three hours during an Arizona grid stress event, while preserving compute service quality, helping to bridge the valuation asymmetry between energy and compute.
Hyperscalers are already putting a flexible load commercial strategy into action. In March 2026, Google announced 1 GW in demand response contracts with multiple US utilities, including Entergy Arkansas, Minnesota Power, and DTE Energy.
The conversation has shifted from whether data centers can be flexible to how that flexibility gets structured and deployed.
Putting a Dollar Value on Data Center Load Flexibility
For developers, investors, and grid operators navigating data center growth, the challenge has been making high-stakes siting and interconnection decisions without a clear picture of what load flexibility is actually worth, what inflexibility costs the system, or how curtailment requirements will reshape the regulatory landscape.
Prior research has established that flexible data center load can absorb substantial grid stress. For instance, research from Duke University’s Nicholas Institute found that 22 of the largest US balancing authority areas could absorb approximately 98 GW of new flexible load if 0.5% of that load’s annual energy is curtailed, or 76 GW at a stricter 0.25% curtailment level.
Relae’s analysis goes further by quantifying the economic cost at each increment of flexible load growth, and the precise threshold at which that flexibility stops being optional. We zeroed in on ERCOT, a region with high data center load growth and immediate regulatory stakes, determining the value of implementing flexibility and, conversely, the system risk of failing to do so.
How We Modeled It
Assessing the impacts of load growth and flexibility solutions requires a systems-level analysis, best achieved via power market modeling. At Relae, we deploy our in-house power system modeling framework to navigate this complexity.
Our toolkit includes CD-PyPSA-USA, used for this analysis, which is built on the Python for Power System Analysis (PyPSA) platform. This grid model simulates how power networks operate and evolve over time by solving for the least-cost optimization of the entire power system. Critically, our model is customized to explicitly represent complex, real-world dynamics, including data center load flexibility, co-located generation, and various policy constraints.
For this analysis, we simulated ERCOT operations under a range of data center growth scenarios. We modeled loads from 5 GW up to 40 GW in 5 GW increments, pairing each with sufficient on-site gas generation to cover roughly 70% of data center energy needs–a conservative estimate on the approach developers are taking today.
We ran each scenario under two conditions: no load flexibility (“flex00”, the baseline) and 25% emergency curtailment capability (“flex25”), consistent with solutions exhibited by Emerald AI. This approach allowed us to determine the system's response to step-changes in electricity demand.
Voluntary Curtailment, Forced Outages, and the Value of Lost Load
This analysis makes an important distinction between three curtailment types: one voluntary and two involuntary electricity demand reductions.
- Demand response or load flexibility (voluntary reduction): This involves industrial consumers curtailing their power requirements in response to pricing or regulatory incentives. Participation is optional.
- Mandatory curtailment (targeted reduction): This is a required, controlled reduction of power draw by a specific consumer group (e.g., data centers under Texas SB6) when directed by grid operators during declared emergencies. This is a deliberate policy directive aimed at grid stability.
- Load shedding (forced outage): This is a non-targeted, involuntary outage event, such as a rolling blackout, where the system operator must cut power to prevent grid failure. These events affect all types of consumers, including residential and commercial electricity demand.
Grid operators in Texas use a value of lost load (VoLL) of $35,000 per megawatt-hour (MWh) to measure the welfare cost borne by businesses and households who lose power involuntarily. That figure, the standard benchmark applied by ERCOT in reliability and market design analysis, is what we use as the basis for valuing shedding events in our modeling. At $35,000 per MWh, even a small number of unplanned outage hours produces welfare losses in the billions.
What Our Analysis Reveals
Before doing the analysis, we expected to see load flexibility become more important as more data center load is added to the grid, preventing forced load shedding with high lost-load costs. But we didn’t know how large this effect would be, or what amount of new data center load would start to trigger it.
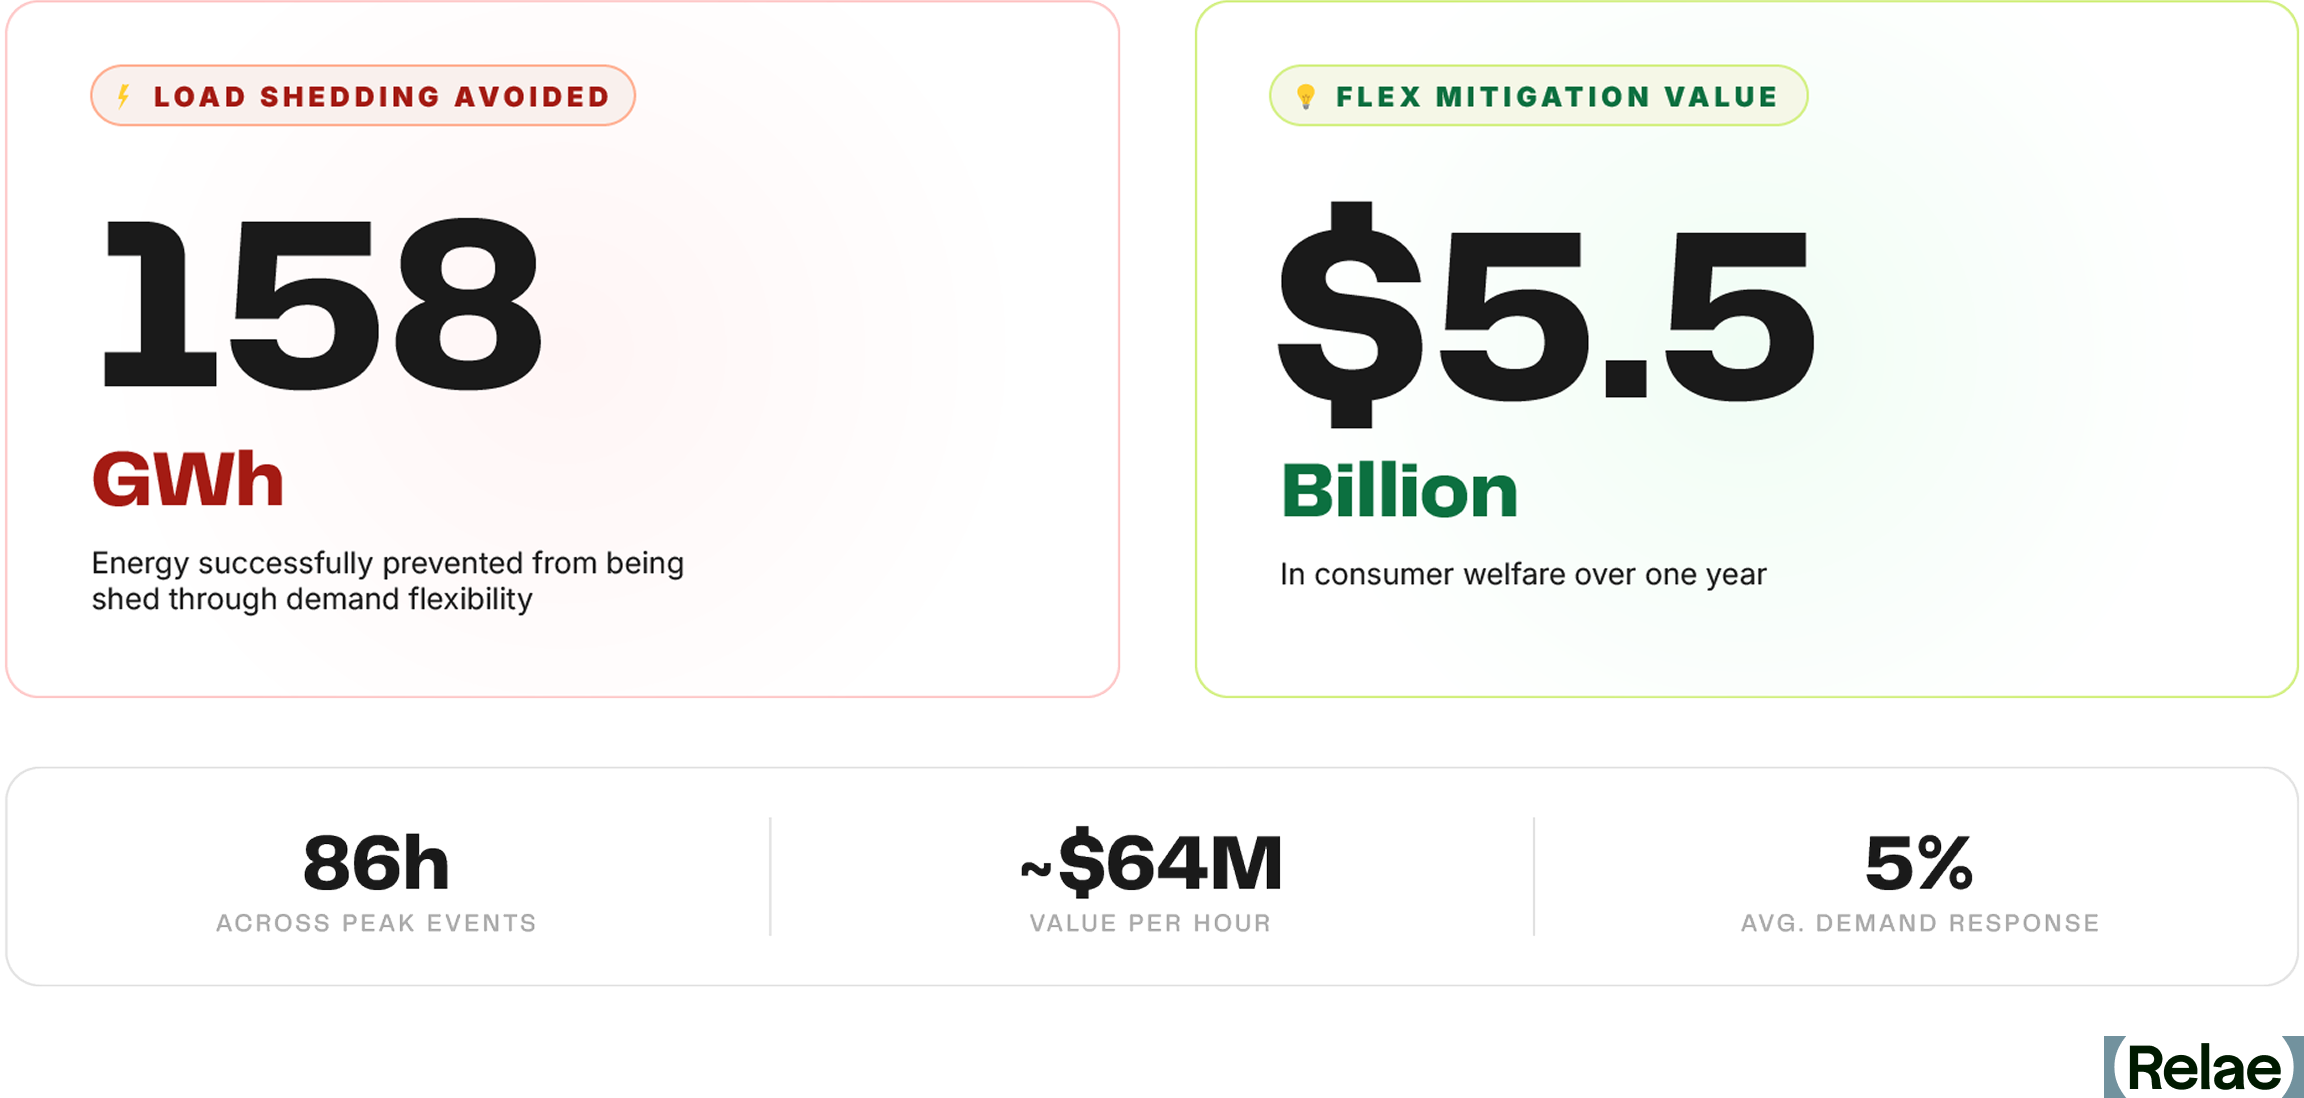
Our analysis found that without flexible load management, forced load shedding first appears at 30 GW, small in scale at first (4.4 GWh over 3 hours) but growing sharply as load increases. At 35 GW, we observe 50 GWh of shedding across 39 hours. At 40 GW, shedding reaches 158 GWh across 81 hours, equivalent to nearly three times ERCOT’s average hourly energy consumption, with an economic cost at VoLL of approximately $5.5 billion.1
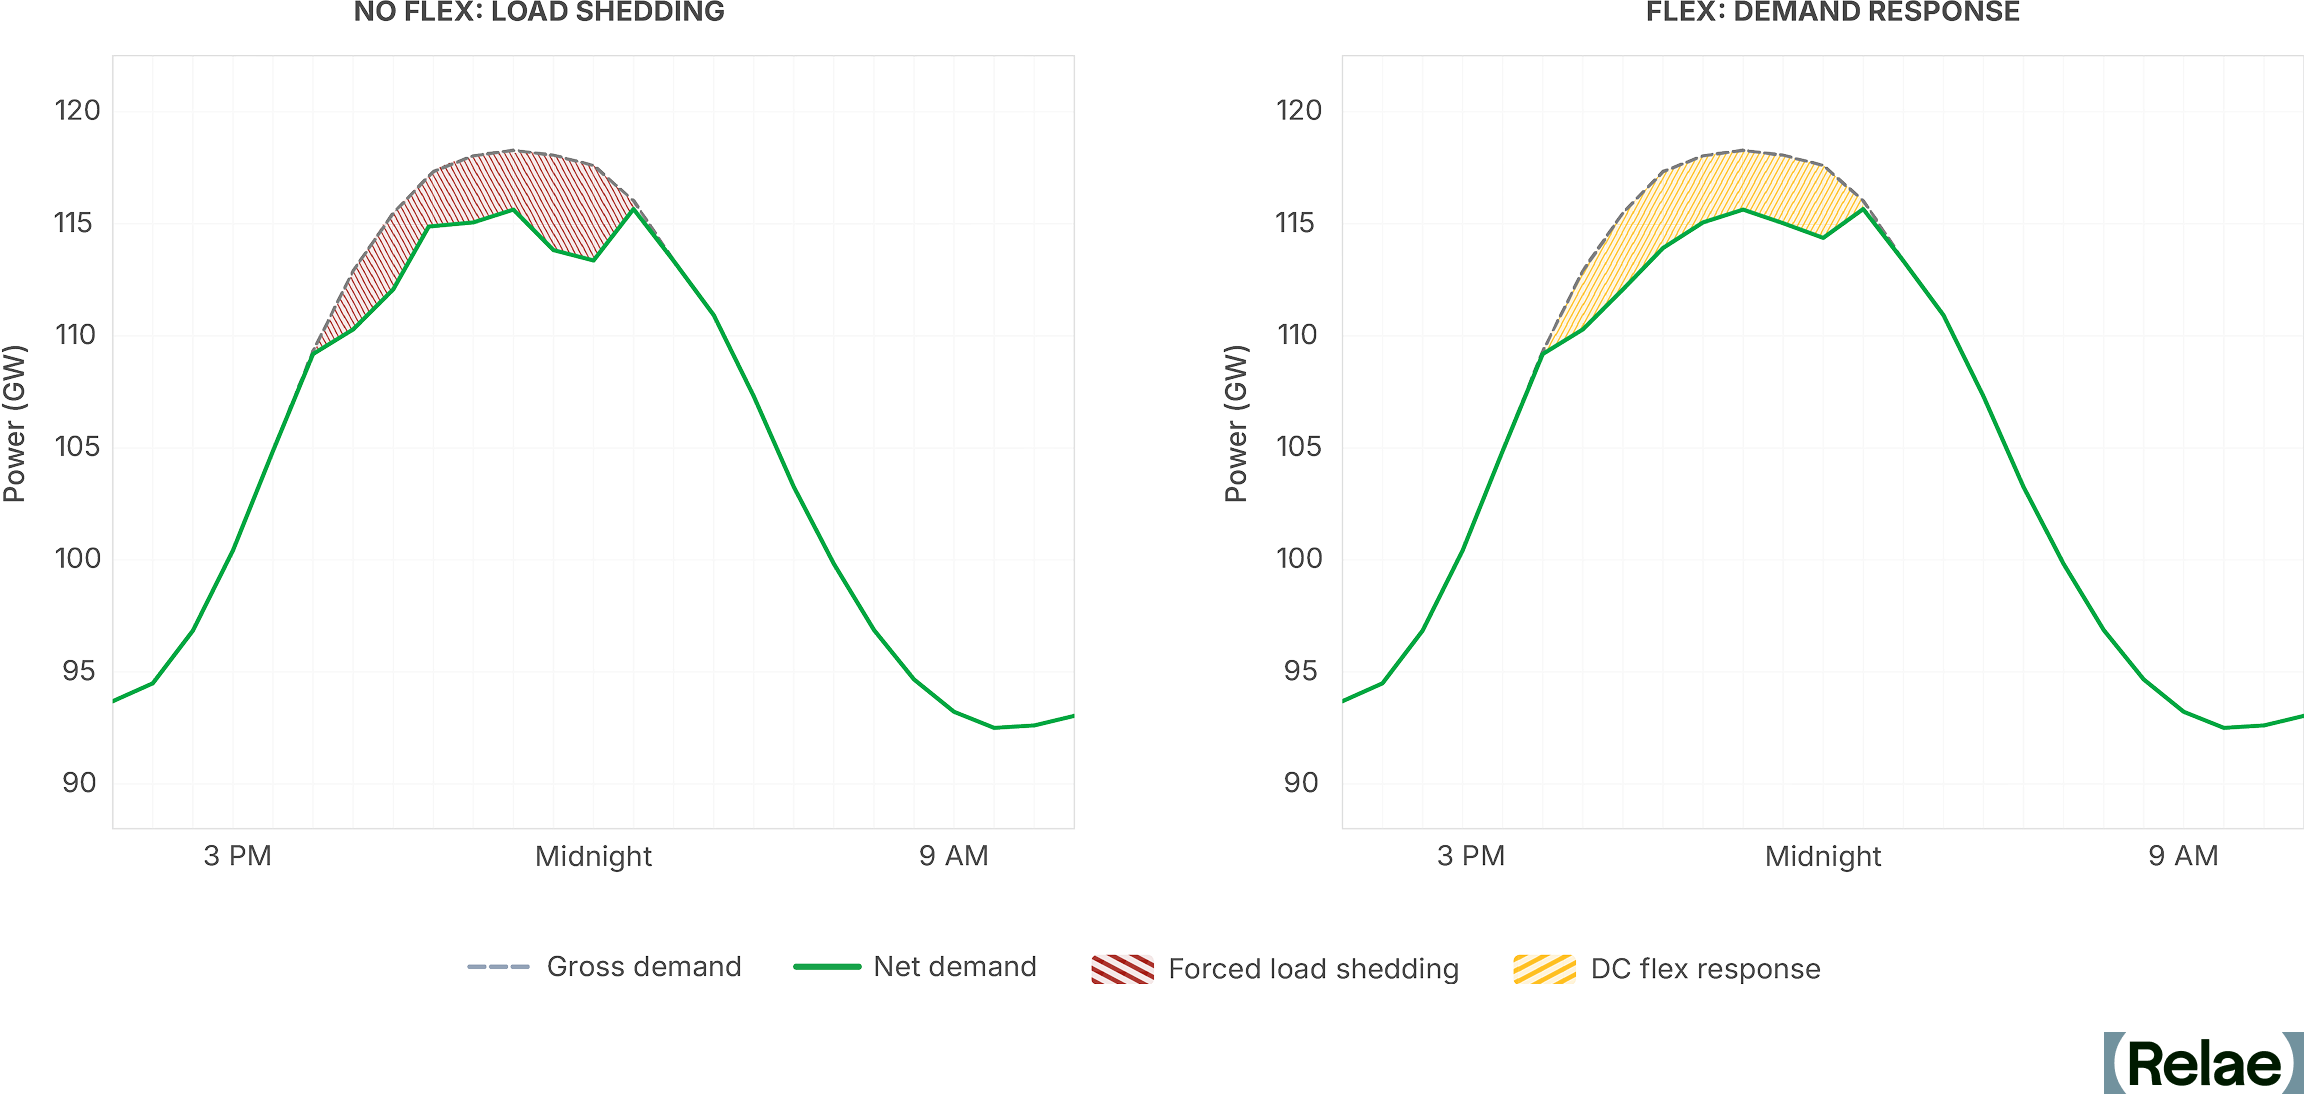
By enabling on-demand data center load flexibility, forced load shedding is eliminated in every scenario we tested. The same 40 GW case instead sees 165 GWh of controlled, short-duration curtailment spread across 86 hours, less than 1% of hours in a year. Further, the average demand response in these hours was less than 5% of the nameplate data center load, with the largest event reaching 14% of data center load. The grid stays balanced, consumers remain connected, and data centers deliver substantial value to the system via flexible loads.
Load Flexibility Is High Value and Presents an Opportunity for Storage
Our modeling puts a dollar figure on what flexible load is worth. At a VoLL of $35,000/MWh, each hour of demand response in the 40 GW scenario delivers approximately $64 million in avoided consumer welfare losses. Over a full year, that adds up to $5.5 billion, achieved through an average of just 5% demand response across the 86 hours of curtailment needed to eliminate all forced load shedding.
That value points directly to an opportunity for storage. In our model, demand response functions as a “ghost battery” at the data center’s grid node, absorbing grid stress exactly as a physical battery would, without any electrons needing to flow. That virtual battery can become a real one. On-site battery storage allows a data center to dispatch stored energy during grid stress events rather than curtailing workloads, maintaining compute continuity while relieving grid pressure.
The implications point in two directions.
- For the hyperscaler or data center operator, physical storage converts a compliance obligation into an uptime guarantee: the curtailment event becomes a battery discharge, with negligible impact to the compute stack.
- For the storage developer, co-location with large data center loads represents a high-value deployment opportunity with a clear commercial case. The avoided welfare costs per curtailment hour our model quantifies is the value a well-positioned battery asset, co-located at a data center node, can credibly claim to preserve.
The Data Centers of Tomorrow Need to be Grid Assets
The data center buildout underway is large enough to reshape grid reliability across entire regions, and the regulatory environment is beginning to reflect that scale. Texas SB6 is the most prescriptive example to date: it requires new large loads above 75 MW to install remote curtailment equipment operable during firm load shed events.
Our modeling quantifies what load flexibility is worth across this landscape: data centers with curtailment capability can provide significant value and avoid billions in consumer welfare losses annually. For developers and investors, designing that capability in from the start can convert a compliance requirement into a long-term grid asset.
The federal picture has moved in the same direction since this analysis was published. In May 2026, NERC issued a rare Level 3 Alert on computational loads; in June, FERC ordered six RTOs and ISOs to revise or justify their large-load interconnection rules, and in July, FERC directed NERC to develop mandatory computational-load reliability standards by the end of the year. We covered what that means for grid modeling and interconnection in Inside NERC’s Level 3 Alert on data center loads. Flexibility is no longer only a Texas statutory question; it is becoming part of the federal reliability framework.
Frequently Asked Questions
What is data center load flexibility, and how does it work?
Load flexibility is a data center’s ability to reduce the power it draws from the grid on short notice, during the small number of hours when the system is under stress. In practice, that means shifting or pausing deferrable compute, drawing on on-site batteries or generation, or pre-cooling the facility ahead of a peak. The point is not to consume less overall—it is to move a thin slice of demand out of the hours when the grid can least afford it.
What does Texas SB6 require of large data centers in ERCOT?
Texas Senate Bill 6, signed June 20, 2025, makes remote curtailment equipment a condition of interconnection for new loads of 75 MW or more in ERCOT, so utilities can disconnect them during declared firm load shed events. Separately, it creates a voluntary, competitively procured demand response program those same large loads can elect to join, with at least 24 hours’ notice. The mandatory piece is the disconnection capability; paid participation in demand response is a choice.
What does data center inflexibility cost? How much curtailment avoids it?
Relae’s ERCOT modeling found that without flexibility, forced load shedding first appears at 30 GW of data center load and reaches 158 GWh across 81 hours at 40 GW—roughly $5.5 billion a year in consumer welfare losses at ERCOT’s $35,000/MWh value of lost load. Enabling curtailment eliminated forced shedding in every scenario we tested, at an average of under 5% of data center demand across 86 hours, less than 1% of the year. Each hour of demand response in the 40 GW case is worth about $64 million in avoided losses.
Is data center load flexibility proven today, and how does it compare to on-site batteries?
Data center load flexibility is past proof of concept and into commercial deployment: Emerald AI cut power to a 256-GPU cluster by 25% for three hours during an Arizona grid stress event without degrading compute service quality; EPRI’s DCFlex initiative is building the protocols and contracts, and Google has signed 1 GW of data center demand response with US utilities.
On-site batteries reach the same result from the other direction—instead of curtailing workloads, the facility discharges stored energy, which is why our modeling treats demand response as a “ghost battery” at the data center’s grid node. For operators who cannot pause compute, storage turns the same compliance obligation into an uptime guarantee.
Power & Energy
Relae provides independent advisory for large corporate buyers, power providers, and infrastructure investors making high-stakes decisions about clean firm power, grid constraints, data center energy optimization, and long-term investment strategy. Our insights help you evaluate solutions that can be deployed reliably, responsibly, and affordably, so you can navigate an evolving energy landscape with confidence.
Explore Our Interconnection Queue Analysis in PJM and ERCOT



Jonathan Goldberg

Jonathan Goldberg

Jon Goldberg is an energy and power expert focused on how markets, infrastructure, and technologies scale in the real world. Drawing on more than 20 years of upstream, downstream, and power markets experience, he combines climate science rigor with practical insights to advance large-scale decarbonization and clean, firm power.
Founded in 2020, Relae's team of scientists and finance, policy, and market experts, has served 150+ clients globally across carbon dioxide removal, carbon measurement, clean, firm power opportunities, and low-carbon energy solutions. Jon is also the founder of Carbon Direct Capital, a NY-based asset management firm investing in clean energy, decarbonization solutions and related technologies with a science-focused approach.
Prior to Relae, Jon founded and served as Chief Investment Officer of BBL Commodities, a commodity hedge fund. Earlier, he was a partner at Glencore, where he led the firm's US derivatives business ahead of its IPO. He began his career at Goldman Sachs (J. Aron), investing across global macro markets with an emphasis on commodities.
Jon currently sits on the boards of Columbia University's Center for Global Energy Policy and Village Health Works. He is also an advisor to Lawrence Livermore National Lab on negative emissions and the co-chair of SB COP's Nature-Based Solutions Working Group. Jon is a regular lecturer and contributor on energy, power, and climate issues. He graduated from Yale College with a degree in economics.
Board Member, Center on Global Energy Policy at Columbia University

Douglas Bryan

Douglas Bryan
,
Douglas Bryan is an energy economist with a decade of experience across global energy markets, including the US, Canada, Europe and Australia. He specializes in evaluating the impacts of climate policy and investment decisions through advanced energy system modeling.
Douglas has led a diverse range of analyses on utility integrated resource planning, electricity decarbonization policy, and market advisory due diligence. He has extensive experience evaluating the business case for power sector investments and advising utilities on the greenhouse gas implications of long-term load scenarios. Beyond electricity, he has simulated deployment of Carbon Dioxide Removal technologies, including Direct Air Capture, BECCS and Ocean Alkalinity Enhancement, via energy-economy modeling.
A trusted expert in energy system and economic analysis, Douglas previously served as a Senior Project Manager at Navius Research, where he led technical workshops and presented at regulatory tribunals. At Relae, he leverages this background to help clients navigate complex decarbonization efforts. He provides the rigorous analysis needed to quantify the carbon impact of operations and identifies the most effective strategies for integrating low-carbon energy solutions into long-term portfolios.

Liam Kilroy

Liam Kilroy
Liam has a diverse professional background spanning research, energy policy, and data analysis. He brings a cross-functional approach to researching and developing customer solutions, and providing analysis on an ever-evolving energy sector. Before joining Relae, he worked as a Solutions Engineer at an energy policy data SaaS company, where he helped sustainability and energy transition focused customers optimize their policy research and management. Liam has also worked as a Technical Account Manager at a carbon accounting SaaS company, where he helped customers integrate a wide variety of energy and spend data into an emissions accounting platform. In this role, he also worked with product and data services teams to develop new internal tools and external platform features.
- Results are sensitive to the VoLL valuation and modeling assumptions, including: the weather year and frequency/severity of peak demand events; the geographic distribution of new data center load and associated transmission constraints; the proportion of data center energy needs met by co-located generation; and the broader supply-side generation mix assumed for ERCOT.
What to Read Next
The AI Bubble Debate Misses the Point: The Bottleneck Is Physical
Key Takeaways
- Agentic inference has changed the economics of AI. Tokens are becoming units of work and the economic driver is now the work produced, not token generation. Per-token costs are falling and the willingness to pay for work produced is rising; these two trends compound. This tailwind enhances AI economics and has spillover impacts on all layers of the AI stack.
- The AI infrastructure question has shifted from whether demand will show up to whether the physical stack can scale quickly enough. That stack includes power generation, grid capacity, interconnection, compute, memory, networking, cooling, siting, and community acceptance.
- Carbon Direct Capital and Relae (formerly Carbon Direct Inc.) have a differentiated view because the two entities work across both sides of the constraint: Relae advises hyperscalers and energy buyers on power and grid bottlenecks, while Carbon Direct Capital invests in the technologies that relieve those bottlenecks.
- Carbon Direct Capital sees better risk-adjusted returns investing in the physical foundations of AI, including clean firm power, energy system efficiency, data center efficiency, and inference-optimized compute, rather than chasing late-stage AI application valuations.
A Better Question Than "Is AI a Bubble?"
The most important development in AI economics is agentic AI turning tokens into work, a shift that reframes the bubble debate which dominated investor conversations, sell-side notes, and Chief Information Officer surveys through early 2026. Hyperscalers spent approximately US$380 billion on capital expenditure (capex) in 2025 and have guided to approximately US$720 billion of capex in 2026.¹ Carbon Direct Capital and Relae have worked together to build project-level models for both training and inference facilities to demystify the numbers and understand financial and technical sensitivities. The core finding was that the assets could be bankable using standard assumptions and that the binding constraints were physical, not financial. That conclusion has been reinforced in recent months by new developments.
Concretely, AI is moving from single prompts and answers to multi-step workflows that plan, reason, call tools, verify outputs, and keep state. This shift to inference is the structural successor to training in the initial AI capex cycle; it changes power requirements, time to power, and compute architectures all at once. Goldman Sachs estimates that agentic AI could drive a 24-fold increase, relative to a 2026 baseline, to roughly 120 quadrillion tokens per month globally by 2030 as per-token costs continue to fall. SemiAnalysis makes the same point from another angle: the value of frontier tokens has risen as agentic workflows become useful, while hardware and software improvements have reduced the cost of producing each token.
This does not mean every AI company is attractive, every data center project works, or every valuation is justified. It means the easy bubble framing is missing the more investable question. If token demand is compounding and the unit value of work produced is rising, the scarce resource is not abstract enthusiasm. It is the physical infrastructure required to turn that demand into work produced.
The Data Center Model Still Matters, But the Box is not a Black Box
Our internal modeling for an illustrative 167-megawatt inference data center using Nvidia Blackwell graphics processing unit (GPU) servers suggests the potential for high-teens percent equity returns under a defined set of assumptions.² We built a bottom-up underwriting, beginning with the number of users served per inference data center, assuming approximately how many tokens they will demand daily, and translating that token demand into compute needed based on industry-standard quantization and utilization rates. We then inferred the number of GPUs and servers needed to achieve the desired compute, which ultimately drove the total invested capital and power demand based on assumed thermal power designs and power usage effectiveness (PUE). On the revenue side, we used GPU-as-a-service rental rates as one proxy for the market value of compute capacity. A hyperscaler would not rent scarce compute externally if it had higher-value internal demand for that same capacity. As we will detail below, GPU rental prices have been steadily increasing on the back of inflecting inference demand.
This model is not the entire argument; it is the starting point. An important lesson is that power cost alone does not break data center economics. Electricity is slightly over 10% of total costs in our model: a 50% increase in power price reduces equity-level returns by less than 2%. Access to power, speed of interconnection, and equipment availability matter more. In other words, the economics of the model facility are workable, but only if the facility can be built and powered on the timeline customers need.
That is where most AI commentary remains too superficial. It treats the data center as a black box: capex goes in, tokens come out. That misses the bottlenecks inside and around the box. AI racks are moving far beyond traditional cloud power density. Cooling is shifting from air to liquid and two-phase systems. Networking and high-bandwidth memory become binding constraints in inference architectures. Grid interconnection queue wait times stretch to years. Communities can and do block projects. The technical, physical, and political constraints are increasingly the drivers of potential returns.
Inference Makes the Constraint Structural
While training is episodic, inference is recurring. A training run can be delayed, accelerated, or redesigned. Inference happens every time a user asks a question, a developer runs an agent, a business automates a workflow, or an application calls a model in the background. Agentic inference multiplies that load because one user action can become many model calls, validation loops, and memory reads; industry benchmarks show that agentic systems consume 5–30 times more tokens than a standard chat interaction.
Inference demand is also resilient in both directions. If efficiency gains lower the cost per token, more workflows become economic and total token consumption rises - the classic Jevons Paradox. However, token prices do not necessarily need to fall for inference spend to grow. As the economic unit shifts from tokens generated to work produced, customers may pay more per token when an agent delivers work produced that is worth more than the inference cost. Regardless of token price, tokens must all route through the same physical bottlenecks and we are seeing an increase in inference demand.
The architecture of inference is also changing. Some workloads will prioritize low-latency answers. Others, especially agentic work without a human waiting on every token, will prioritize memory, state, context, and cost per completed task. That means the AI infrastructure stack will become more heterogeneous, not less: XPUs (specialized AI accelerator chips), custom silicon, photonics, memory hierarchies, and edge or regional deployment models will all matter. The pricing data shows demand for more AI infrastructure overall: on-demand GPU rental capacity is effectively sold out across all chip generations in early 2026, with one-year Hopper H100 contract pricing rising 15–20% month-on-month through March 2026 and Blackwell B200 rental rates up 23% in March alone. When rental rates rise into a wave of new chip supply, supply is not catching up to demand.
Power Is Not One Constraint, It Is Several
Saying "AI is power constrained" is true, but not specific enough. The real problem has several layers. First, data centers need more electricity than many local grids can deliver on hyperscalers' timelines. Crucially, some grids can supply sufficient power but not continuously for 8,760 hours per year, conflicting with traditional assumptions about service reliability and leading to novel strategies around flexibility and intermittent self-supply. Second, the grid must be able to absorb large, fast-moving computational loads without creating reliability risks. Third, customers need energy procurement strategies that satisfy cost, reliability, climate, and public-acceptance requirements. Fourth, projects must get built in real communities, through real interconnection processes and real permitting fights. Power is not simply a commodity to purchase. It is an infrastructure development problem.
This is where Relae is directly relevant. Relae has assembled a team of scientific, engineering, and market experts to support a paying power and energy advisory practice serving hyperscalers, energy buyers, and power producers. Its work answers the questions customers are asking before the market prices them: how to get more capacity out of existing physical grid infrastructure; how to assess the costs and value of load flexibility through advanced modeling capabilities; how to make clean firm generation bankable; how to reduce data center energy intensity; how to validate "bring your own power" and "bring your own compute" structures; and how to build projects that communities will accept.
In the last twelve months alone, Relae has supported hyperscalers on bankability assessments for next-generation geothermal, scoped load-flexibility programs for multi-hundred-megawatt, single-customer sites, and modeled the carbon and reliability profile of "bring your own power" configurations against grid-tied baselines. Carbon Direct Capital leverages our network of technical experts at Relae, including power engineers, geologists, and electrochemists, to conduct credible technical diligence and to gain insights into early stage market trends and emerging preferences.
What Carbon Direct Capital Is Investing Behind
Our investment focus follows the bottlenecks. On the power side, we are investing in technologies that can deliver reliable power on AI timelines. Sage Geosystems is a next-generation geothermal platform with hyperscaler buy-in; Carbon Direct Capital co-led its US$97 million Series B with Ormat Technologies. We could not have made this investment without the deep expertise of the Relae research team which analyzed Sage's technical results to date to help underwrite future project feasibility. ION Clean Energy is a company that retrofits carbon capture technology onto natural gas combined cycle plants to create "blue electrons"; Relae is in active dialogue with multiple large power users on this topic. Carbon Direct Capital is also actively evaluating the enabling picks and shovels around geothermal, nuclear, fuel cells, and more.
On the data center efficiency side, we are investing in technologies that reduce the amount of power required for a unit of AI work. While it is encouraging to see incremental annual gains in chip efficiency, these are scaling far more slowly than compute demand, driving the need for more innovative technological solutions. As one example, a team at Relae helped us understand the fundamental energy consumption requirements of a standard complementary metal-oxide-semiconductor (CMOS) chip, and the potential of all-optical computing as an alternative. This led to Carbon Direct Capital investing in Neurophos, a photonic compute company targeting step-function gains in energy efficiency per chip that are beyond those achievable by existing GPUs. Carbon Direct Capital joined the company's US$110 million Series A alongside Gates Frontier, Microsoft's M12, Aramco Ventures, Bosch Ventures, and others. More broadly, we are studying other layers of the data center technology stack including networking, memory, cooling, and inference-optimized architectures because the next phase of AI infrastructure will not be solved by simply buying more of yesterday's hardware.
The Bear Case Deserves to Be Taken Seriously
There are real risks to the AI boom: Hyperscaler free cash flow can compress if capex grows faster than revenue. Model efficiency gains can reduce the amount of compute required for a given task. Training demand may be more episodic than the market assumes. Local opposition can slow or cancel data center and power projects. Some new data center capacity could become expensive cloud infrastructure competing on price if AI revenue disappoints.
Those risks are why Carbon Direct Capital frames this as an investment in constraints, not in AI enthusiasm. If efficiency improves, inference use cases expand and the bottleneck shifts to deployment, memory, power, and cost per unit of work produced. If training demand slows, inference and enterprise agents still require recurring capacity. If local grids cannot absorb load, technologies that unlock power, reduce energy intensity, or improve flexibility become more valuable. If some AI applications or model developers fail, the upstream physical bottlenecks remain for the rest.
The Investment Conclusion
The AI infrastructure opportunity sits at the intersection of frontier technology risk, project-finance economics, and energy-system engineering. Underwriting this opportunity well requires addressing all three at once; Carbon Direct Capital is built to do just that. The technical team at Relae has a pulse on emerging stakeholder preferences and scientific breakthroughs, understands novel technologies deeply, and is highly experienced in conducting detailed technical diligence to ensure that projects are viable and scalable. Carbon Direct Capital combines these market and technical insights with our commercial underwriting to facilitate new investments. We are not picking AI winners. We are not picking pure energy assets. We are investing in the companies and technologies that have to exist for AI to sustainably scale.
Frequently Asked Questions
Is the AI capex boom a bubble? While valuations vary, token demand and physical infrastructure needs are real and compounding. The correct question to ask is not whether AI is a bubble, but what the binding constraints are. Our modeling shows that constraints are physical, not financial.
What are the real constraints on AI infrastructure growth right now? AI infrastructure growth is constrained by power availability, grid capacity, and interconnection speed, not capital availability.
Why does inference matter more than training for long-term AI power demand? Inference is recurring and grows with AI usage, it is not episodic like training runs.
What is Carbon Direct Capital investing in, and why? We are investing in clean firm power, energy system efficiency, data center efficiency, and inference-optimized compute—the physical bottlenecks rather than application-layer valuations.
Disclaimer
Carbon Direct Capital Management LLC is an investment adviser registered with the US Securities and Exchange Commission (SEC). Registration as an investment adviser does not imply any particular level of skill or training. Additional information about Carbon Direct Capital Management LLC, including our Form ADV Part 2A Brochure, is available on the SEC's website at adviserinfo.sec.gov.
This content is provided for informational purposes only and should not be construed as or relied upon as investment, legal, tax, or other advice. You should consult your own advisers regarding legal, business, tax, and other matters related to any investment. Any projections, estimates, forecasts, targets, prospects, or opinions expressed are subject to change without notice and may differ from opinions expressed by other employees of Carbon Direct Capital Management LLC, its affiliates, investors, portfolio companies and other individuals, groups or entities. Certain information contained herein may have been obtained from third-party sources believed to be reliable; however, Carbon Direct Capital Management LLC makes no representations about the accuracy or completeness of any such information or its appropriateness for any given situation. Any investments or portfolio companies mentioned are not representative of all investments made by funds managed by Carbon Direct Capital Management LLC, and there can be no assurance that any investment will be profitable or that future investments will have similar characteristics or results. Past performance is not indicative of future results. The content speaks only as of the date indicated. This content does not constitute an offer to sell or a solicitation of an offer to buy any security. Any such offering will be made only pursuant to formal offering documents.
Why Behind-the-Meter Power Emissions Belong in Scope 2
Key Takeaways
- Larger power users are securing behind-the-meter (BTM) power to bypass grid constraints, pairing data centers with third-party-owned generation assets that deliver electricity through a private line rather than the grid.
- BTM power arrangements can create confusion about electricity emissions classification: the power users neither own the generating asset nor purchase electricity from the grid, leading some to misclassify those emissions as scope 3 in their corporate GHG inventories. But the GHG Protocol's Corporate Standard is clear: BTM electricity emissions belong in scope 2.
- Misclassifying BTM emissions can create reputational and regulatory risk. Relae can help organizations get this right before the contract closes.
Why Large Power Users Are Turning to Behind-the-Meter Power
Large power users are consuming more electricity due to data center growth and are looking to add capacity faster than the grid can support, which is having a direct impact on corporate emissions. For example, between 2020 and 2024, Microsoft’s location-based scope 2 emissions rose 130%, and Google’s rose 92%, driven almost entirely by soaring electricity demand from AI infrastructure.
To bypass grid congestion and long interconnection queues, many are turning to behind-the-meter (BTM) power. It’s a pragmatic solution to a real supply problem, but it’s opening an urgent carbon accounting question: when the BTM asset is owned and operated by a third party, where should we account for those emissions?
There has been some confusion that has resulted in companies pursuing an interpretation that would place those emissions in scope 3. The GHG Protocol’s Corporate Standard says otherwise, and the stakes of getting this wrong are high.
What Is Behind-the-Meter Power Generation?
Behind-the-meter refers to electricity generated on the power consumer’s side of the utility meter, bypassing the grid, and typically located on or near the site where the power is consumed.
In most BTM arrangements for a data center, a third-party developer builds and operates a generation asset, such as natural gas, geothermal, or renewable energy, and delivers electricity directly to the facility through a private transmission line. There is no utility meter, no grid connection, and no standard energy invoice.
This structure allows companies to access large, reliable blocks of power without waiting years for grid interconnection approvals. Since the company does not own or operate the generation asset and is not purchasing electricity through a conventional utility relationship, this arrangement has created some uncertainty around how to account for the associated emissions.
Can BTM Electricity Emissions Be Classified As Scope 3?
In this scenario, no. The GHG Protocol's Corporate Standard is unambiguous: BTM electricity emissions belong in scope 2, not scope 3. Yet, some companies have been confused about this classification.
There is broad agreement that since the power users do not own or operate the generating asset, those emissions do not belong in scope 1. Divergence starts when we consider that the company is purchasing BTM power, i.e., not from the grid. Since no electricity is acquired from the grid, some argue that rather than accounting for these emissions in scope 2, they are better placed in scope 3, category 8: emissions from leased assets.
The appeal is obvious for BTM power consumers. Scope 3 emissions face less scrutiny from investors, auditors, and regulators who focus most of their attention on scopes 1 and 2. Classifying BTM emissions as scope 3 would reduce near-term pressure to act. However, the GHG Protocol is unambiguous in its stance.
What the GHG Protocol Actually Says
The GHG Protocol’s Scope 2 Guidance states that “organizations must quantify emissions from the generation of acquired and consumed electricity, steam, heat, or cooling (collectively referred to as ‘electricity’).” The method of delivery, whether grid or BTM, does not change the classification.
If a company consumes electricity from a BTM source, the emissions from generating that electricity belong in scope 2. Section 5.4 of the Scope 2 Guidance addresses BTM power generation directly: “the company with operational or financial control of the energy generation facility reports those emissions in scope 1, following the operational control approach, while the consumer of the energy reports the emissions in scope 2.”
This resolves the question completely. The emissions sit in scope 1 if the company has operational or financial control of the asset, or in scope 2 if a third party controls it.
The GHG Protocol’s Corporate Value Chain (Scope 3) Accounting and Reporting Standard reinforces this conclusion. “Category 8 includes emissions from the operation of assets that are leased by the reporting company in the reporting year and not already included in the reporting company’s scope 1 or scope 2 inventories.”
Because BTM electricity emissions are captured by the Scope 2 Guidance, the scope 3 category 8 does not apply.
Get the Accounting Right Before the Contract Closes
The GHG Protocol is unambiguous: behind-the-meter electricity emissions belong in scope 2 for companies that consume, but do not control the generating asset. This means that BTM contract terms are crucial to determining how the emissions will be classified, since the GHG Protocol assigns scope based on who holds operational or financial control of the generating asset.
Companies that move fast on BTM capacity without understanding this distinction risk locking in a scope 1 or scope 2 obligation they didn't anticipate or building a reporting strategy around a scope 3 interpretation the GHG Protocol doesn't support. This can become a reputational or even a regulatory liability that is far harder to address after the contract is signed.
[cta]
Electricity Emissions Accounting: GHG Protocol and LCA Explained
Key Takeaways
- The GHG Protocol Corporate Standard and life cycle assessment (LCA) offer distinct frameworks for measuring electricity-related emissions, one for annual corporate reporting and one for detailed cradle-to-grave analysis, leading to different emissions results.
- Renewable energy certificates (RECs) are accepted under the GHG Protocol's market-based approach to reduce reported scope 2 and scope 3: category 3 emissions, but are not explicitly addressed in ISO LCA standards, where transparent disclosure is essential.
- Using both the GHG Protocol and LCA together, while recognizing their different scopes, boundaries, and purposes, can give organizations a more complete and strategic view of electricity-related emissions and decarbonization opportunities.
Electricity-Related Emissions: Why Measurement Methods Matter
In the era of AI-driven power demand, scrutiny over electricity-related emissions is intensifying. With this increased attention comes growing confusion around how to measure and report these emissions. The GHG Protocol Corporate Standard and life cycle assessment (LCA) are two widely used methods for measuring and reporting electricity-related emissions, but each follows its own complex and often incompatible, set of rules.
This piece will examine the differences between these approaches and answer common questions such as:
- What are the differences between the GHG Protocol Corporate Standard and LCA?
- Why do they result in different emissions for the same type and amount of electricity?
- Can renewable energy contracts reduce electricity-related emissions under both methods?
- When should you use each approach?
Both the GHG Protocol Corporate Standard and LCA are powerful tools that, if used in complementary ways, can help organizations identify emissions hotspots and develop more effective pathways for decarbonization.
What Is the GHG Protocol Corporate Standard?
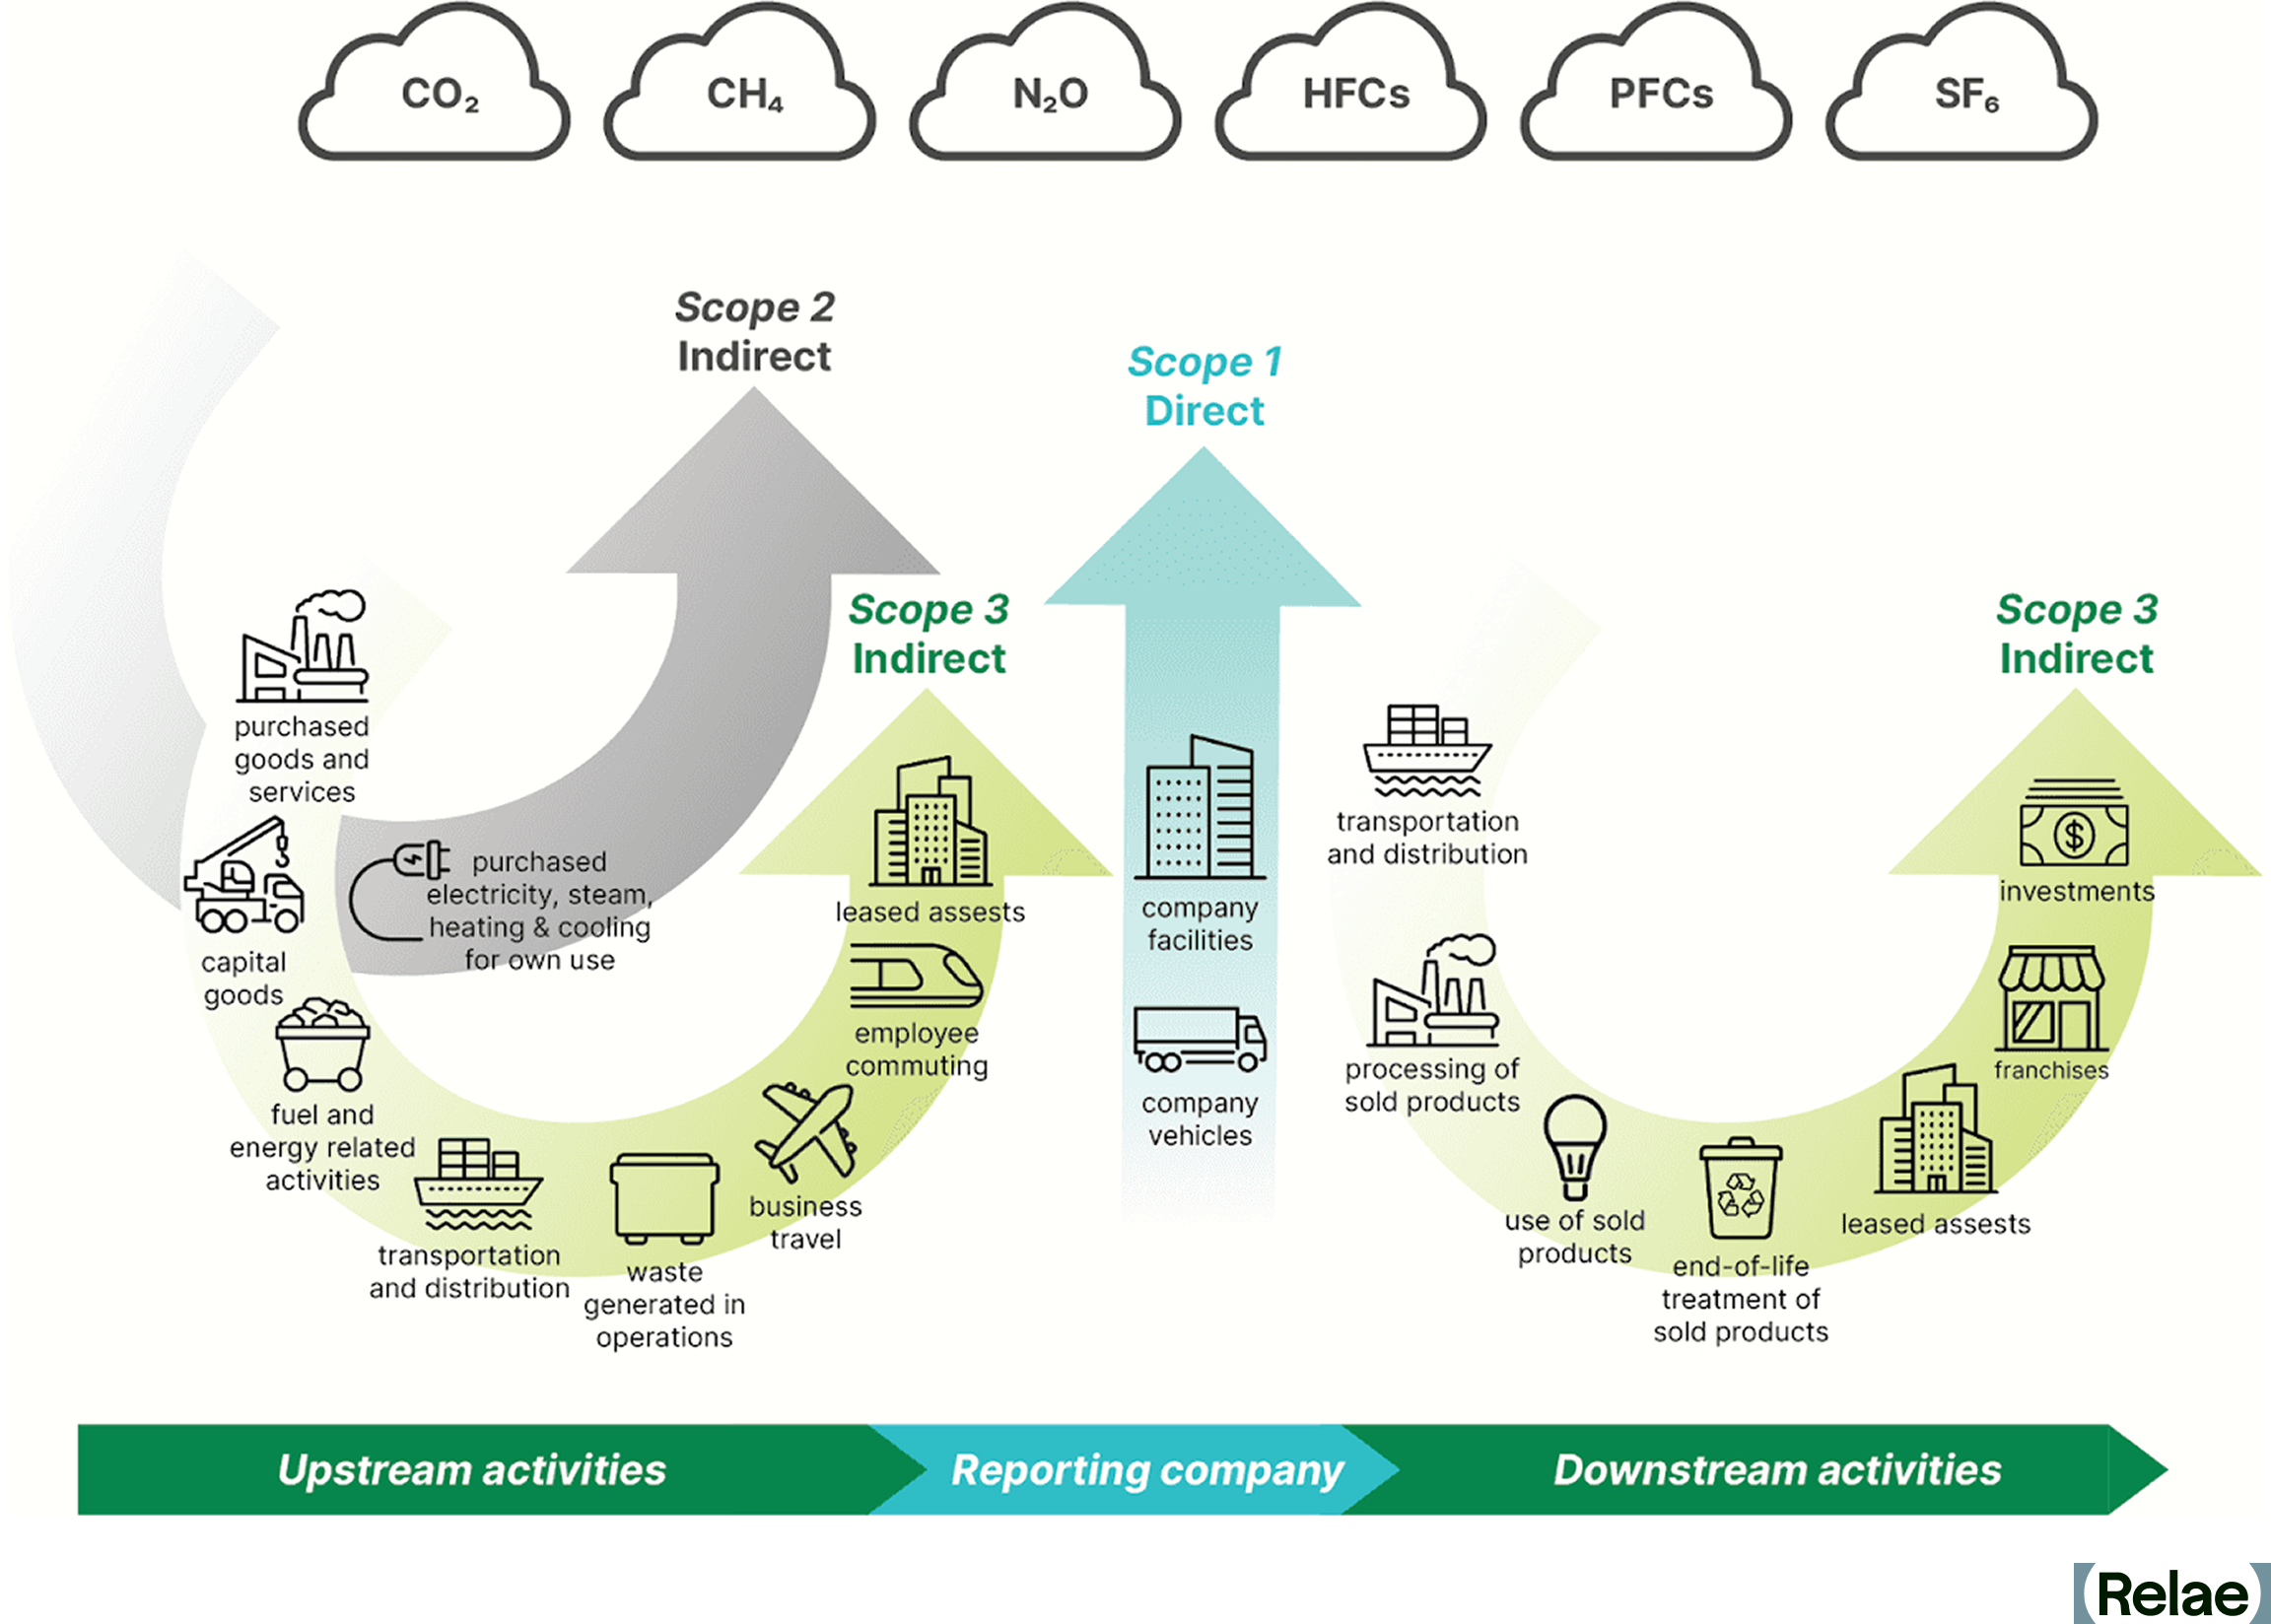
The GHG Protocol Corporate Standard is a globally recognized framework for corporate entities to publicly report GHG emissions throughout their value chain. It divides emissions into three scopes:
- Scope 1: Direct emissions from owned or controlled sources, such as company-owned vehicles, on-site fuel consumption, or industrial processes.,
- Scope 2: Indirect emissions from the generation of purchased electricity, heat, steam, or cooling. These emissions are generated off-site, but result from an organization's energy consumption.
- Scope 3: Indirect emissions across an organization's value chain. Scope 3 is divided into 15 categories, including a company's supply chain activities, business travel, employee commuting, investments, and product life cycle emissions.
This piece focuses on emissions associated with electricity consumed by a reporting entity. These electricity-related emissions primarily fall under scope 2 and scope 3: category 3 (fuel- and energy-related activities, or FERA).
Scope 2: Electricity Generation Emissions
Scope 2 emissions account for the generation of electricity a company purchases or uses. Hypothetically, if a company were powered by a single solar project, it would report zero scope 2 emissions. In reality, a company is powered by a combination of power generation assets and must report them under scope 2 emissions. These emissions can be reported using two methods:
- Location-based method: Reflects the average emissions intensity of the local electricity grid where the consumption occurs. This approach is mandatory under various reporting frameworks and does not take into account a company's procurement choices.
- Market-based method: Reflects an organization's actual procurement decisions and energy-sourcing strategies. It accounts for specific contracts, such as power purchase agreements (PPAs), renewable energy certificates (RECs), and green tariffs, which allow businesses to claim lower emissions from their purchased electricity.
Scope 3: Category 3 FERA
Scope 3: category 3 FERA reports on non-generation electricity emissions associated with:
- Upstream emissions: Emissions associated with the production and transportation of fuels needed for electricity generation
- Transmission and distribution losses: Emissions associated with the loss of electricity while delivering it from the generator to the consumer.
The GHG Protocol Corporate Standard does not include emissions associated with the manufacturing, construction, and end-of-life phases of electricity generation equipment; however, some datasets used for reporting may include manufacturing emissions. While scope 3: category 3 guidance may not require these emissions to be included, if possible, companies reporting on their electricity-related emissions should include these additional sources of emissions in order to more completely represent their total emissions impact. The GHG Protocol Scope 2 Guidance allows for the reduction of some of the reported scope 3 FERA emissions by contracting renewable energy (see Appendix B).
What is an LCA?
An LCA is a systematic method used to quantify the environmental impacts of a process, product, or project throughout its full life cycle. A life cycle includes everything from raw material extraction ("cradle") to manufacturing/production ("gate") through disposal ("grave").
LCAs primarily follow a standard published by the ISO organization (ISO 14040/14044). The ISO standards establish industry-wide rules for which processes are included and how to assign environmental burdens to products.
An LCA can be used for any product, process, or project, and can estimate multiple different environmental impacts (i.e., climate change, human health, ecotoxicity, eutrophication, ozone depletion).
Electricity-Related Emissions Can Be Different Using the GHG Protocol and an LCA
The GHG Protocol Corporate Standard and an LCA (as per ISO standards) generally include different life cycle stages of electricity use when estimating GHG emissions. Therefore, the approaches can result in different reported emissions.
Key Differences in Reporting Electricity-Related Emissions
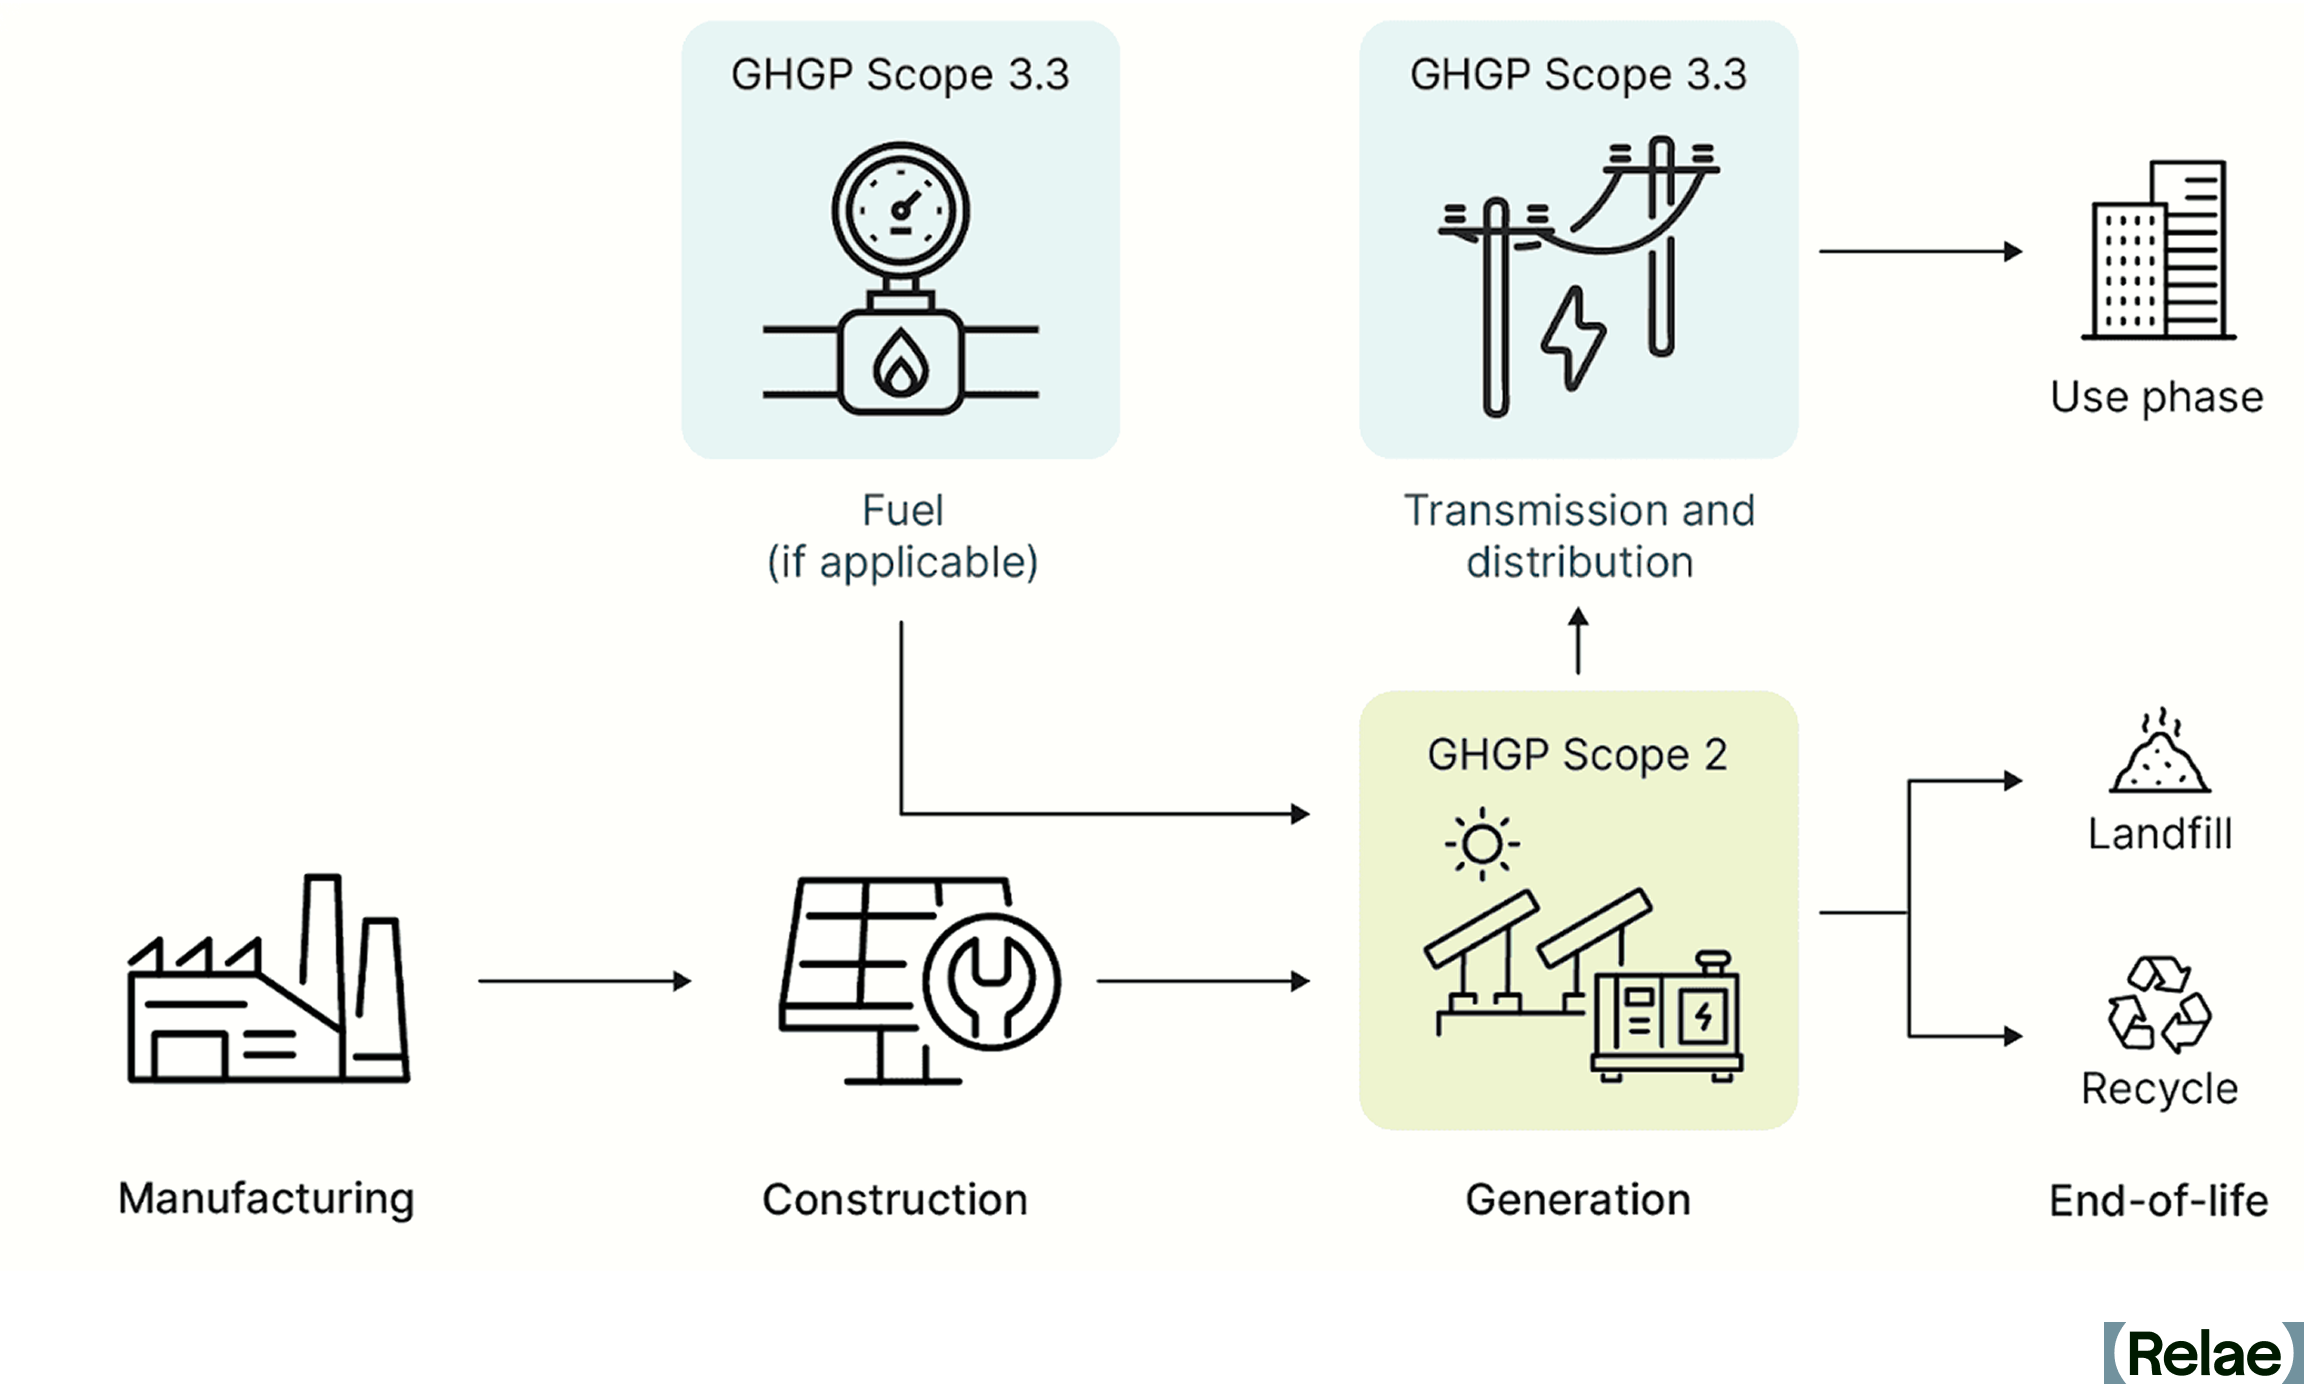
The GHG Protocol Corporate Standard includes emissions in the following phases:
- Generation (scope 2)
- Transmission and distribution losses (scope 3: category 3)
- Fuel, if applicable (scope 3: category 3)
A “cradle-to-grave” LCA considers emissions from all activities associated with power generation, including:
- Manufacturing
- Construction
- Generation
- Fuel, if applicable
- Use-phase, if applicable
- End-of-life
Use-phase electricity-related emissions are emissions generated by electricity-consuming equipment used or sold by the reporting company (representing additional scope 1 or scope 3 emissions, respectively). Examples include sulfur hexafluoride (SF6) emissions from electrical transformers or refrigerant leakage from air conditioners with high global warming potential. Please note that both the ISO and GHG Protocol Corporate Standard provide guidelines for reporting these emissions. However, due to the equipment-specific nature of these emissions, they are excluded from the following table. The table compares electricity-related emissions associated with different electricity sources using the GHG Protocol Corporate Standard approach and the LCA approach.
Reporting Electricity-Related Emissions
* US average transportation and distribution loss rate (4.2%) times US average grid carbon intensity (410 gCO2e/kWh). Note: gCO2e/kWh = grams of carbon dioxide equivalent per kilowatt-hour. Source: GREET 2024 (US grid average. 10% fuel- and energy-related activities; 1% construction, facilities, maintenance, and end-of-life; 89% fuel combustion).
Reducing Electricity Emissions with Renewable Energy
Renewable Energy Mechanisms Under the GHG Protocol
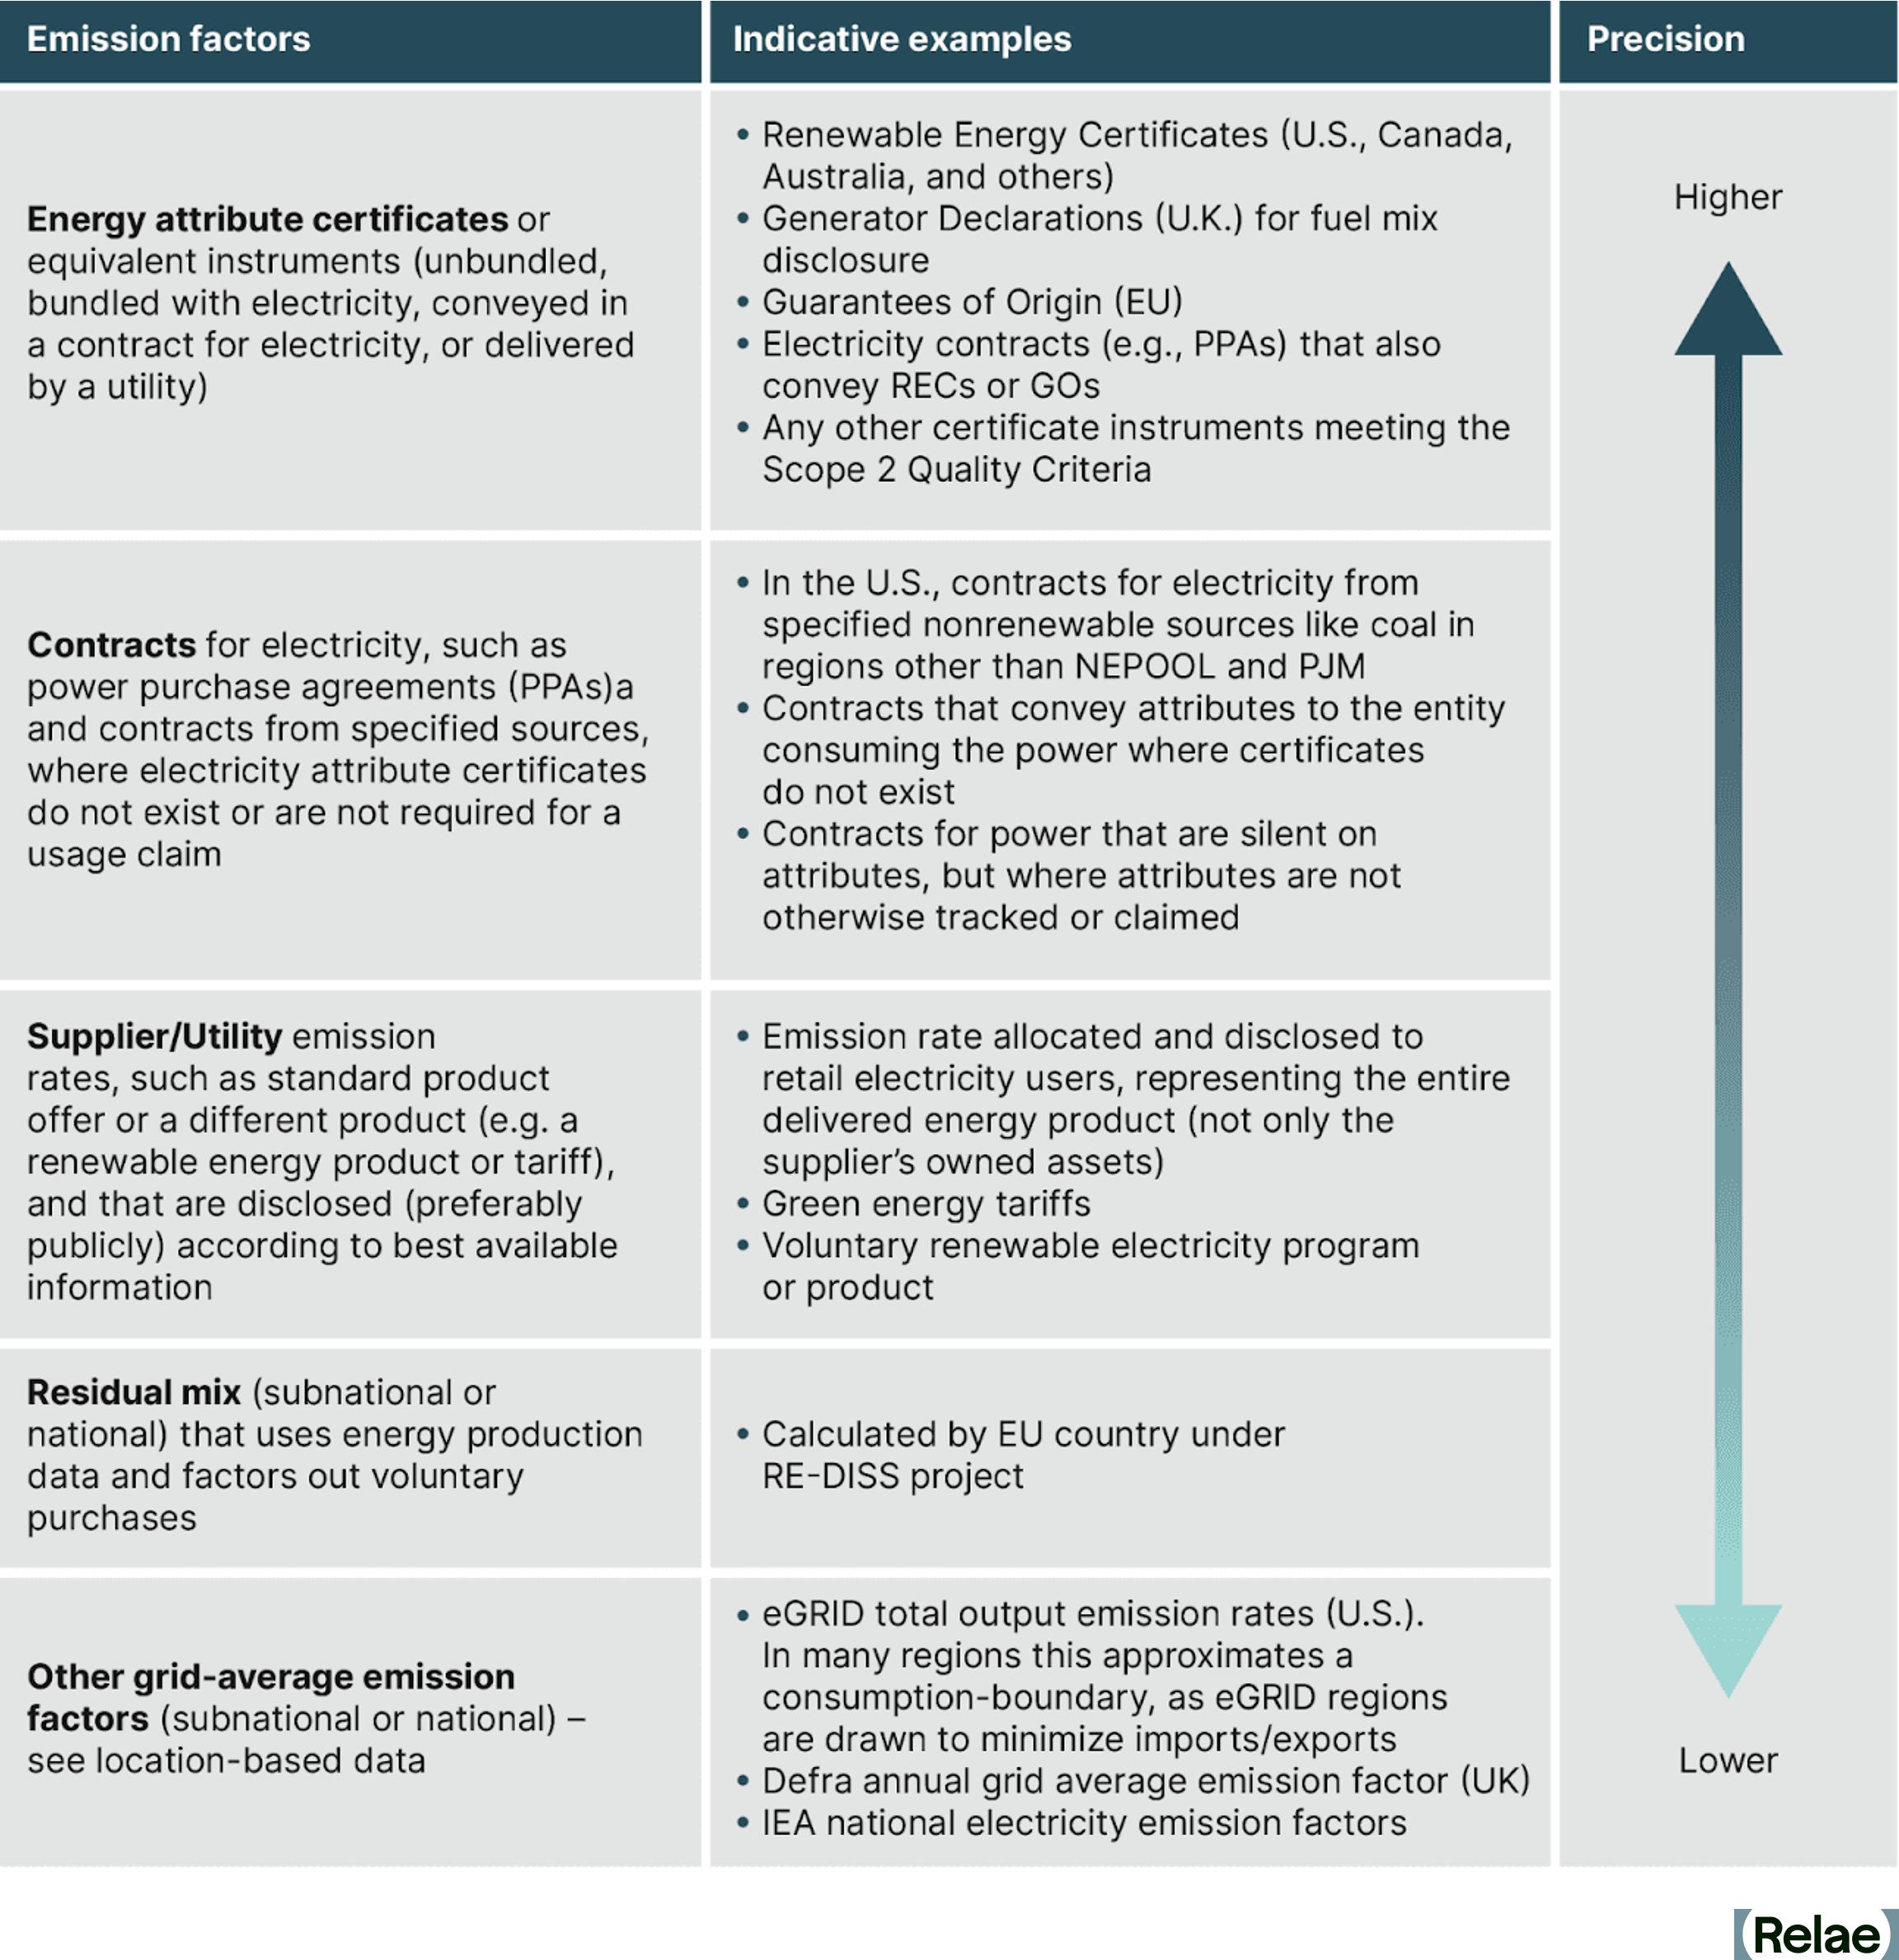
The GHG Protocol Corporate Standard allows companies to contract for renewable electricity as a mechanism to reduce reported emissions. The GHG Protocol Corporate Standard defines allowable energy contracts that can be used to reduce emissions associated with electricity consumption (market-based reporting).
In North America, one of these allowable contracts is RECs, each of which represent one megawatt-hour of renewable generation. Analogous instruments used in other locations, such as Guarantees of Origin in Europe and green electricity certificates in China, are also permissible under the GHG Protocol Corporate Standard.
RECs were developed as a contractual mechanism for renewable electricity in response to the fundamental structure of "a power grid." In a power grid, it is impossible to link a single generator to a single load. Power is injected at a point in the grid and withdrawn at a different point in the grid; there is no traceable pathway.
RECs were created to track the attributes of electricity generation entering into a power grid for the entity that consumes the power at a different point. The GHG Protocol Corporate Standard allows buyers to claim exclusive use of renewable electricity with RECs even if they are actually consuming a mixture of electricity from the grid.
Renewable Energy Mechanisms Under the LCA ISO Standard
The ISO 14040 standard does not address the use of renewable electricity contracts. However, the ISO 14044 standard provides the following guidance:
"When determining the elementary flows associated with production, the actual production mix should be used whenever possible, in order to reflect the various types of resources that are consumed. As an example, for the production and delivery of electricity, account shall be taken of the electricity mix, the efficiencies of fuel combustion, conversion, transmission and distribution losses."
It does not explicitly define whether RECs can or cannot be used in the determination of the "actual production mix." In the event an organization does procure a renewable energy contract to reduce the emissions reported within the LCA, it should disclose that clearly in order to communicate the impact of the contract on the carbon intensity of the LCA with and without the use of RECs.
Powerful Tools for Different Use Cases
The GHG Protocol Corporate Standard and LCAs following the ISO Standard are both powerful tools that can provide insight into emissions associated with electricity use. The GHG Protocol Corporate Standard allows companies to use a standardized framework to report emissions associated with electricity use and interventions on an annual basis. The LCA ISO standard is a detail-driven analysis that allows a deep dive into specific processes, projects, or products. This detailed analysis allows for deeper insights into areas where a company may have more ability to address specific interventions for emission hot spots. Using these tools together, while understanding the boundaries of each, can provide companies with a more effective and impactful approach to decarbonization.
Frequently Asked Questions
What are the differences between the GHG Protocol Corporate Standard and LCA?
The GHG Protocol is an annual corporate reporting framework covering scope 2 (generation) and scope 3: category 3 (transmission and distribution losses, fuel), while a cradle-to-grave LCA is a detailed analysis governed by ISO 14040/14044 standards that also includes manufacturing, construction, use-phase, and end-of-life emissions. LCA can also be applied to any product or process and multiple environmental impacts, not just greenhouse gas emissions.
Why do they result in different emissions for the same type and amount of electricity?
They include different life cycle stages. The GHG Protocol excludes manufacturing, construction, and end-of-life emissions of generation equipment, while an LCA includes them.
Can renewable energy contracts reduce reported electricity-related emissions under both methods?
Under the GHG Protocol, renewable energy contracts (e.g., RECs, PPAs) are explicitly allowed to report zero market-based scope 2 emissions, though scope 3 FERA emissions remain. Under ISO LCA standards, these contracts aren't explicitly addressed. Organizations may choose to apply them, but should transparently disclose LCA results both with and without the contract's impact.
When should you use the GHG Protocol vs an LCA?
Use the GHG Protocol for standardized, annual corporate-wide emissions reporting and tracking procurement interventions; use an LCA for a detailed, process- or product-specific deep dive to identify specific emissions hotspots. Relae recommends using both together for a more complete, strategic view of electricity-related emissions.
From Capture-Ready to Capture-Committed: Decarbonizing Natural Gas with CCS
Key Takeaways
- Data centers are driving surging demand for new, firm electricity supply, accelerating natural gas-fired power generation.
- Carbon capture and storage (CCS) offers a practical way to balance long-term climate commitments with the need for new electricity generation in the near term.
- New natural gas-fired power plants must be capture-committed, not just capture-ready, potentially delivering power in 18 months and decarbonized power 18-24 months later.
- Capture-committed plants integrate planning and finance for the CO₂ capture, transport, and storage value chain from the start.
- Relae believes early investment in engineering, infrastructure, and community engagement is essential to meet capture commitments.
A New Era of Electricity Demand and Climate Pressure
The US and much of the developed world are experiencing profound growth in electricity demand. Two main forces are driving this trend: (1) the push to electrify existing uses, such as vehicles and heating, to improve energy security, enhance system efficiency, and reduce air pollution; and (2) the growth of energy-intensive sectors like manufacturing, telecommunications, and AI data centers.
Among these drivers, AI is creating unique demands that catalyze specific investments in electric power generation. Astonishing AI data center buildout, led by a handful of large technology firms (sometimes called “hyperscalers”) and their utility and construction partners, is accelerating energy consumption. These firms prioritize speed. When asked for their top five criteria for bringing new AI infrastructure online, one executive responded: “Speed, speed, speed, cost, and carbon emissions.”
Data centers require reliable, always-on power (referred to as “firm power”). This differs from other use cases, such as residential or commercial, which do not need the same amount of power across all hours. While hyperscalers and their partners are investing in renewables, nuclear, and geothermal energy at a remarkable pace, renewable resources alone do not yet meet the exploding demand for firm power.
Natural Gas Provides Firm Power but Drives Emissions Higher
The mismatch between data center power needs and variable renewable generation is fueling a boom in natural gas-fired power generation. The pipeline of new natural gas-fired power plants is enormous. Plants under construction in 2025 would, by themselves, add roughly 25 million tonnes of greenhouse gases each year to the air and oceans. The full suite of plants in planning is at least 10 times larger. Existing gas plants are also being used more and staying online longer.
.png)
This rapid buildout is creating tension with corporate climate goals. Hyperscalers remain seriously committed to reducing emissions, but their ability to hit those targets is undermined by the need to procure new, large-scale electricity generation quickly.
Carbon Capture Aligns with Data Center Energy Demands
Carbon capture and storage is one way to bridge the gap. Data centers operate continuously and may have the ability to shift or curtail load. This demand profile suits the duty cycles of natural gas turbines and CCS facilities well. The potential to reduce direct emissions is profound: today’s CCS technology can capture 95% or more of CO₂ emissions at competitive costs in many markets.
This has led to a resurging interest in the concept of capture-ready gas power generation. New natural gas power plants can be built and brought online in 18 months. In a capture-ready plant, the developers integrate the necessary interfaces and reserve additional land, water, and energy to enable a carbon capture project to be built at a future date. In favorable locations, carbon capture can be added to a capture-ready plant in 18-24 months.
However, past experience shows that capture-ready plants rarely deliver. The ambition and commitment of the developers were contingent on policy and market signals that were either too small or never materialized. While the base plant may have made economic sense in terms of energy value for investment, it does not appear anyone was willing to pay the climate premium for CCS.
As David Hawkins of the Natural Resource Defense Council famously said, “If your plant is capture ready, my driveway is Ferrari ready.” To bring David’s humorous analogy back to the specifics here: don’t build a new driveway without at least a downpayment on the car.
How to Build Capture-Committed Power Plants for CCS
A better approach is building capture-committed plants, namely facilities that integrate CCS from the start. To be capture-committed, project developers must:
- Identify geologic storage for the many millions of metric tons of CO2 that these plants will produce each year over the next 20-30 years.
- Plan reliable CO₂ transportation from power generation to geologic storage by pipeline, rail, barge, or truck.
- Engage credible vendors of carbon capture technology that serve their needs and fit their goals.
- Fund front-end engineering design (FEED) studies.
- Arrange, or help to arrange, financing for the construction, commissioning, and operation of all necessary components in the CO₂ capture, transportation, and storage value chain.
- Ensure natural gas supply has near-zero fugitive methane emissions.
- Partner with local and frontline stakeholders to incorporate community impact into project planning, design, and financing.
Capture-committed plants send strong market signals. They help build the permitting pathways and develop the workforce, infrastructure, and community acceptance needed to avoid extra expense and delays. Done well, early commitments and investments will likely create repeatable models that reduce build times and costs.
A Path Toward Power That’s Clean Firm and Future-Ready
Eventually more carbon-free power in the form of renewables, nuclear, and geothermal energy will be deployed to serve national and international electric load growth for all types of electrification. Over time, these resources will likely displace natural gas. Until then, hundreds of millions of tons of CO₂ will be emitted each year unless commitments are made to take tangible action now.
Capture-committed natural gas-fired plants offer a pragmatic solution. With the right planning, financing, and community engagement, they can provide reliable power without locking in emissions, and they can deliver enormous benefits compared to uncontrolled operation. Federal and state governments can accelerate this transition by honoring and increasing CCS grants, supporting shared infrastructure, and streamlining permitting for CCS plants as they have for other clean energy supplies. These investments will enable the construction of cleaner, more resilient power infrastructure for the industries driving demand, from AI data centers to heavy industry.
[cta]
Frequently Asked Questions
What is the difference between a capture-ready and a capture-committed power plant?
A capture-ready plant creates an option to add carbon capture in the future, whereas a capture-committed plant treats capture as part of the project from day one. In a capture-ready plant, developers install the right interfaces and reserve extra land, water, and energy, but nothing obligates them to build the capture project, ever. A capture-committed developer secures options for CO₂ transportation and geologic storage, relationships with capture equipment vendors, funding for engineering studies, and financing across the full value chain before the base plant comes online.
Why have capture-ready plants historically failed to add carbon capture?
Nobody was willing to pay the climate premium. Capture-ready developers built plants that made economic sense on energy value alone, then waited for policy and market signals to justify carbon capture. Those signals were either too weak or never arrived, so the option went unexercised and no capture project was ever designed. The base plant runs uncontrolled for decades while the reserved land sits empty. David Hawkins of the Natural Resources Defense Council captured the problem well: "If your plant is capture ready, my driveway is Ferrari ready." Preserving an option costs very little. Exercising it costs a great deal, and capture-ready facilities rarely came with the funding to do so.
If renewables, nuclear, and geothermal will eventually displace gas, why invest in CCS for gas plants now?
Because greenhouse gas emissions happen in the meantime. Gas plants being built today will operate for 20 to 30 years, long before carbon-free resources scale enough to displace them. Left uncontrolled, they will emit hundreds of millions of tons of CO₂ over that span. Capture on those plants avoids most of it. Today's technology can capture 95% or more of CO₂ emissions at competitive costs in many markets.
What can federal and state governments do to accelerate capture-committed projects?
Three kinds of support matter most: funding, infrastructure, and permitting. Governments should honor and extend existing CCS incentives. Developers make capture commitments years before any revenue arrives, so uncertainty in government funding undermines the confidence these projects require. Governments should also support shared CO₂ transport and storage infrastructure. Common pipelines, rail terminals, and storage hubs make it easier for developers to secure physical CO2 offtake. Finally, permitting for CCS should be streamlined the way it has been for other clean energy supplies. Permitting delay is a leading cause of cost overruns, and a capture-committed plant should be able to pursue capture and storage with the same intensity and speed as electricity generation.
Shifting Playbook for Corporate Power Procurement
Key Takeaways
- The Greenhouse Gas (GHG) Protocol’s proposed scope 2 revisions would shift many large power buyers from annual renewable energy certificate (REC) accounting to 24/7 hourly matching and reveal a larger emissions gap than most inventories currently report.
- Of all the US grid regions modeled, the emissions gap between annual and 24/7 hourly matching is widest in PJM Interconnection (PJM) and the Electric Reliability Council of Texas (ERCOT), the markets where data center load is growing fastest.
- Relae's modeling quantifies the shift from annual to 24/7 hourly matching: serving a 4-gigawatt (GW) data center load at 100% hourly carbon-free energy requires 9.6 GW of additional clean capacity in ERCOT and 10.5 GW in PJM, a roughly 800-megawatt premium in PJM that translates directly into cost and siting strategy.
- Closing that gap requires investments in clean, firm generation technologies, like natural gas with carbon capture and storage (CCS), battery storage, and geothermal. The optimal mix varies by market and load profile, which means modeling current and future emissions positions under 24/7 accounting to understand the best procurement options for a specific portfolio.
Annual REC Accounting No Longer Holds at Data Center Scale
For years, large corporate energy buyers have relied on a straightforward approach: purchase renewable energy certificates (RECs) or sign virtual power purchase agreements (VPPAs) to offset market-based scope 2 emissions. Under the current GHG Protocol guidance, these instruments allow companies to claim low or zero emissions regardless of when or where clean energy is actually generated. When corporate clean energy demand was modest, this fueled new renewable project development while aggregate grid emissions were trending down.
That approach worked, until now. Energy demand from data centers and hyperscalers is surging. The Federal Energy Regulatory Commission (FERC) reported more than 50 GW of data center capacity operating in the US at the end of 2025, much of it concentrated in regions where local clean generation cannot keep pace. When corporate clean energy demand was modest, the gap between contractual claims and physical generation was small enough that few questioned this argument. At hyperscaler levels, with load concentrated in a handful of grids, that gap is becoming too large to ignore.
From a climate perspective, well-designed renewable procurement has created real impact by channeling corporate capital into new clean generation, and reducing CO2 emissions anywhere to benefit the climate everywhere. From a grid perspective, power consumption and generation must balance in real time, and the flow of electricity is constrained by the physics of the transmission system. Some regulators, investors, and standard-setters argue that corporate clean energy claims should be grounded in this second, engineering perspective rather than the first. The GHG Protocol's proposed revisions reflect that view, and would force buyers to defend their claims against it.
Relae’s modeling of this 24/7 framework in PJM and ERCOT helps quantify its costs and emissions implications in the markets where the stakes are highest.
What Does 24/7 Hourly Matching Mean for Scope 2 Accounting?
The biggest proposed change to the GHG Protocol’s current Scope 2 Guidance is the move from annual power reporting and matching to a 24/7 approach. Instead of calculating emissions with an annual emissions factor (EF) based on their independent system operator (ISO) or eGRID region for each megawatt-hour (MWh) consumed, companies would need to use hourly-specific EFs.
Companies would still be able to retire RECs to reduce their market-based emissions. However, companies would need to show that these RECs came from clean energy that was generated on the same grid, in the same hour as their facilities consumed power. This makes annual, location-agnostic REC retirement, currently the dominant practice, insufficient for 24/7 market-based accounting.
Both the time restriction (hourly matching) and the location restriction (generation on the same grid as consumption) will make it more difficult for companies to retire RECs. For example, because today's methodology is location-agnostic, a New York-based company can retire RECs from a Texas wind farm (purchased unbundled or via a VPPA) to reduce its reported market-based scope 2 value. This has allowed renewable development to follow the best resource sites rather than the load. Similarly, the time of day that the wind farm generates energy is irrelevant, as long as it is approximately in the same calendar year.
Under the proposed revisions, retiring these RECs would no longer be acceptable for the New York company, since they would fail both location- and hourly-matching requirements. As a result, companies with large REC portfolios today may no longer be able to retire them in order to reduce their market-based scope 2 emissions, if the proposed revisions take effect. These companies may face significant unmatched consumption under 24/7 accounting, especially during evening peaks or grid stress events when fossil-based generation fills the gap.
Annual Matching vs 24/7 Hourly Matching
The figure below illustrates the gap between what a representative large buyer reports under the current annual location- and market-based methodologies, versus what an hourly 24/7 analysis reveals.
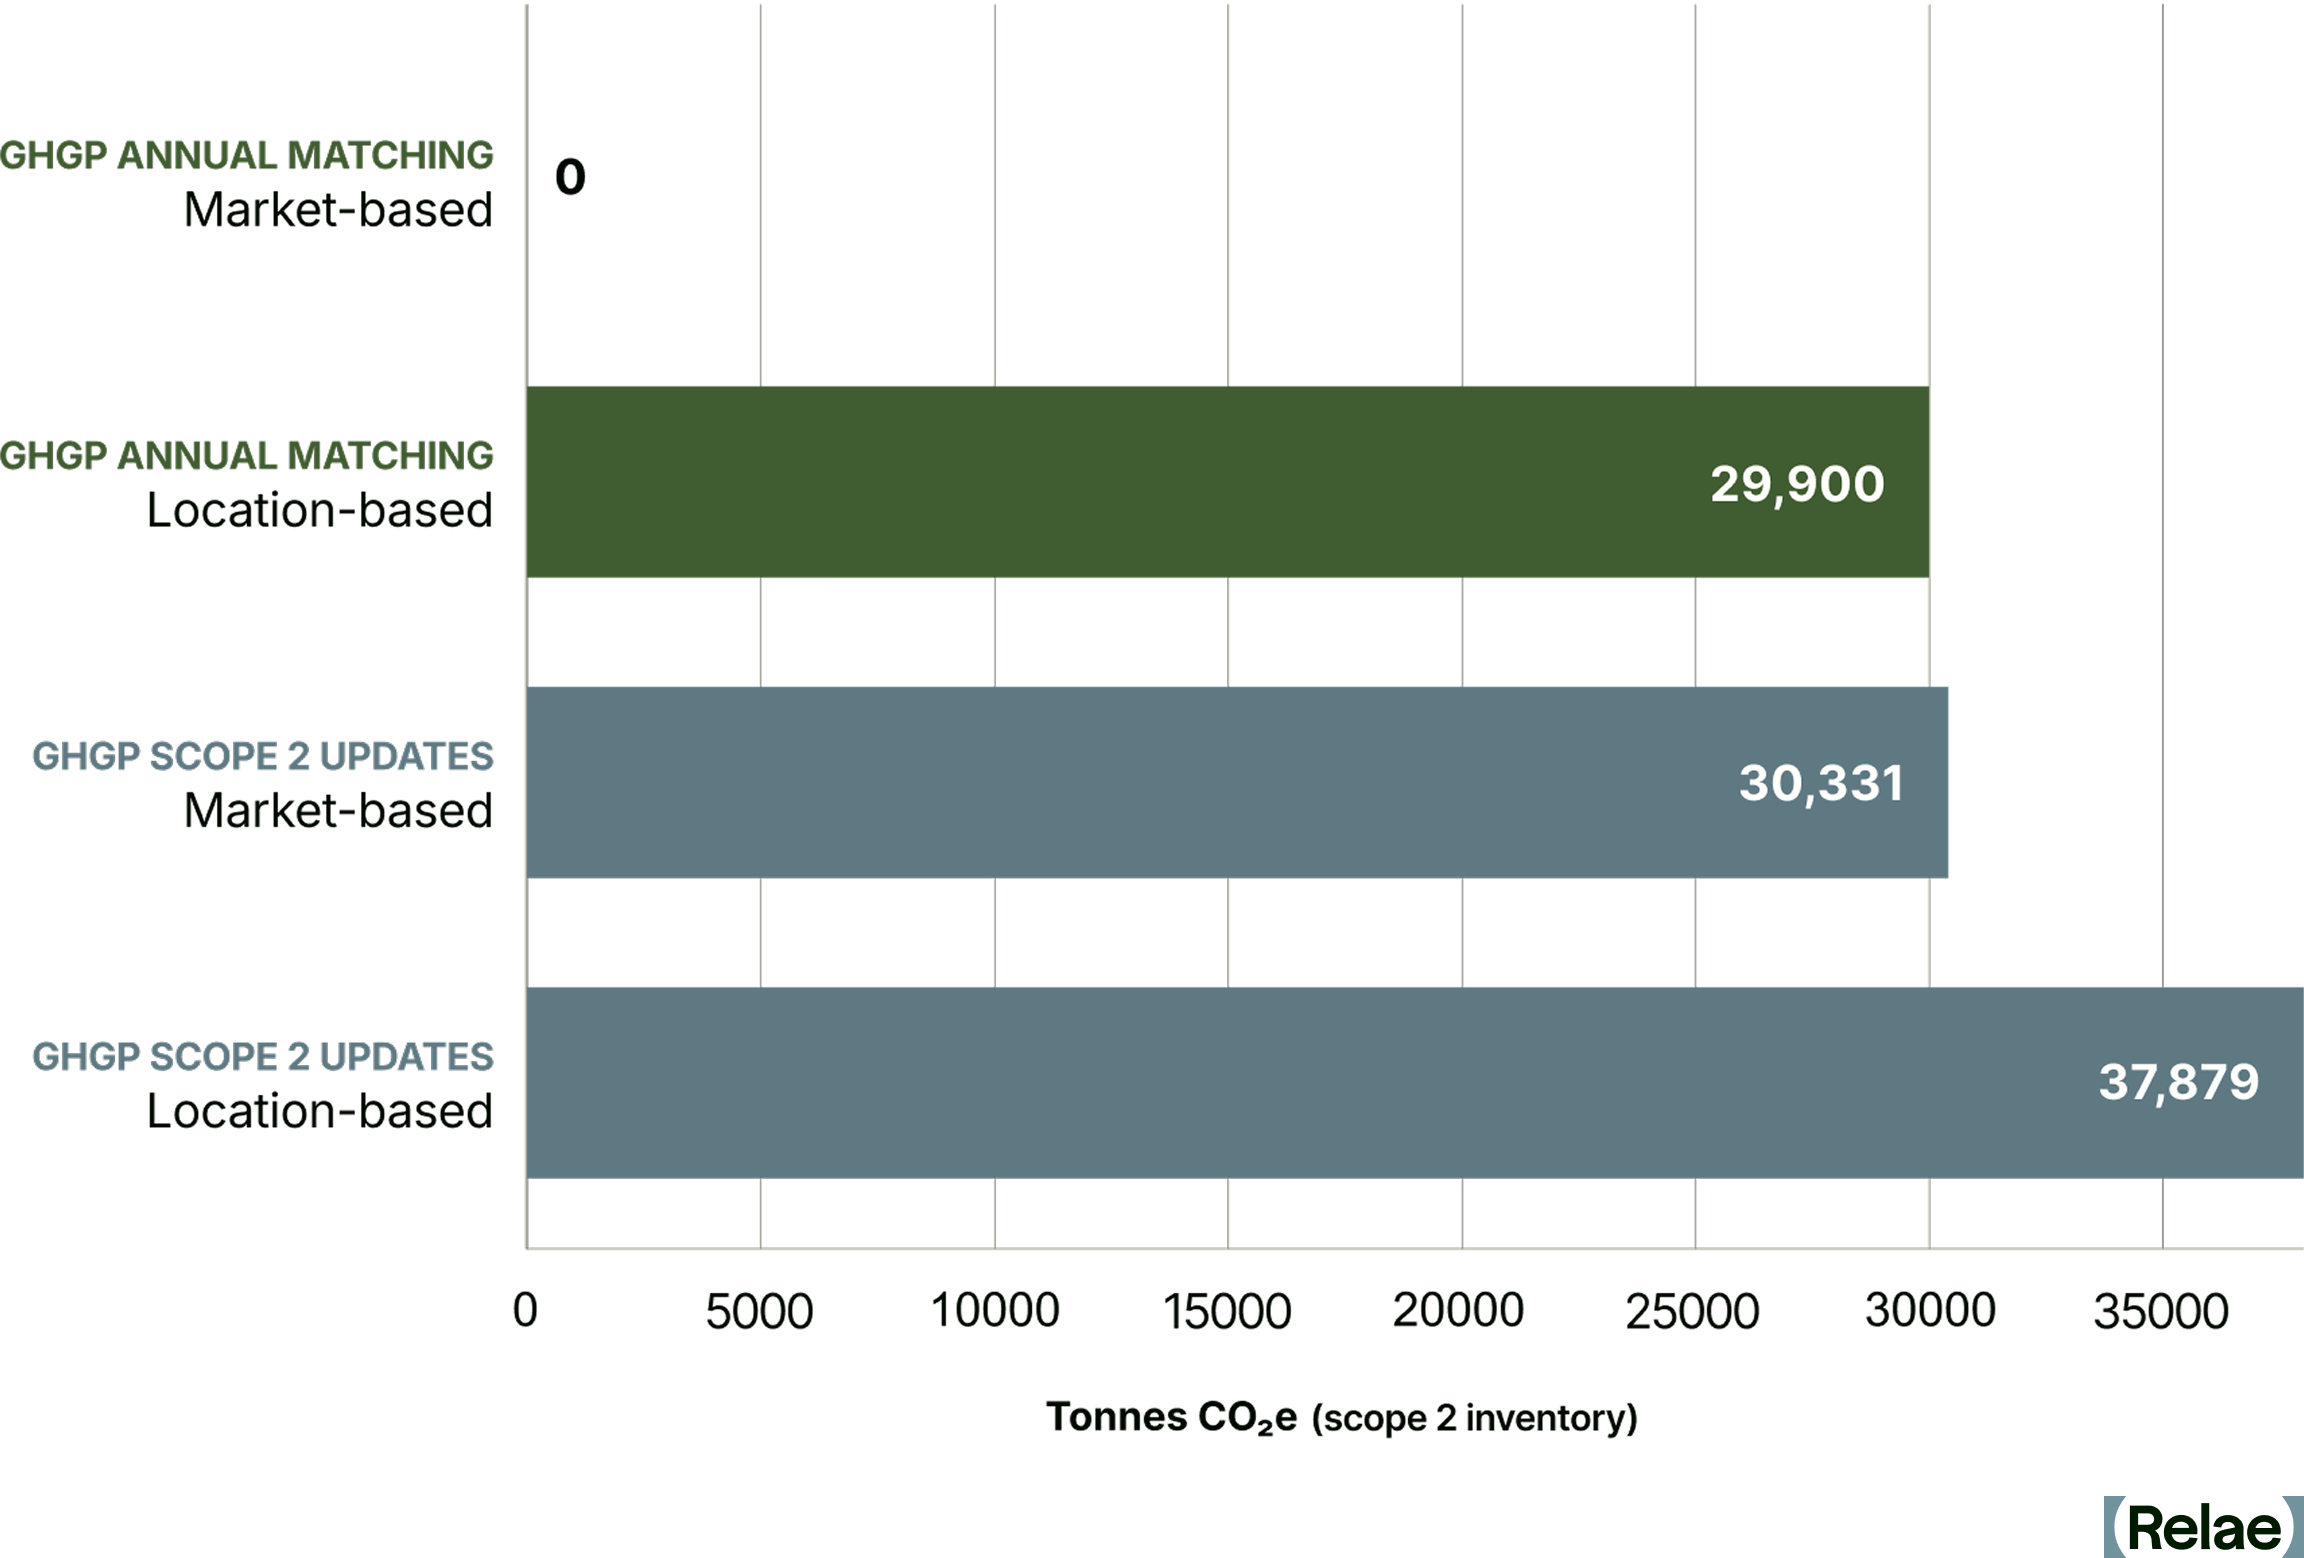
Understanding this emissions gap is the essential first step for buyers to make informed decisions about which instruments to retain, which contracts to renegotiate, and where new investment will matter most. If the proposed scope 2 revisions are enacted, companies procuring clean energy will be disincentivized from buying RECs sourced from variable renewables in distant locations, and instead will find it more favorable to invest in same-grid clean, firm generation, such as geothermal, nuclear, and renewables plus storage. RECs from these projects would qualify to be retired against market-based scope 2 emissions under the proposed revisions, where today's distant-wind or off-peak-solar RECs would not.
Where Pressure Is the Highest: ERCOT and PJM
Two markets stand out for projected hyperscaler load growth: PJM, which covers the extended mid-Atlantic region, and ERCOT in Texas. Both are on track to absorb massive increases in data center demand over the next decade, and both expose the limits of annual REC accounting in ways that will be hard to ignore under the new proposed framework.
PJM: 60% Fossil Generation Means High Marginal Emissions
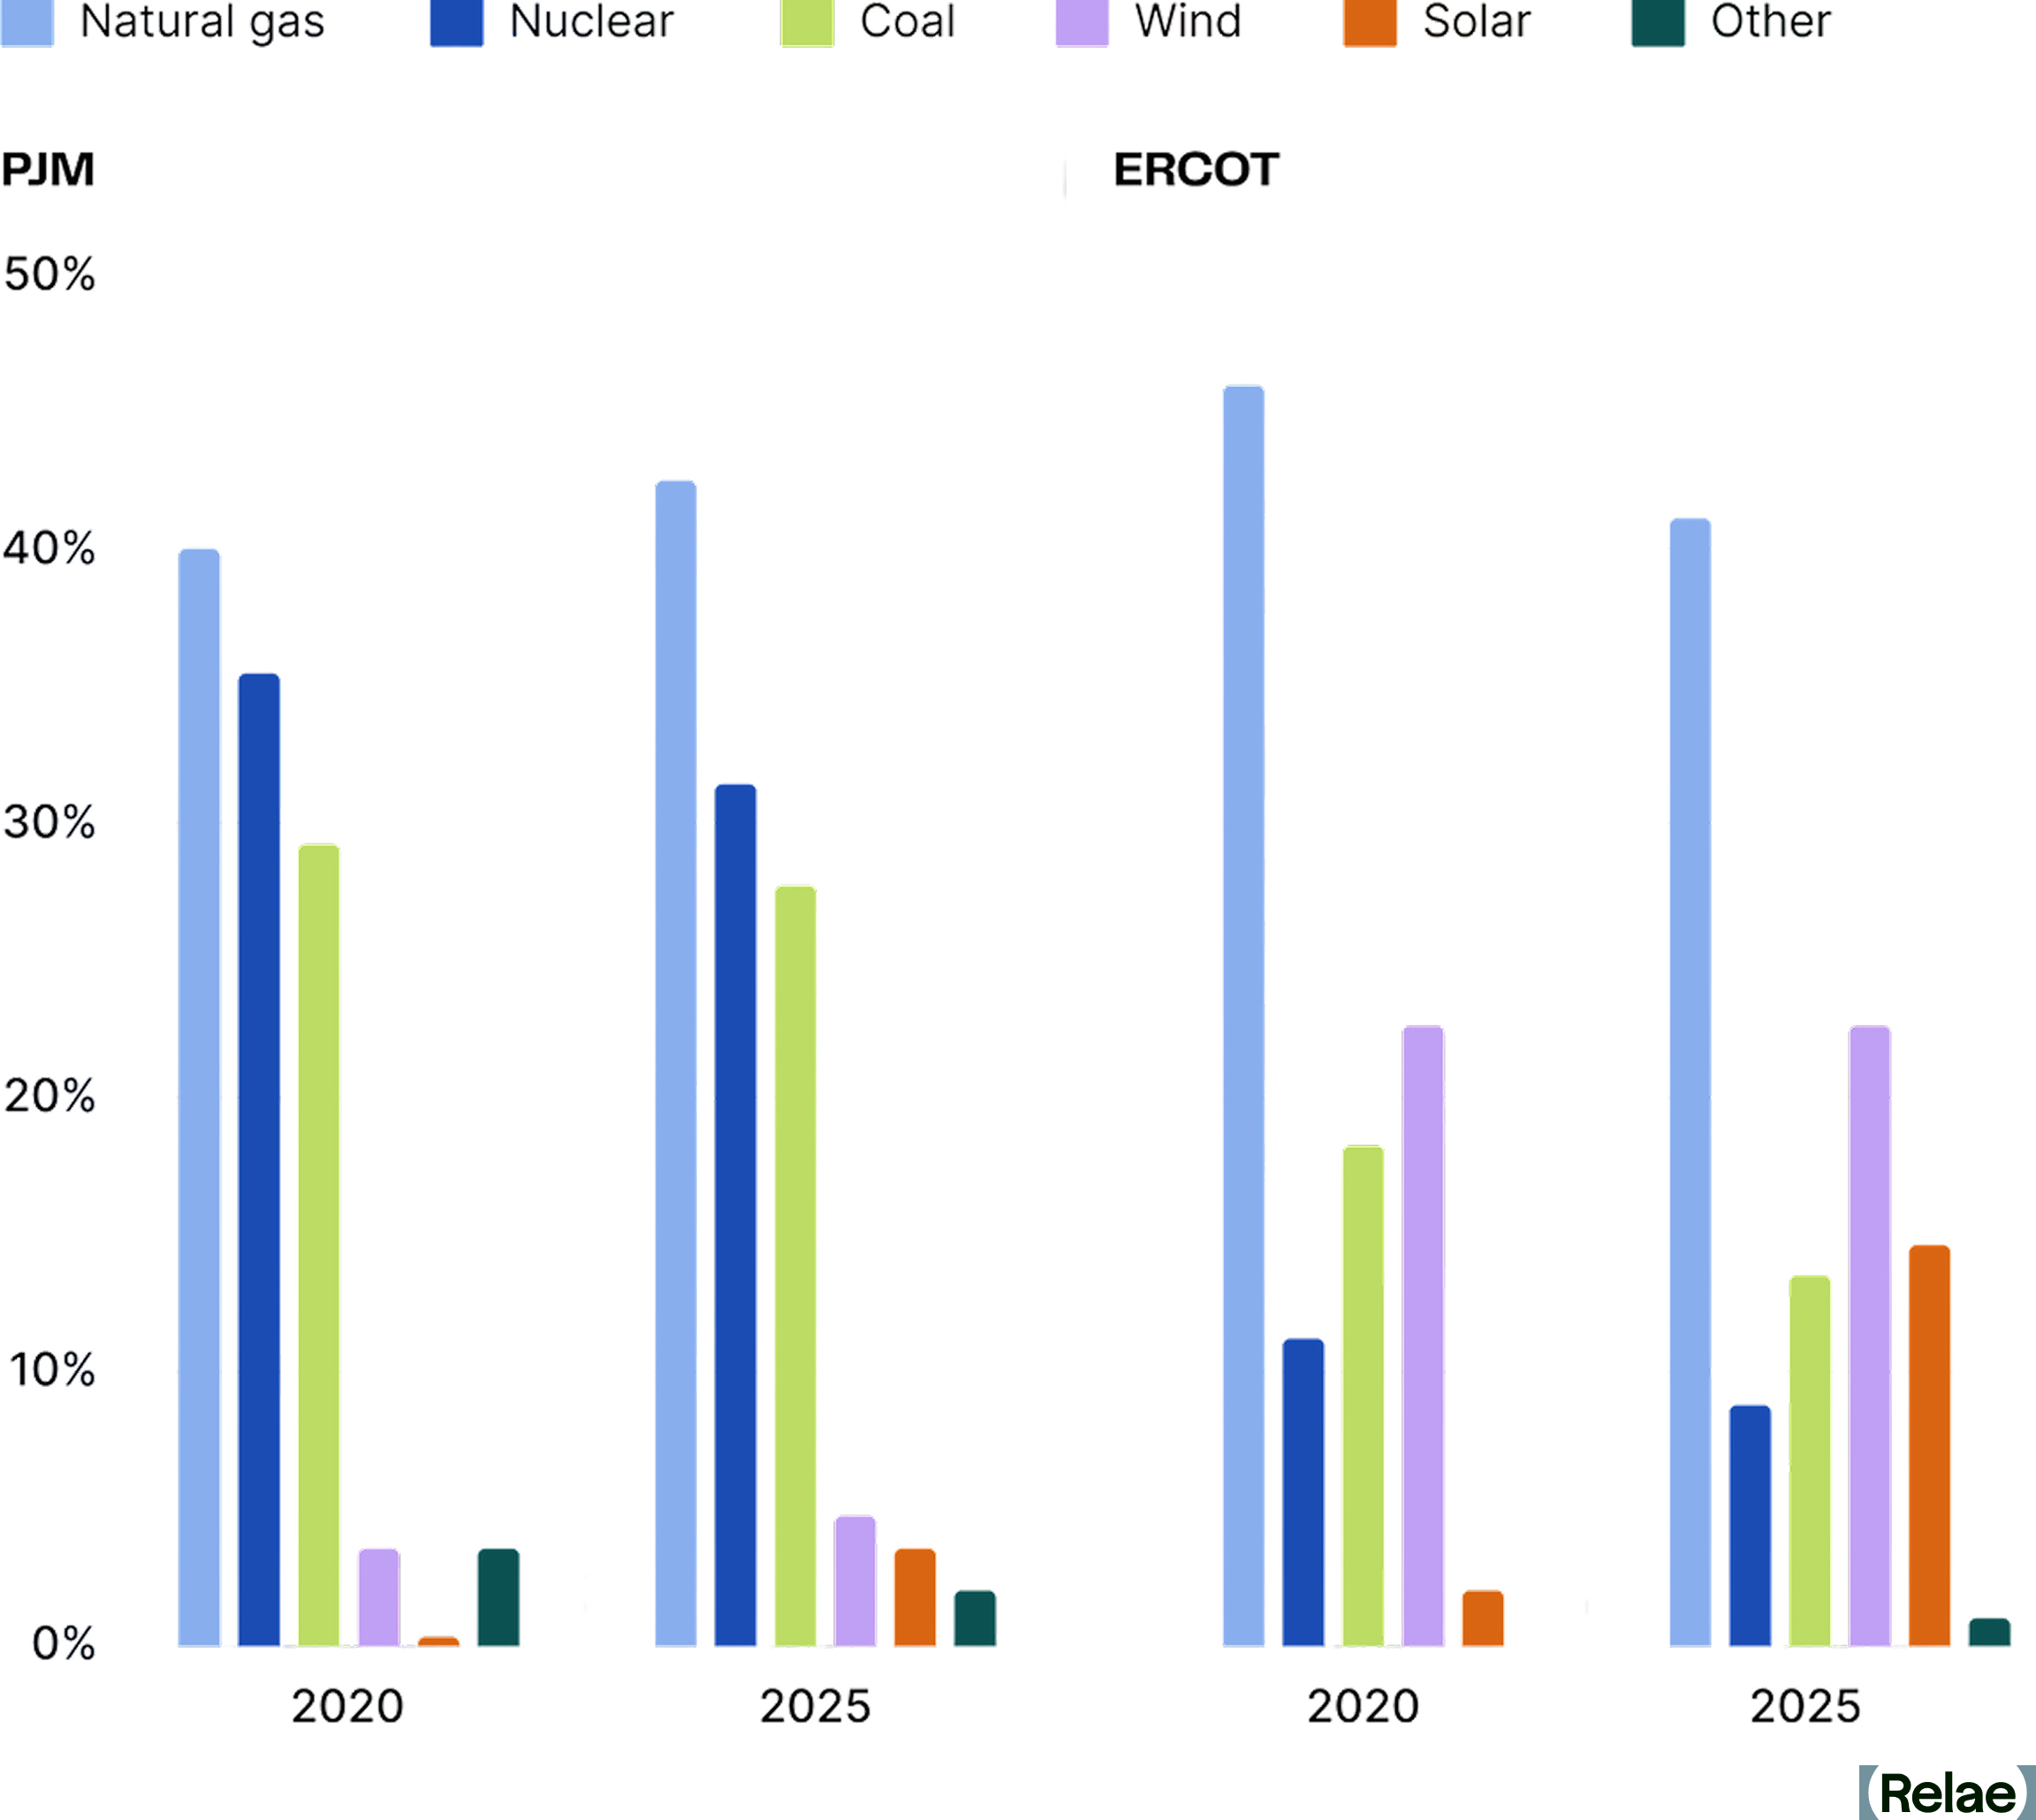
PJM is one of the largest and most complex wholesale electricity markets in the world. Its generation mix still includes 60% coal and natural gas, which means hourly emissions intensity remains high, particularly during evening peaks and grid stress events when fossil generation dominates the dispatch stack.
Buyers relying solely on annual REC retirement may show low market-based scope 2 emissions today, but a 24/7 analysis tells a different story. For PJM-based buyers, this means hourly matching gaps will be largest during evening and overnight hours, when nuclear and storage become disproportionately valuable relative to additional solar.
ERCOT: Solar and Wind Don’t Peak When Demand Does
Texas has abundant wind and solar, with solar generation growing nearly 7x since 2020, but those resources don’t always run when demand peaks. While fossil-based generation has declined since 2020, it still comprises more than half of ERCOT’s generation. Solar dominates midday, wind peaks in the evening, and natural gas fills the gaps, especially during high-demand evenings or extreme weather events.
Buyers with large ERCOT footprints may find that VPPA portfolios, which generate most of their clean energy in off-peak hours, already satisfy the proposed location-based test but fail on hourly matching. Battery storage and demand flexibility could help bridge the gap.
Figure 3 below quantifies that gap in both markets by showcasing the carbon-free energy (CFE) score in ERCOT and PJM, as well as the additional capacity required for a 4 GW load to achieve a 100% CFE target. The CFE score is the share of grid-supplied electricity in a given hour that comes from carbon-free sources, and is the metric the proposed scope 2 revisions would use to evaluate hourly matching. A 100% CFE target means electricity consumption is matched to carbon-free generation in every hour of the year.
In the left panel, a representation1 of each market's 2030 hours are sorted by grid (CFE) score, from the dirtiest hour on the left to the cleanest on the right. Neither grid approaches 100% carbon-free on its own, and the shaded areas represent the unmatched hours a buyer claiming 100% clean energy through annual instruments would actually carry under 24/7 accounting. The gap is the maximum unmatched hours a buyer might be exposed to, as some RECs procured through annual matching may qualify under the new rules, if satisfying the locational and hourly requirements.
The right panel translates that gap into action. The additional co-located clean generation and storage required to serve a representative 4 GW load (roughly 5% of the forecast 2030 C&I load in ERCOT and 4% in PJM) at a 100% hourly CFE target, on top of what the underlying grid already provides.
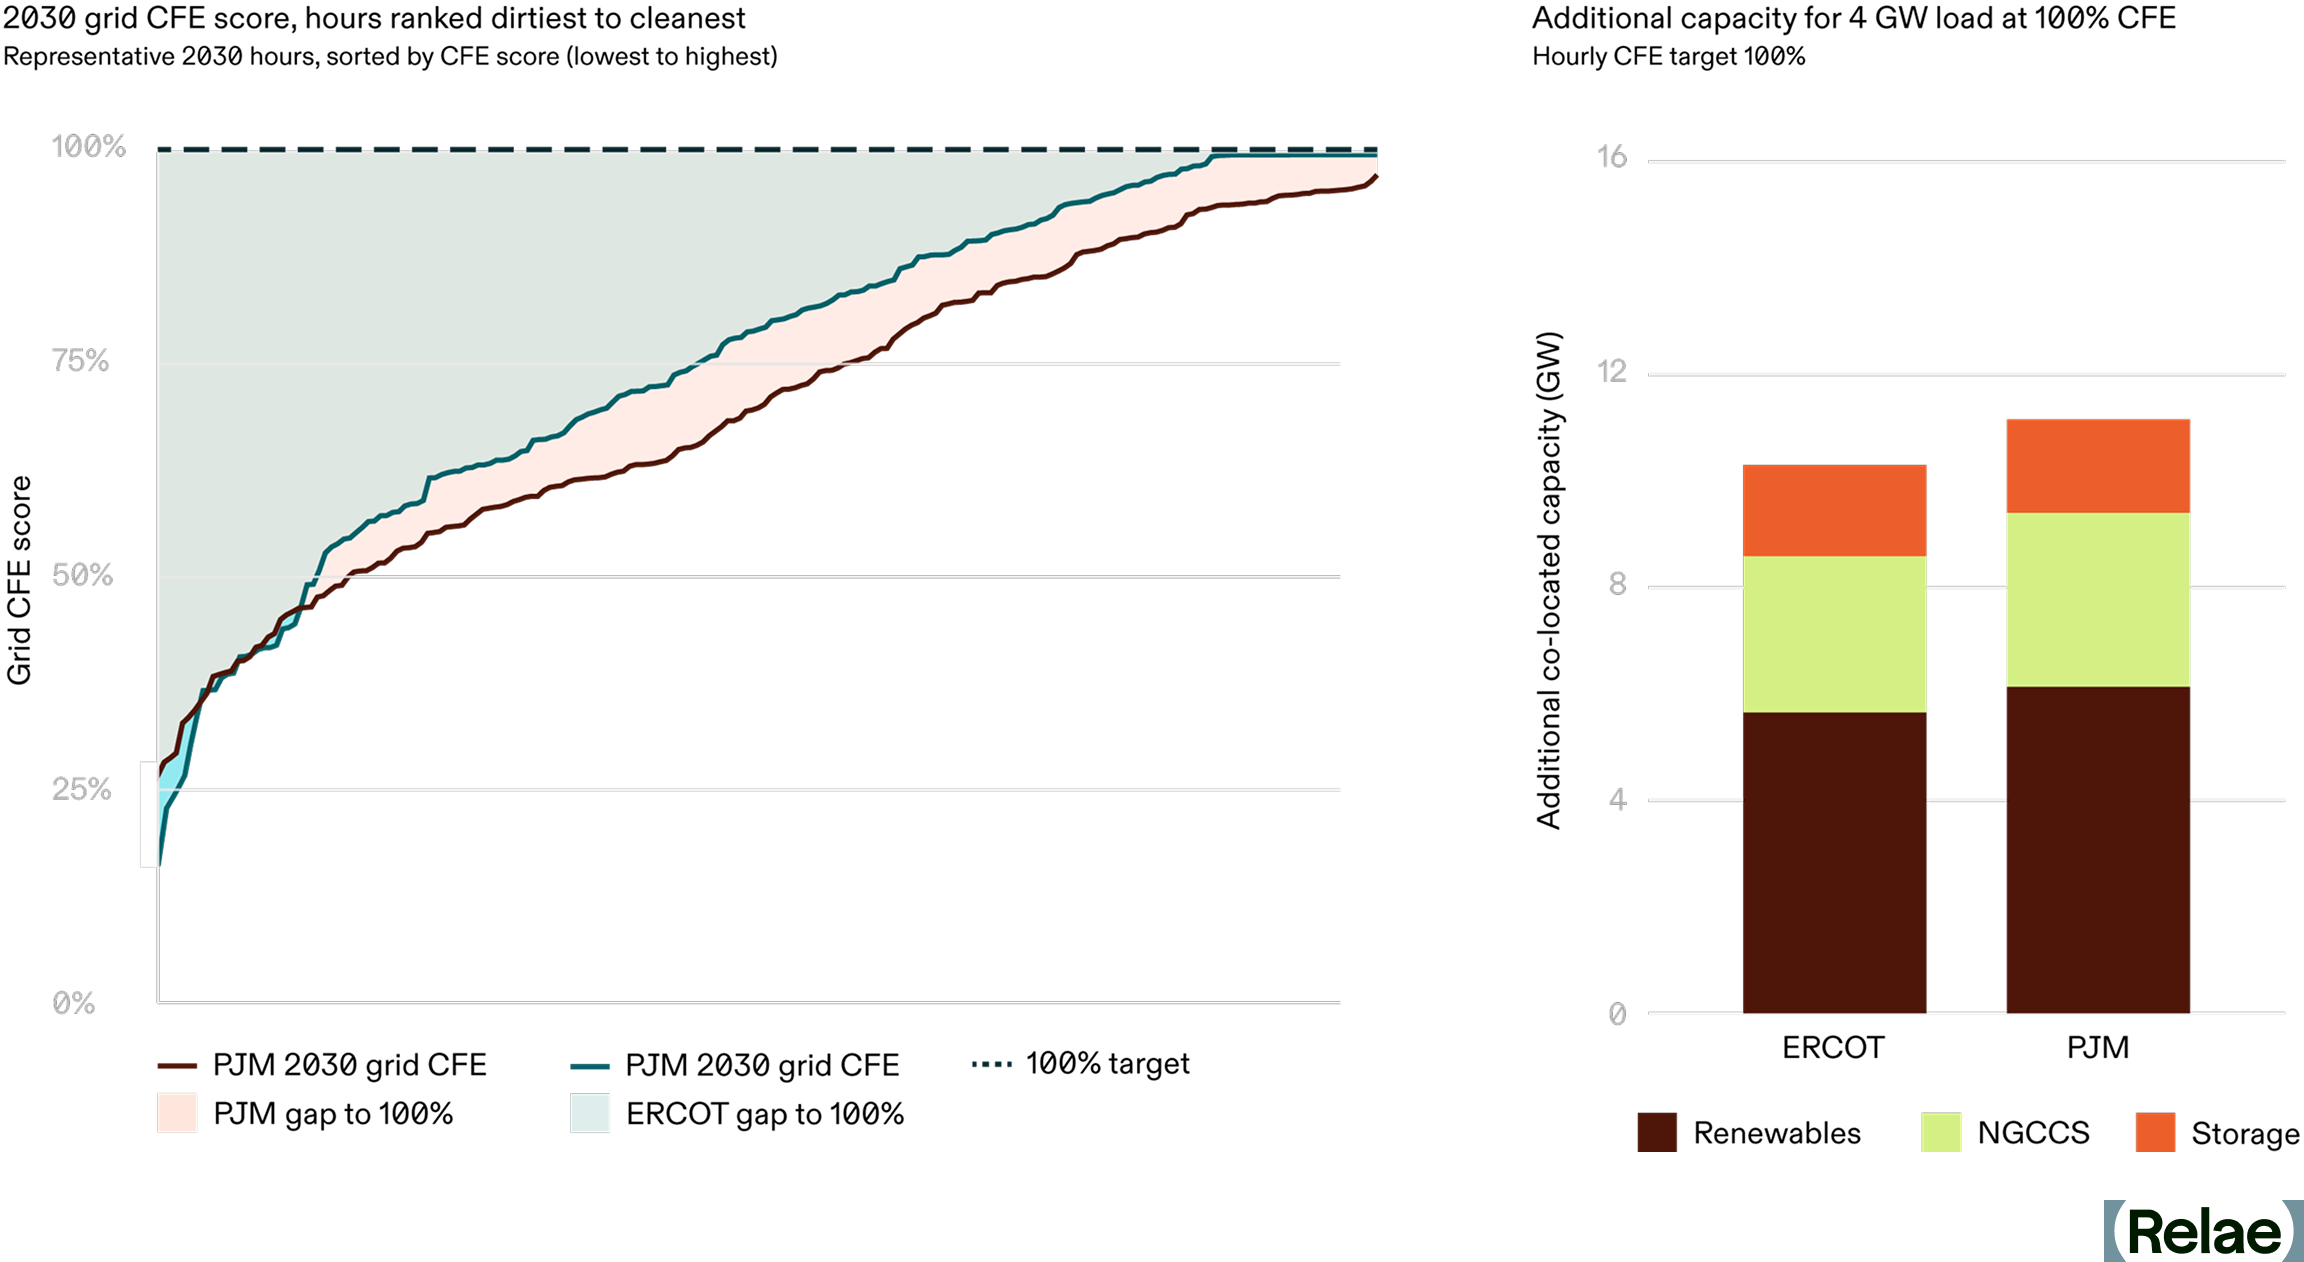
A few patterns are worth highlighting. First, the left panel confirms that PJM’s grid will still spend materially more hours below 100% carbon-free than ERCOT’s in 2030, a direct consequence of the coal- and gas-heavy generation mix described above. Notably, ERCOT's curve reaches 100% in a meaningful share of hours (windows when the grid is running entirely on carbon-free resources), while PJM's never does, meaning some fossil generation is dispatched in every hour.
Second, the ISO a buyer operates in drives a meaningful difference in build-out: hitting 100% hourly CFE for a 4 GW load takes 9.6 GW of additional capacity in ERCOT and closer to 10.5 GW in PJM. This indicates the advantage of achieving hourly and locational matching in already clean grids, which may influence a buyer choosing where to site new workloads.
Renewables have the largest share of the additional capacity in both markets (5-6 GW), paired with significant long-duration energy storage (~2 GW), while natural gas with CCS provides meaningful clean, firm capacity (~3 GW). ERCOT’s storage share of capacity is slightly larger, reflecting the midday-solar/evening-load mismatch, while PJM leans a bit more on natural gas with CCS, where clean, firm generation does more of the heavy lifting due to lower wind speeds and solar irradiance than Texas.
The right panel also illustrates why clean, firm technologies (natural gas with CCS, advanced nuclear, and enhanced geothermal) are likely to be included alongside renewables and batteries in any serious 24/7 portfolio. With only renewables and batteries, hitting the same target requires about double the total generation and storage capacity. In both markets, targets that look achievable today on an annual REC basis will require materially more capital and a different mix of resources, under 24/7 accounting.
Top Questions Large Power Buyers Need to Model Before the Rules Change
The GHG Protocol revisions are not finalized, and the timing of any mandate remains uncertain, which is exactly why modeling cannot wait.
A useful self-test for any large power buyer is: can your team answer the following today with defensible numbers?
- What is your hourly CFE score across your largest load centers, and how far does it sit from your reported market-based emissions?
- Which of your existing VPPAs and REC contracts hold value under 24/7 accounting, and which become effectively stranded?
- What mix of resources delivers the incremental clean, firm capacity that closes your gap in PJM, ERCOT, or wherever your load is concentrated at the lowest cost?
- If your next gigawatt of load were sited in a different ISO, how would your emissions position change?
Clean firm projects do not appear off the shelf. Advanced nuclear, enhanced geothermal, and natural gas with CCS all carry multi-year development timelines, and corporate offtake agreements are often what get these projects financed in the first place. Buyers who engage now help shape the project pipeline that will be available in their target markets in 2030, and can lock in offtake terms before competition for the most valuable sites tightens. Buyers who wait until the methodology is final will be working with shorter lead times, fewer development partners, and less leverage to specify projects that fit their load profiles and hourly matching needs.
Frequently Asked Questions
What is 24/7 hourly matching, and how does it differ from today's REC accounting?
Today's scope 2 accounting lets companies retire renewable energy certificates (RECs) from any grid, at any time of year, to offset their emissions. The GHG Protocol's proposed 24/7 hourly matching would require RECs to come from clean generation on the same grid, in the same hour a facility consumes power, making most of today's location-agnostic RECs ineligible for market-based accounting.
Why are PJM and ERCOT under the most pressure from this shift?
Both markets are absorbing the fastest-growing data center load in the country, and both still lean on fossil generation to meet demand outside peak renewable hours. PJM's generation mix is 60% coal and gas, while ERCOT's solar and wind often don't peak when demand does, so buyers in these markets face the largest gaps between their annual REC claims and their actual hourly carbon-free energy score.
How much additional clean capacity does it take to close the gap?
Relae's modeling finds that serving a 4 GW data center load at 100% hourly carbon-free energy requires 9.6 GW of additional clean capacity in ERCOT and 10.5 GW in PJM. That capacity mix leans on renewables and long-duration storage in both markets, with natural gas with CCS playing a larger role in PJM, where wind and solar resources are weaker.
What should power buyers do before the GHG Protocol revisions are finalized?
Start modeling now. Buyers should know their hourly carbon-free energy score, understand which existing VPPAs and REC contracts hold value under 24/7 accounting, and identify the lowest-cost mix of clean, firm resources that closes their gap. Clean firm projects like advanced nuclear, enhanced geothermal, and natural gas with CCS take years to develop, so buyers who engage early have more influence over the project pipeline and better offtake terms.
Modeling the 24/7 Emissions Gap with Relae
For large power buyers assessing what the proposed GHG Protocol revisions mean for their power procurement portfolio, Relae's Advanced Power Emissions Analysis solution models the gap between current market-based reporting and what 24/7 accounting would reveal—by market, load profile, and technology stack.
Scope 2 Emissions Explained: Tracking, Reporting, and Reducing Impact
Key Takeaways
- Scope 2 emissions (indirect emissions from energy use) are increasingly critical to address. With surging electricity demand, especially from data centers, scope 2 is a growing share of corporate emissions and a priority for decarbonization.
- Approaches to scope 2 accounting are evolving—and formal changes are now on the table. Both location-based and market-based methods remain accepted under the Greenhouse Gas Protocol. Still, the Protocol's recently closed public consultation proposes more granular approaches, including 24/7 power and carbon matching, that would better reflect the realities of modern power markets.
- Proven decarbonization levers, such as reducing energy use, entering power purchase agreements, procuring green tariffs, and buying high-quality renewable energy certificates, are already available and impactful. Decarbonization, not just measurement, must be the goal. Companies don’t need to wait to decarbonize.
Accounting for Indirect Emissions From Energy Use
As businesses and organizations strive to reduce their environmental impact, carbon accounting has become an essential tool for tracking and managing greenhouse gas (GHG) emissions. Carbon accounting helps organizations measure, report, and mitigate their emissions across various activities. A key framework for categorizing these emissions is the Greenhouse Gas Protocol (GHG Protocol), which classifies emissions into three scopes:
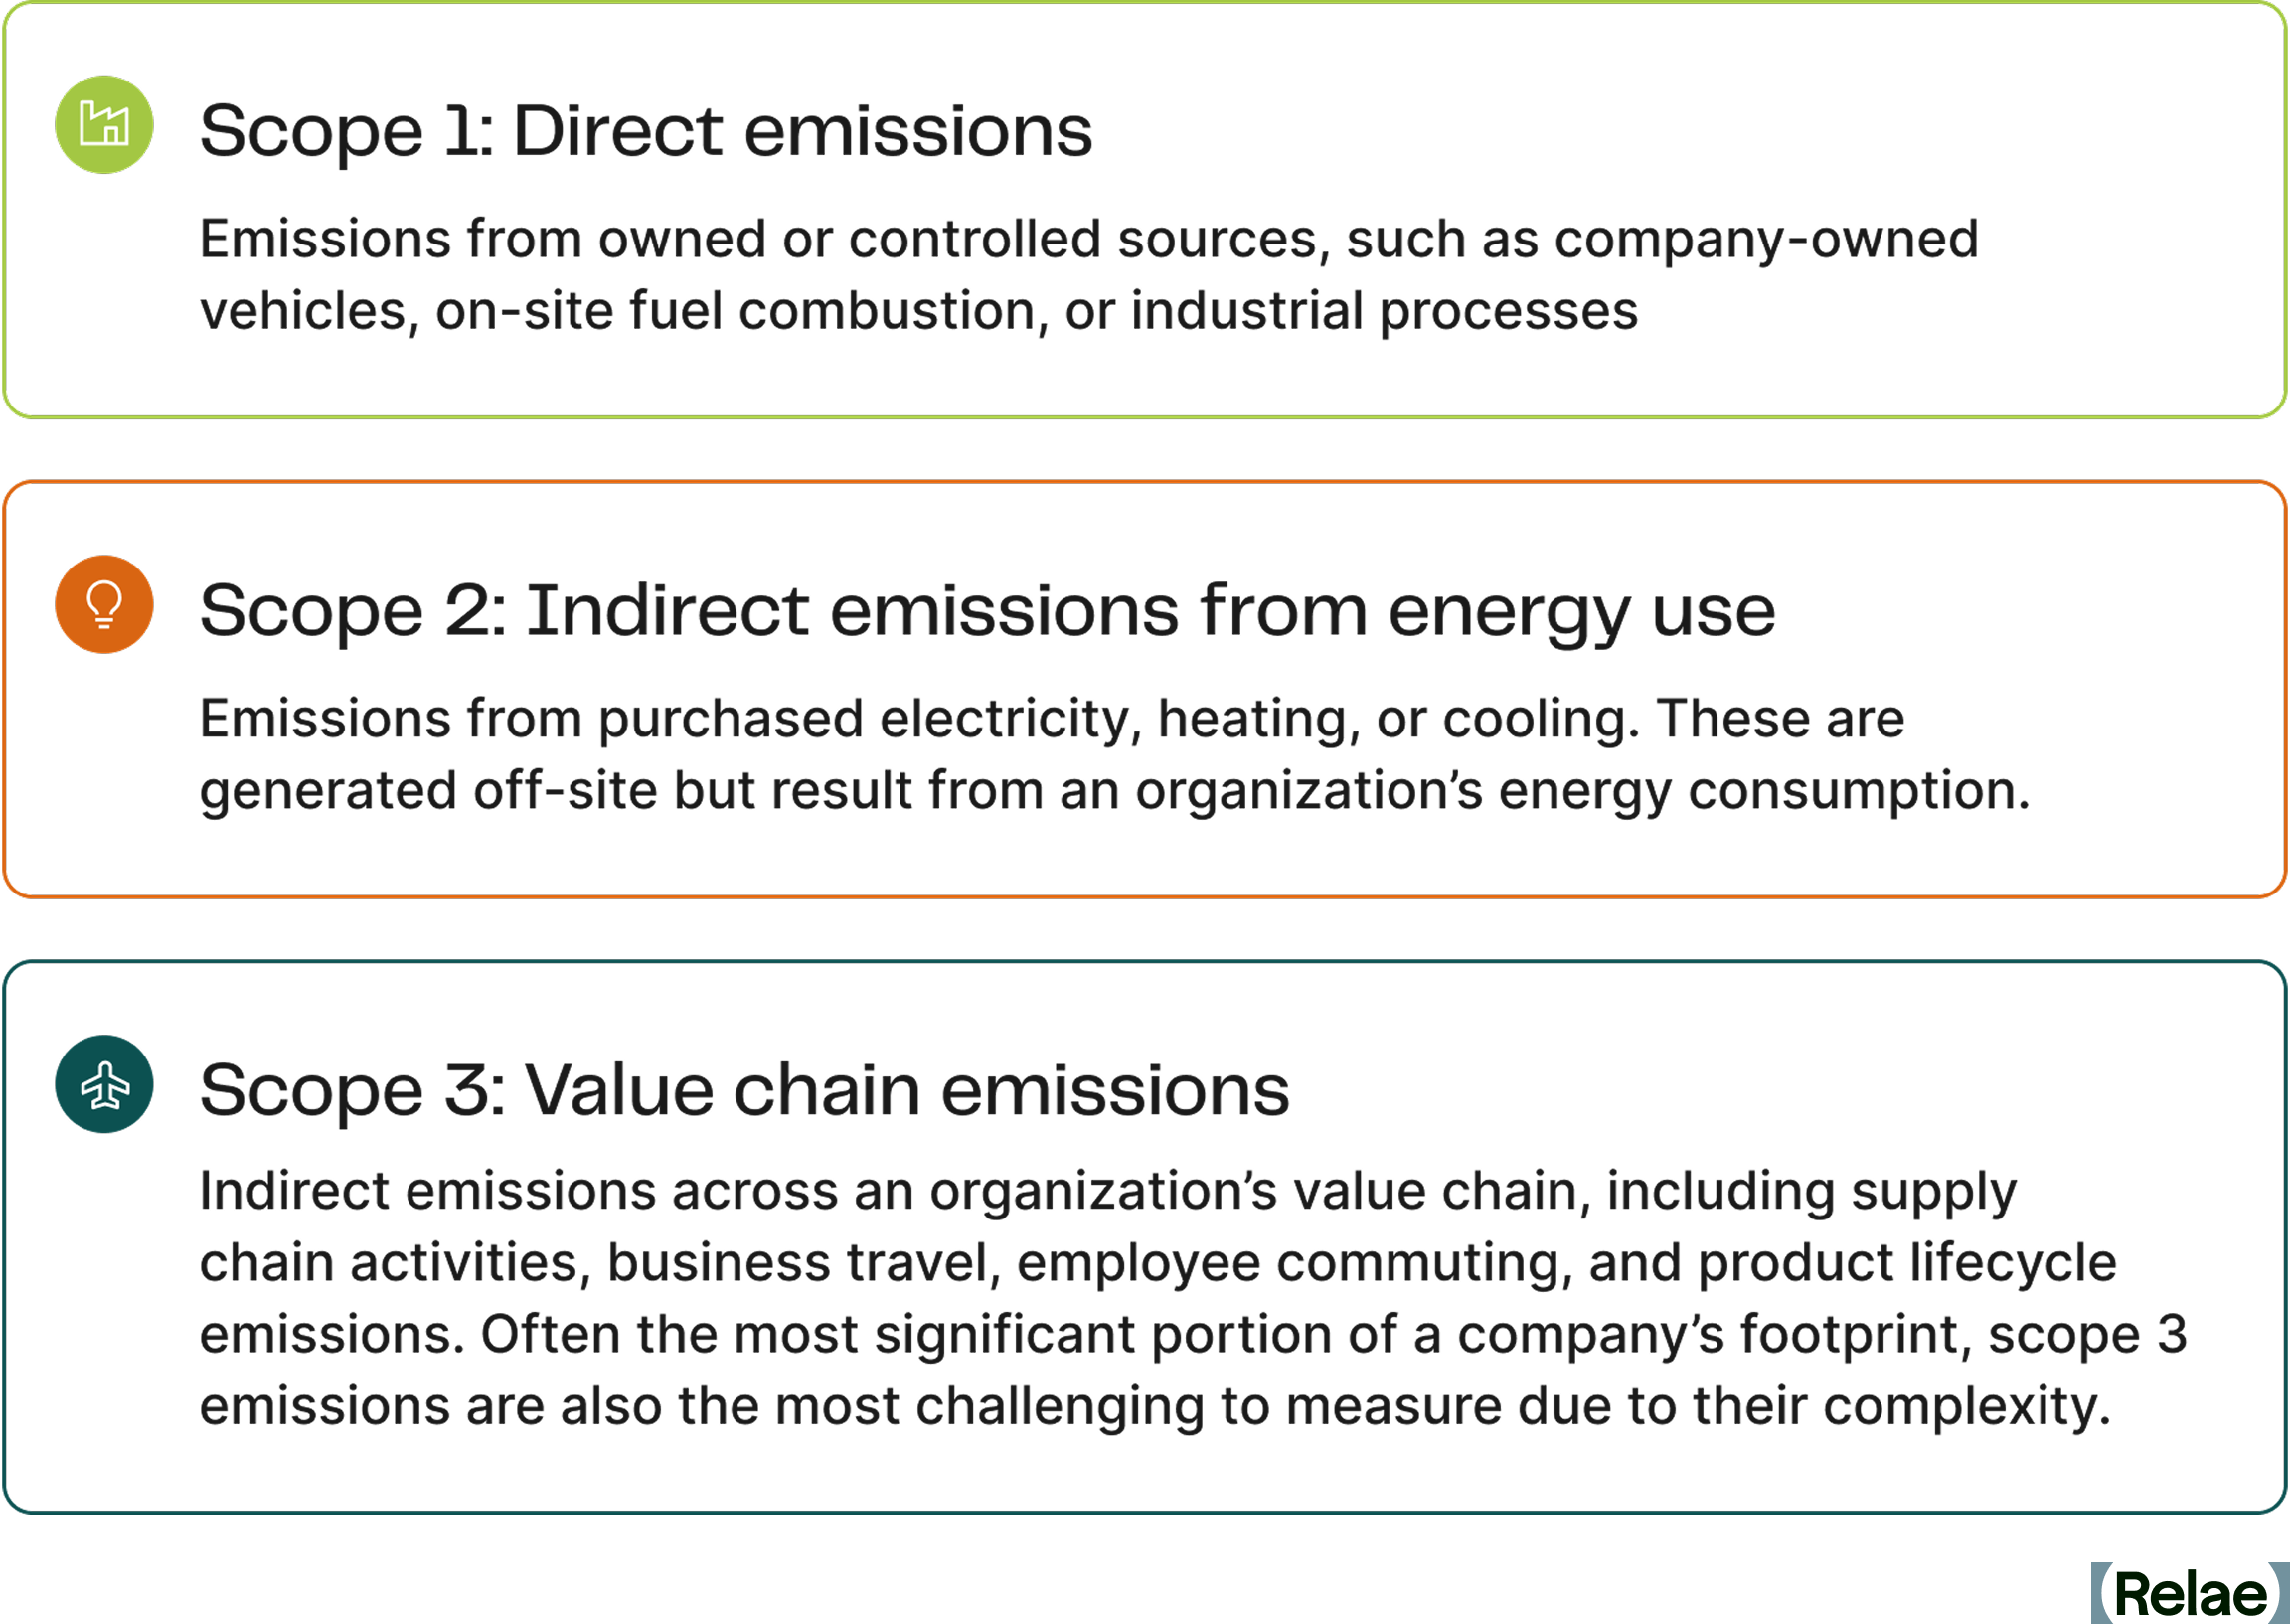
Each scope presents unique challenges and opportunities for reduction. Among them, scope 2 emissions are particularly significant because they stem from purchased energy, which is often generated using fossil fuels. However, numerous reduction mechanisms exist today to help organizations eliminate these emissions, such as improving energy efficiency in order to use less energy, and transitioning to renewable energy sources through market-based mechanisms. Understanding scope 2 emissions is crucial for businesses looking to contribute meaningfully to the global energy transition and achieve sustainability goals.
What Are Scope 2 Emissions?
Scope 2 emissions refer to indirect GHG emissions associated with the consumption of purchased energy. Unlike scope 1 emissions, which result from direct fuel combustion, scope 2 emissions arise from the generation of electricity, steam, heat, or cooling that a company procures from external sources.
The primary sources of scope 2 emissions include:
Purchased electricity: When businesses buy electricity from a utility provider, the emissions from power plants that generate this electricity are classified under scope 2.
Purchased heat, steam, and cooling: Some companies purchase heat, steam, or cooling services instead of generating them on-site. These services often come from centralized facilities that may rely on fossil fuels, thereby contributing to scope 2 emissions.
What sets scope 2 emissions apart from other scopes is the presence of market-based mechanisms that offer multiple pathways for organizations to reduce their carbon footprint. Unlike scope 1, where emissions reductions often require technological shifts or operational changes, scope 2 reductions can be achieved through strategic procurement decisions. The transition to renewable energy sources is an essential component of sustainability strategies, setting the stage for a broader energy transition across industries and economies.
How Are Scope 2 Emissions Measured Today?
The GHG Protocol currently outlines two primary approaches for calculating scope 2 emissions: the location-based method and the market-based method.
Location-Based Method
The location-based method calculates emissions for electricity consumption based on the average emissions intensity of the grid where the energy consumption occurs. This approach is mandatory under various reporting frameworks and does not take into account a company’s procurement choices.
- Relies on grid averages: Emissions are calculated based on regional grid emissions factors rather than specific energy purchases.
- Time-delayed data: Since grid emissions factors are typically updated annually, this method may not reflect real-time energy sourcing changes.
- Limited control: Companies using this method have less direct influence over their reported emissions, as they depend on the overall energy mix of their region.
Market-Based Method
The market-based method, on the other hand, reflects an organization’s actual procurement decisions and energy-sourcing strategies. It accounts for specific contracts, such as power purchase agreements (PPAs), renewable energy credits (RECs), and green tariffs, which allow businesses to claim lower emissions from their purchased electricity.
- Reflects company choices: Emissions calculations take into account contractual agreements for renewable energy purchases.
- Mechanism for electricity transition: Encourages organizations to invest in low-carbon electricity options and actively support the transition to renewables.
- Multiple reduction options: Companies can reduce their scope 2 emissions through a portfolio of mechanisms like PPAs, RECs, and green tariffs, making this method a flexible and strategic tool for decarbonization.
While market-based mechanisms provide flexibility in reducing scope 2 emissions, they also highlight the need for more precise and updated carbon accounting methodologies. For example, some decarbonization strategies, such as time-shifting energy consumption to better match renewable generation, are not accounted for under these methods. This and other limitations mean that the traditional methods outlined in the GHG Protocol are increasingly seen as outdated in an era of rapid changes in energy generation and grid dynamics. As a result, the market is shifting toward more advanced power emission accounting methodologies that provide a more accurate reflection of emissions associated with electricity use.
Proposed Changes to the GHG Protocol Scope 2 Guidance
The current GHG Protocol Scope 2 Guidance provides a market-based instrument methodology, originally designed in the early 2000s, that allows US-based companies to procure renewable energy at any point within a year from anywhere in North America and apply it to any of its annual electricity consumption within that same year. This methodology, as written, allows for a potentially significant mismatch of “emissions caused” (by consuming electricity) versus “emissions avoided” (by generating renewable electricity) in that it does not account for any of the realities of electric grids and generators, which vary significantly over different regions, seasons, and time of day.
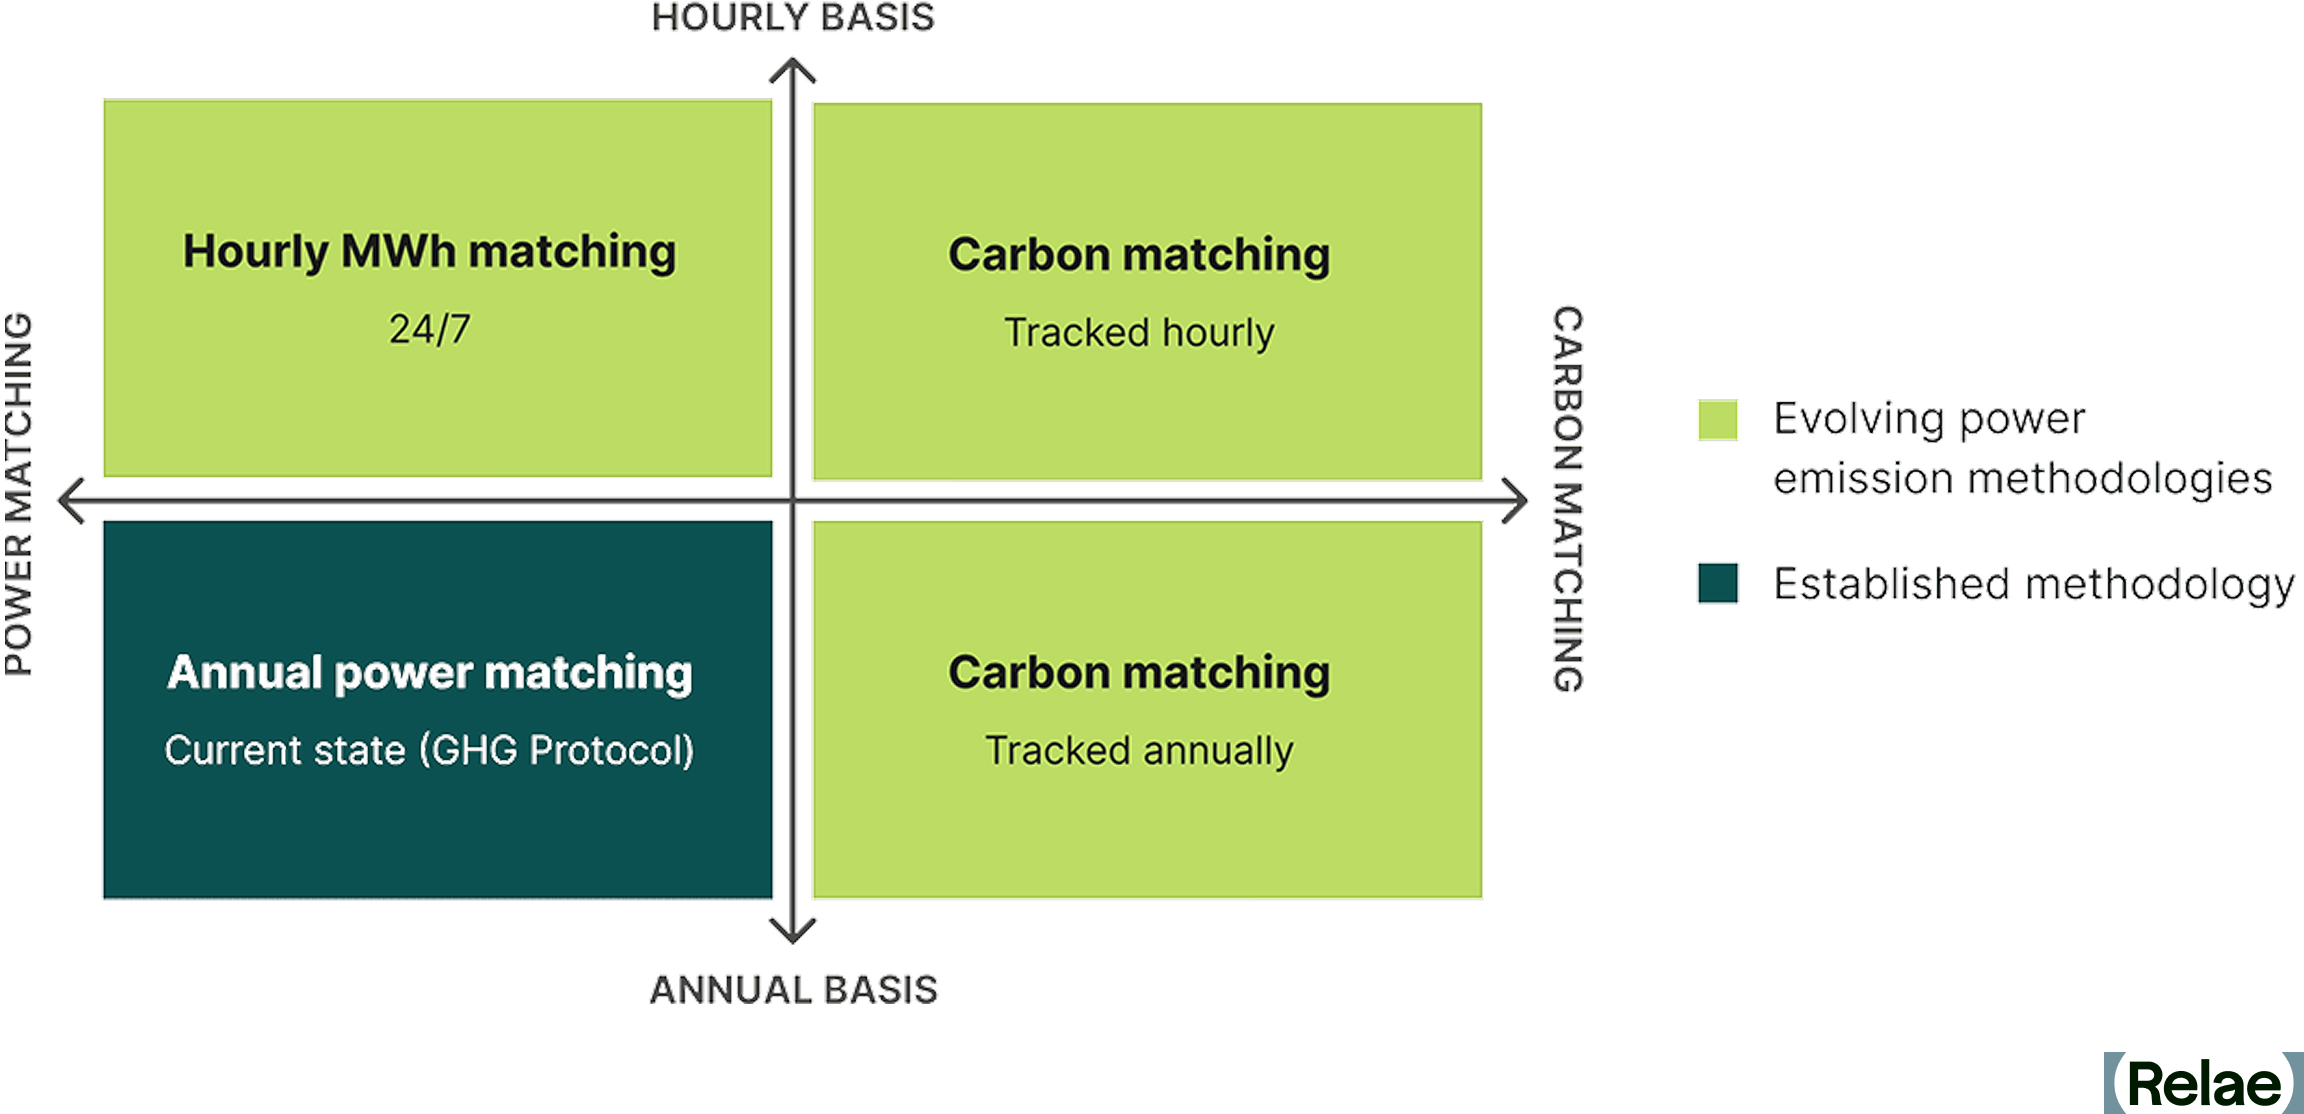
In response to this, the GHG Protocol Scope 2 Guidance is currently undergoing a revision process, which will include how emissions associated with electricity consumption are calculated. A focus of the revision process is on how to better account for the real emissions associated with a corporate’s electricity consumption, and more impactful ways of mitigating them through market-based instruments and other approaches. Advanced power emission accounting methodologies, such as 24/7 power matching and carbon matching, are being explored as ways to better represent the GHG emissions associated with electricity consumption.
- 24/7 power matching emphasizes matching electricity consumption with an equivalent amount of renewable energy production on an hourly basis.
- Carbon matching emphasizes measuring the emissions impact of incremental electricity consumption or production at a specific time.
These emerging methodologies propose a shift toward more granular temporal and region-specific matching, which could require companies to rethink their emissions reporting approach and explore more advanced tracking tools. They may also introduce new strategies beyond market-based instruments for reducing scope 2 emissions, such as time-shifting energy consumption.
As power grids continue to decarbonize and new digital tools emerge, businesses will need to adapt to these evolving methodologies to remain compliant, enhance sustainability strategies, and achieve meaningful reductions in emissions. Companies that proactively integrate advanced power emission tracking into their carbon accounting strategies will be better positioned to lead in the transition to a low-carbon economy.
How to Reduce Scope 2 Emissions
The GHG Protocol provides multiple mechanisms for reducing scope 2 emissions, allowing organizations to shift their energy consumption toward lower-carbon alternatives. These include:
- Reducing energy consumption: Improving energy efficiency in operations can significantly lower electricity use. In some cases, this involves capital investments in more energy-efficient equipment, but in other cases, it can be based on operational changes such as reducing unnecessary lighting, HVAC, and other services during non-working hours. (Electrification efforts, such as shifting from fossil fuel-powered systems to electric alternatives, may actually increase scope 2 emissions, but this can ultimately reduce overall emissions by correspondingly decreasing scope 1 emissions and allowing for renewable energy procurement.)
- RECs: Companies can purchase unbundled RECs (emissions “attributes” separated from the actual electricity product) to offset emissions associated with purchased electricity. While there has been criticism of RECs due to their significant range in quality, high-quality RECs are available, which may include ensuring regional matching, financial additionality, on-line date additionality, or tighter temporal generation to consumption matching. The use of high-quality unbundled RECs is the most accessible and realistic option for most smaller-scale companies to address scope 2 emissions.
- On-site generation and co-location: Installing on-site renewable energy generation, such as solar panels, allows companies to directly offset their electricity consumption from the grid. In some commercial settings, such as companies using leased real estate or co-located data centers, partnering with facilities that prioritize renewable energy procurement can help reduce scope 2 emissions for the facility owner while the facility occupant reduces scope 3 emissions.
- PPAs: Entering into long-term contracts with renewable energy providers ensures companies receive electricity from clean energy sources while supporting the expansion of renewable generation capacity. PPAs are available with standardized contract terms, and some service providers will aggregate demand from multiple smaller companies to reach the minimum required amount for typical PPA contracts. Hedging products are also available to reduce market risks.
- Green tariffs: Many utilities offer green tariffs that enable businesses to purchase renewable energy directly through their electricity provider, often at a premium but with lower emissions impact. For many smaller companies, this is a more viable approach than a PPA with a single renewable generator.
By adopting a combination of these strategies, businesses can significantly lower their scope 2 emissions while aligning with broader sustainability goals and regulatory requirements. The path to decarbonization requires proactive investment in cleaner energy sources, efficient consumption practices, and leveraging market-based instruments to drive the transition toward a low-carbon future.
Why Does Reducing Scope 2 Emissions Matter?
Reducing scope 2 emissions is the underpinning of decarbonizing the power sector and enabling the global energy transition. In 2025, S&P reported that corporate buyers added 15.2 GW of renewable capacity in the US, up from 9.1 GW in 2024, illustrating the growing impact of the corporate sector on the electricity grid. Cleaner grids translate to lower emissions for all energy users. Organizations that actively reduce their scope 2 emissions can contribute to decreasing demand for fossil fuel-based electricity and accelerate the deployment of renewable energy infrastructure.
For companies that own and operate data centers, this transition is especially important. AI data centers consume large amounts of electricity, and their reliance on purchased power makes them a significant source of scope 2 emissions. Since many businesses rely on third-party data center services, reducing emissions from these facilities also helps lower scope 3 emissions across industries. Corporates can influence data centers by requiring that they have a clear and explicit low-emission power strategy in place before procurement.
Beyond direct corporate benefits, reducing scope 2 emissions has a tangible long-term impact on power grids. Increased investment in renewable energy procurement sends a strong market signal, encouraging utilities and developers to expand clean energy projects. As more companies commit to sourcing renewable energy, the overall mix of grid power shifts, making low-carbon electricity more accessible and reducing reliance on fossil fuel-based generation. Ultimately, widespread corporate action in scope 2 emissions reduction supports the broader decarbonization of power markets and strengthens global climate commitments.
Frequently Asked Questions
Will RECs (renewable energy certificates) still count toward scope 2 reductions under the GHG Protocol's proposed changes?
Under the current Scope 2 Guidance, yes—RECs remain a valid market-based instrument. The proposals from the GHG Protocol's recent consultation range from retaining market-based accounting with stricter quality criteria to restructuring how instrument-based claims are reported altogether, and nothing is final until the revised standard is published. What's clear is that scrutiny is rising, particularly for unbundled RECs with weak temporal or geographic connection to a company's actual consumption, so prioritizing high-quality RECs now is the best way to future-proof a procurement strategy.
How would the proposed hourly and regional matching requirements affect companies that rely on unbundled RECs today?
Hourly (24/7) and regional matching would require renewable generation claims to line up much more closely with when and where a company actually consumes electricity. Companies relying on annually matched, unbundled RECs sourced from distant grids would likely see their reported market-based emissions rise under such requirements. The practical preparation is to start collecting more granular (ideally hourly) consumption data and shift toward RECs and contracts with tighter regional and temporal matching.
What's the practical difference between location-based and market-based scope 2 accounting, and will that distinction survive the GHG Protocol's revision?
The location-based method calculates emissions using the average emissions intensity of the local grid, regardless of procurement choices, while the market-based method reflects a company's actual contracts, such as PPAs, RECs, and green tariffs. The consultation explored options from strengthening the criteria for market-based claims to reporting emissions and market instruments in separate, complementary statements. Both concepts will exist in some form, but companies should expect the requirements behind market-based claims to tighten.
When is the new Scope 2 Guidance expected to take effect, and what should companies do now to prepare?
Per the GHG Protocol's July 2026 development plan, a draft of the revised consolidated Corporate Standard is expected for public consultation in 2027, with a final published standard currently estimated for late 2028, and adoption timelines will follow publication. Companies should take action now. Energy efficiency, PPAs, green tariffs, and high-quality RECs reduce real emissions under any accounting regime. Building hourly consumption tracking and auditing the quality of existing REC portfolios now will make any future transition smoother.