Marine Carbon Dioxide Removal: What It Is and How It Works
Key Takeaways
- Marine carbon dioxide removal (mCDR) uses ocean-based processes—primarily ocean alkalinity enhancement (OAE) and direct ocean removal (DOR)—to capture and durably store atmospheric carbon dioxide (CO₂), without the land and freshwater constraints of terrestrial methods.
- The ocean already absorbs roughly 29% of human-caused CO₂ emissions each year, according to the 2025 Global Carbon Budget, and mCDR technologies aim to safely enhance that natural uptake without worsening ocean acidification.
- For corporate carbon buyers and project developers evaluating mCDR, the Criteria for High-Quality Marine Carbon Dioxide Removal, developed by Microsoft and Relae, outlines standards to guide responsible mCDR deployment at scale.
Reducing carbon dioxide (CO₂) emissions alone is no longer sufficient to limit global warming to 1.5°C. To effectively address climate change, scientific consensus highlights the need to remove carbon dioxide already present in the atmosphere. Marine carbon dioxide removal (mCDR), a form of ocean-based carbon removal, offers a scalable solution by leveraging the ocean’s natural ability to absorb and store carbon, without the land and resource limitations associated with terrestrial carbon removal methods.
This guide explores the fundamentals of marine carbon dioxide removal, including how it works, the technologies involved, and its role in global decarbonization.
What Is Marine Carbon Dioxide Removal?
Marine carbon dioxide removal uses ocean-based processes to capture and store carbon dioxide from the atmosphere. mCDR techniques fall into two primary categories:
- Biotic CDR, which includes using photosynthetic fixation, microalgae cultivation, and terrestrial biomass sinking, to capture and store carbon.
- Abiotic CDR, which influences CO₂ concentrations and carbonate chemistry in the seawater to absorb atmospheric CO₂ without increasing acidity. There are two main abiotic mCDR pathways: ocean alkalinity enhancement (OAE) and direct ocean removal (DOR).
How Does Marine Carbon Dioxide Removal Work?
Marine carbon dioxide removal functions via the air-sea gas exchange—a process by which the atmosphere and surface seawater maintain equal CO₂ concentrations—meaning a shift in one leads to a corresponding change in the other. This exchange allows the ocean to absorb or release CO₂ back into the atmosphere depending on concentration levels and factors like pH.
Once absorbed by the ocean, CO₂ exists in several forms, including dissolved CO₂, carbonates, and bicarbonates, influencing the ocean's pH levels. As atmospheric CO₂ levels rise, the oceans absorb roughly 12 GtCO2 annually, approximately 29% of anthropogenic CO2 emissions. This increase is disrupting the natural CO₂ balance and contributing to ocean acidification.
mCDR methods like ocean alkalinity enhancement and direct ocean removal use safe and controlled processes to increase the amount of CO2 absorbed from the atmosphere while mitigating acidification.
Understanding Ocean Alkalinity Enhancement (OAE)
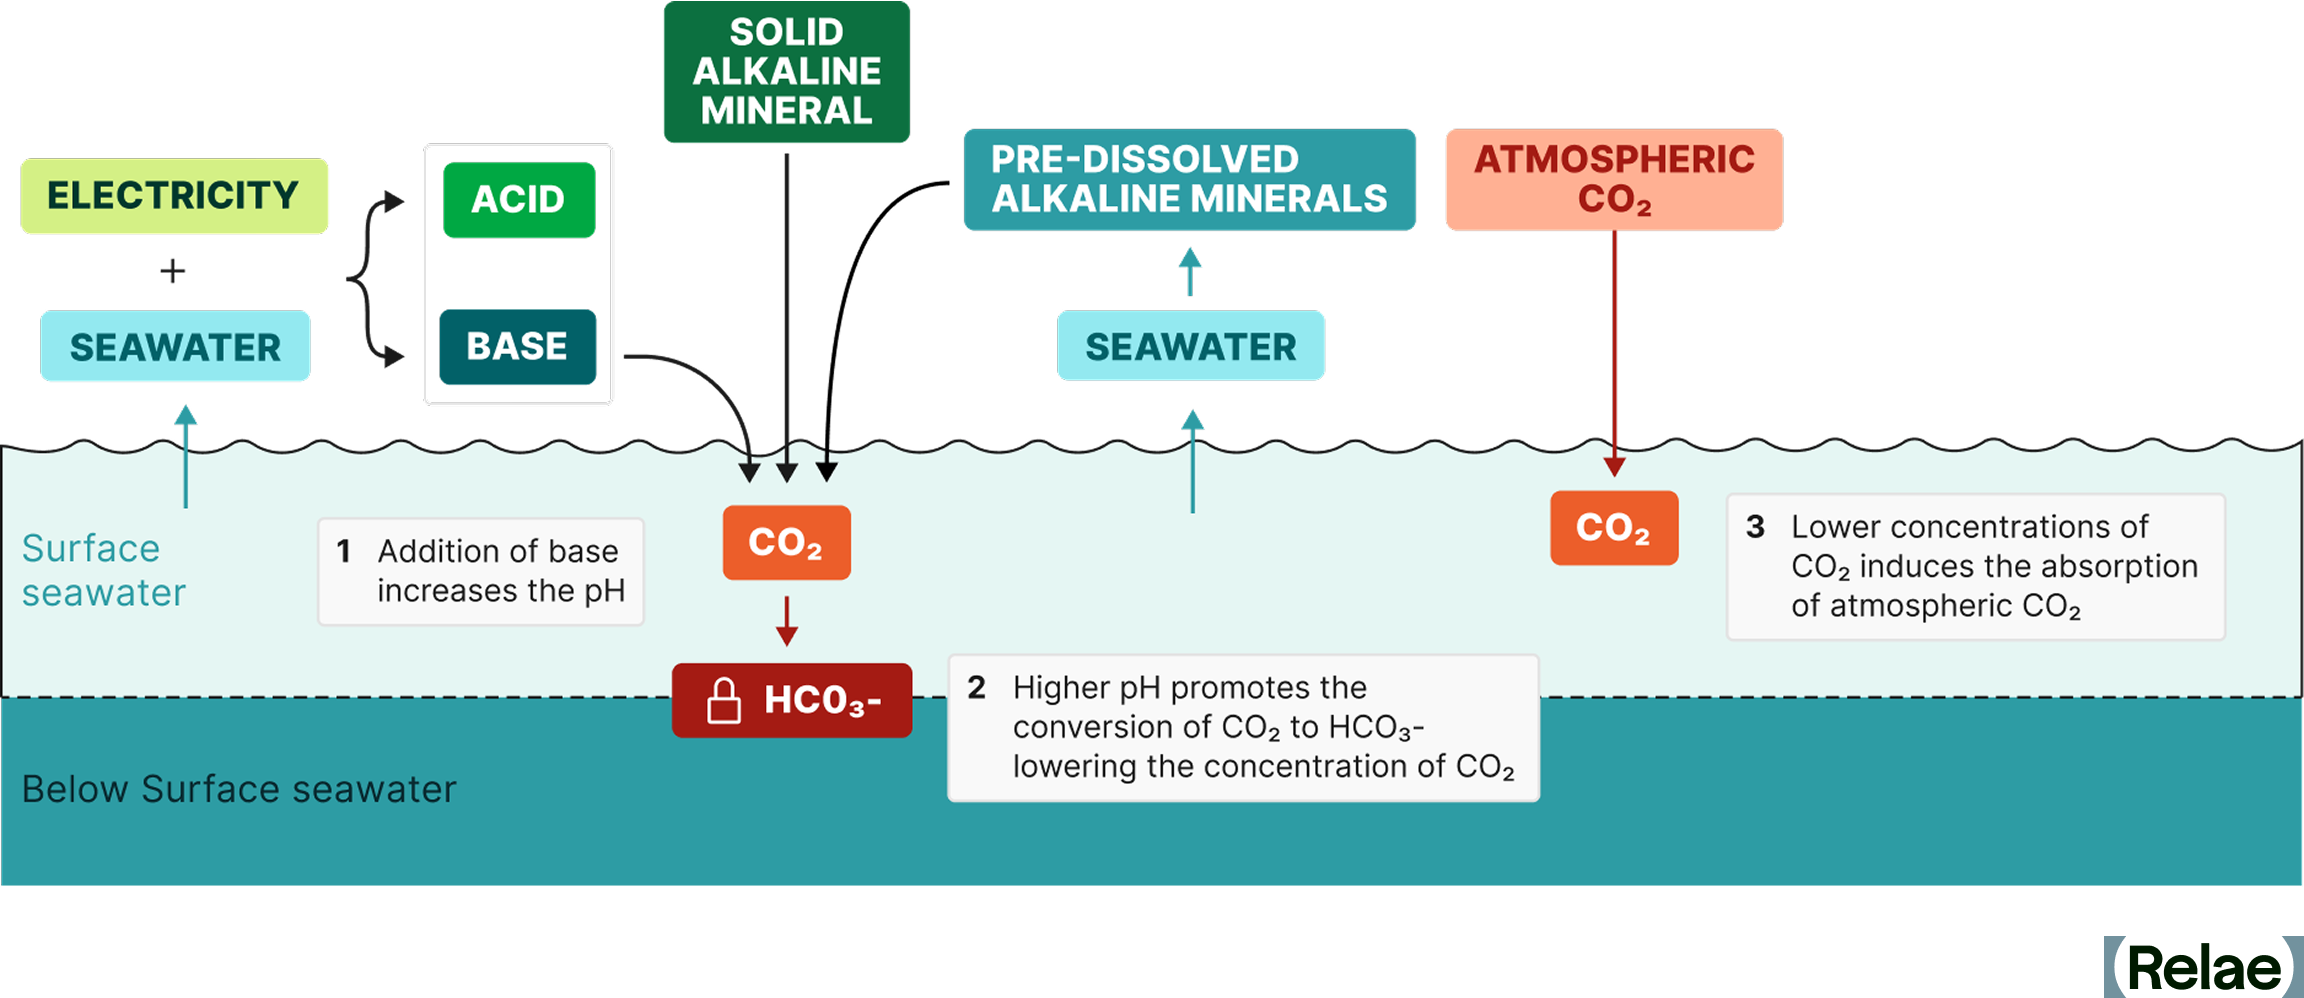
Ocean alkalinity enhancement (OAE) captures and stores atmospheric CO₂ as dissolved carbonates in the ocean by increasing the alkalinity of seawater using one of two primary methods:
- Adding alkaline minerals such as olivine or basalt to seawater.
- Using electrochemical methods to add alkaline compounds to seawater.
Both of these methods increase the alkalinity of seawater and, thereby, its capacity to absorb atmospheric CO₂ without acidification.
OAE methods can also differ by location and the manner in which seawater interacts with alkaline substances and atmospheric CO₂. This interaction may occur in the open ocean or within a controlled mCDR project facility. Each approach involves trade-offs: open ocean methods tend to be less energy-intensive but present greater uncertainties and challenges in measurement, reporting, and verification (MRV).
Understanding Direct Ocean Removal (DOR)
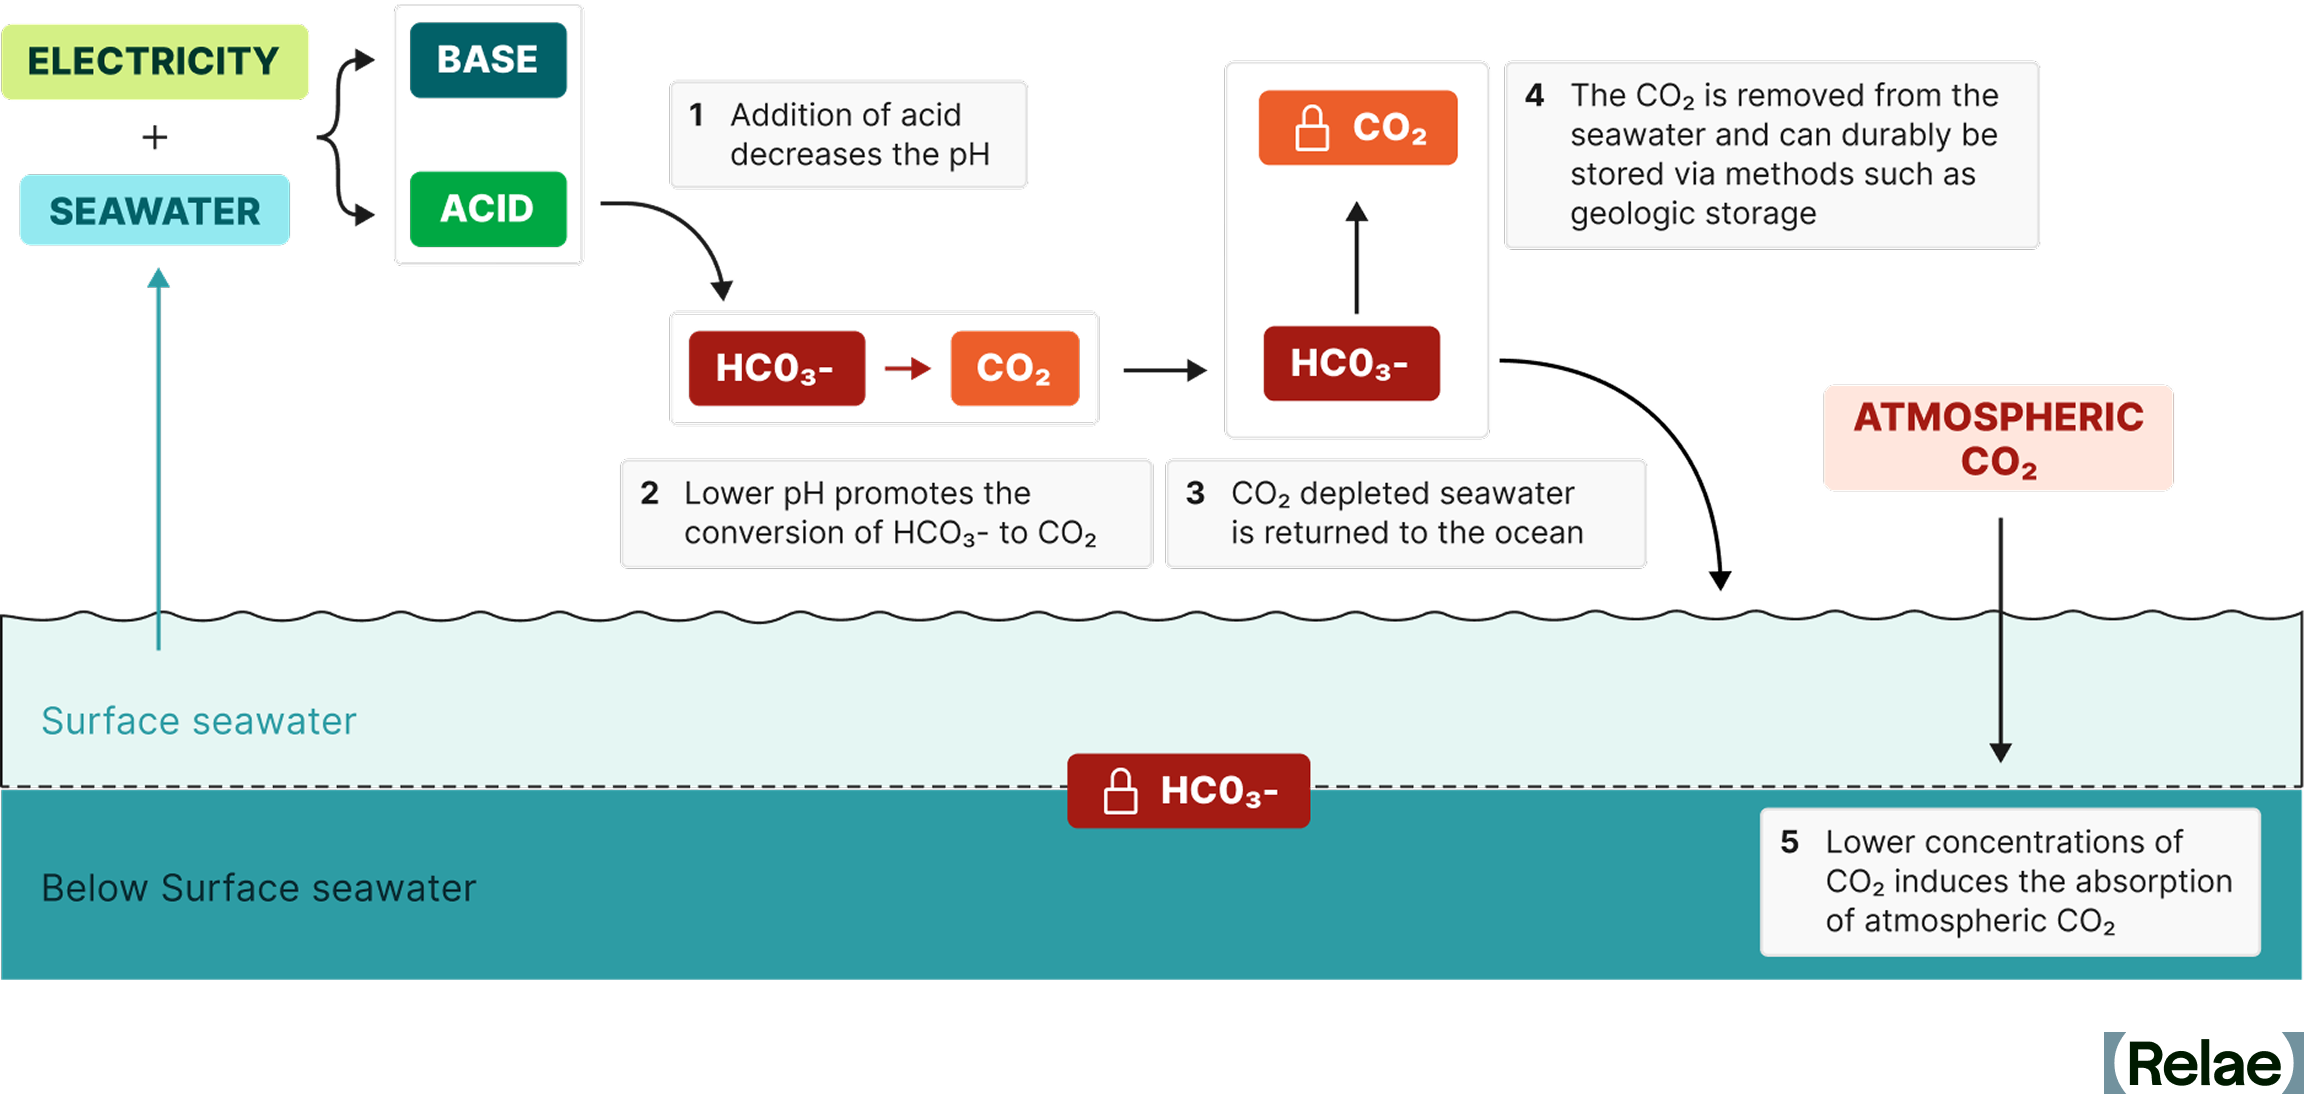
Direct ocean removal (DOR), also called direct ocean capture (DOC), removes CO₂ dissolved in seawater using the controlled acidification of seawater in a closed system using one of two primary methods:
- Electrochemical methods such as electrolysis of seawater or electrodialysis
- The addition of minerals like olivine and basalt.
The acidified and CO₂ depleted seawater is neutralized to native pH and allowed to equalize with and remove atmospheric CO₂. Once removed, CO₂ can be safely stored using geologic storage with a durability of >1,000 years.
Nomenclature for Direct Ocean Removal
Direct ocean removal is more commonly referred to as direct ocean capture. Relae believes the term direct ocean removal (DOR) is more accurate for two reasons:
- We think it is scientifically more accurate as both OAE and DOR remove CO₂ from the atmosphere but DOR directly removes CO₂ from the oceans, where in OAE, CO₂ is captured as bicarbonates in the ocean.
- DOC is a term for dissolved organic carbon, which is frequently used in mCDR project documents, reports, and the scientific literature.
Key Benefits of Marine Carbon Dioxide Removal
Understanding how mCDR works highlights its potential to address climate challenges. Here are the key benefits that make it a critical tool in global decarbonization strategies.
- Scalable carbon removal without land constraints: Marine carbon dioxide removal does not require large land areas or significant freshwater resources, making it highly scalable.
- Harnessing the ocean’s natural carbon sink: The ocean absorbs about 25% of human-generated CO₂ annually. mCDR enhances this natural process, increasing carbon storage without accelerating ocean acidification.
- Diverse technological pathways for flexibility: Technologies like ocean alkalinity enhancement and direct ocean removal offer flexible solutions tailored to different environments and project needs.
- Global reach with a large surface area: Covering over two-thirds of the Earth’s surface, the ocean provides an expansive platform for mCDR technologies globally.
- Potential to mitigate ocean acidification: Some mCDR methods, such as ocean alkalinity enhancement, not only remove CO₂ but also help restore ocean pH levels, supporting marine ecosystem health.
Challenges of Marine Carbon Dioxide Removal
While mCDR holds significant promise, it also presents challenges that must be addressed for responsible deployment.
- Technical scalability and efficiency: Scaling mCDR technologies to achieve meaningful carbon removal while maintaining energy efficiency remains a significant hurdle.
- Potential environmental impacts: Altering ocean chemistry may pose risks to marine ecosystems, with long-term effects still not fully understood.
- Measurement, reporting, and verification (MRV) complexity: Accurately measuring CO₂ removal and ensuring its durability requires advanced monitoring systems, which are still evolving.
- Regulatory and governance gaps: Clear global policies are needed to oversee mCDR deployment, manage environmental risks, and ensure accountability.
- Public perception and ethical considerations: Concerns around geoengineering and potential unintended consequences may impact public acceptance and policy support.
Deploying Marine Carbon Dioxide Removal
As mCDR technologies evolve, effective deployment will rely on adaptive management practices to address technical, environmental, and regulatory challenges. This includes robust MRV systems for accurate CO₂ removal tracking and continuous ecosystem monitoring to mitigate potential risks to marine life.
Collaborative efforts between scientists, policymakers, and project developers are key to establishing clear regulatory frameworks, optimizing technologies for efficiency and scalability, and building public trust. These practices ensure mCDR can be scaled responsibly while safeguarding ocean health.
The Future of Marine Carbon Dioxide Removal
As technologies like ocean alkalinity enhancement and direct ocean removal advance, their potential to deliver large-scale, durable carbon removal is becoming increasingly evident. Realizing this potential requires more than technological innovation—it depends on rigorous environmental monitoring, transparent reporting, and strong collaboration among project developers, carbon buyers, and policymakers.
Establishing clear, consistent standards for high-quality mCDR is essential to ensure both climate effectiveness and environmental safety. To support this, Microsoft and Relae have partnered to develop the Criteria for High-Quality Carbon Dioxide Removal.
Frequently Asked Questions
What is marine carbon dioxide removal (mCDR)?
mCDR uses ocean-based processes, primarily ocean alkalinity enhancement and direct ocean removal, to capture and durably store atmospheric CO₂. It works by increasing the ocean's natural capacity to absorb CO₂ without increasing acidification.
How does marine carbon dioxide removal compare to land-based methods like direct air capture or reforestation?
Unlike land-based approaches, mCDR doesn't require large land areas or freshwater, and the ocean's size gives it significant scaling potential. It's earlier-stage than more established pathways, though, with measurement and environmental monitoring standards still maturing.
Is marine carbon dioxide removal proven and scalable today, or still emerging?
mCDR technologies have shown promising results in lab testing and early deployments, but confirming safety and effectiveness at a large real-world scale requires more monitoring data. It's best described as an emerging pathway with strong near-term momentum, not yet a mature, at-scale solution.
What should a company look for when evaluating a marine carbon dioxide removal project or credits?
Buyers should look for rigorous carbon MRV paired with equally rigorous monitoring of ocean ecosystem health (eMRV), transparent reporting, and adherence to established frameworks like the Criteria for High-Quality Carbon Dioxide Removal.
Carbon Removal
Relae helps carbon removal buyers, investors, suppliers, and project developers navigate a complex market shaped by evolving science, quality standards, delivery risk, and claims expectations. We combine carbon removal strategy, project-level diligence, and market intelligence informed by work with leading buyers and project developers to help you assess quality, build diversified portfolios, and scale high-integrity carbon removal.
Ready to Navigate What Comes Next?





What to Read Next
GHG Protocol Releases New Land Sector and Removals Standard
Key Takeaways
- On January 30, 2026, the Greenhouse Gas Protocol (GHG Protocol) released its long-awaited Land Sector and Removals (LSR) Standard v1.0 following a 5-year consultation process. The LSR Standard is set to take effect on January 1, 2027.
- The release of the LSR Standard represents a notable development for companies in the food and agriculture sector looking to report on land-based GHG emissions in their annual GHG inventory, as well as companies that plan to report on carbon dioxide removals (both land-based and technological).
- The accompanying Land Sector and Removals Guidance, which will provide further direction on operationalizing and implementing the LSR Standard, is expected in Q2 of 2026. However, companies with significant land-based activities may want to begin assessing the impacts of the LSR Standard on their emissions accounting procedures and decarbonization strategies today.
Why the Land Sector and Removals Standard Matters Now
Emissions from agriculture and land use change account for roughly a quarter of global emissions. Yet, for years, food, fiber, and fuel companies have lacked a clear framework for accounting and reporting on GHG emissions and carbon dioxide removals from land use. This has significantly limited their ability to demonstrate progress toward climate targets within their operations and value chain. The GHG Protocol’s Land Sector and Removals (LSR) Standard, which was released on January 30, 2026, changes that, and in doing so raises a new set of questions.
The LSR Standard provides greater clarity on what is required of companies to transparently track and report against their emissions reduction and removal targets, and opens new pathways to report on supply chain decarbonization interventions. It also represents an important advancement for companies seeking to report on carbon dioxide removals within their emissions inventory, including both land management removals and technological removals with geologic storage.
While the LSR Standard contains notable new requirements compared to the draft released in 2022, companies still face a number of open questions related to implementation and the implications for their decarbonization strategies.
The GHG Protocol’s accompanying Land Sector and Removals Guidance, scheduled for Q2 2026, is expected to offer more practical direction for implementing the LSR Standard. However, companies with significant land-based activities that require sufficient lead time to prepare should consider assessing the impacts today.
Below, we provide an overview of the LSR Standard, key changes from the 2022 draft, and actionable next steps for food, fiber, and fuel companies considering the impacts on their target-setting and emissions reporting.
What Is the Land Sector and Removals Standard?
The LSR Standard, taking effect on January 1, 2027, sets requirements and recommendations for corporate GHG accounting that cover emissions and carbon removals from agricultural and land use activities. It builds on existing GHG Protocol standards for corporate carbon accounting. Notably, the LSR Standard does not cover the forestry sector, a key break from the 2022 draft. Forest carbon accounting guidance remains under development and will be the subject of a stakeholder consultation/request for information process expected later in 2026.

Land Sector and Removals Standard vs Land Sector and Removals Guidance
The LSR Standard establishes the core requirements companies must follow, while the accompanying Land Sector and Removals Guidance, expected in Q2 of 2026, will provide more detailed implementation support. In short, the LSR Standard sets the "what" while the Land Sector and Removals Guidance will explain the "how," helping companies put those requirements into practice.
Who Should Be Using the Land Sector and Removals Standard?
The LSR Standard applies to two groups of companies:
- Any company with significant1 land-sector activities within its own operations or value chain (most notably the food, feed, fiber, biofuel, and advanced biomaterials sector).
- Any company looking to report on carbon dioxide removals within their scope 1 and scope 3 inventories (including both land management removals or technological removals).
Land management carbon dioxide removals include those from carbon sequestration through farming practices, agroforestry, or silvopastural systems on productive agricultural land. Technological carbon dioxide removals, by contrast, refer to more engineered approaches such as direct air carbon capture and storage (DACCS) or bioenergy carbon capture and storage (BECCS).
What Changed From the 2022 Draft?
Among other provisions, the LSR Standard contains notable breaks from the 2022 draft, including specific changes related to traceability, carbon dioxide removals, leakage, and land use change.
Traceability: A New Approach
Under the LSR Standard, companies that account for scope 3 emissions, removals, and other metrics must apply a spatial boundary. This boundary is determined by the level of traceability they can establish to known lands or regions (from least to most granular): global, jurisdictional (e.g., country), sourcing region (e.g., supply shed), land management unit (LMU) (e.g., farm), or harvested area. For more granular spatial boundaries, such as sourcing region and LMU, companies are required to establish physical traceability, which can be demonstrated through various chain of custody models.
The LSR Standard defines sourcing regions as predefined, spatially-explicit land areas that supply a raw material to its first point of aggregation or first processing facility in the value chain. The GHG Protocol allows some flexibility in how these boundaries are drawn. They can be defined at a tier of the value chain that includes multiple first points of aggregation or first processing facilities whose supply areas overlap.
Alongside higher integrity chain of custody models such as identity preserved, segregated, and controlled blending, the LSR Standard opens to mass balance as a chain of custody model that can be used to demonstrate physical traceability at the sourcing region-level with appropriate safeguards.
This is notable because mass balance is the most common chain of custody model for large volume agricultural commodities, and physical traceability is required to report removals according to the LSR standard. While challenges for reporting removals at sourcing region spatial boundaries still exist, this change unlocks new opportunities to decarbonize commodities and report removals within non-segregated supply chains through insetting programs.
Carbon Dioxide Removals: Clarity on Spatial Boundaries
The draft LSR Standard introduces key principles for companies choosing to report land management carbon dioxide removals, including traceability, data quality, and permanence. Translating those principles into practice remains challenging given the dynamic nature of agricultural supply chains and limited farm-level traceability.
Among other requirements, the LSR Standard maintains that companies electing to report on removals must do so as a separate accounting category from emissions. They must also identify the specific lands where carbon is stored, and conduct ongoing storage monitoring to detect and report on reversals if and when they occur.
The LSR Standard does, however, resolve one of the more consequential open questions left by the 2022 draft: where companies are to draw the spatial boundary for reporting land management carbon dioxide removals. By formalizing and permitting traceability at the sourcing-region level (with appropriate safeguards), it offers a workable middle ground between farm-level precision and the broader supply chain realities that most food and agricultural companies face.
The LSR Standard also opens to using alternative approaches to traceability, such as impact traceability, which allows companies to trace removals back to the LMU through a pathway that is separate from the physical GHG inventory. This is notable as it provides companies with optionality for recognition of farm-level supply chain investments even when physical traceability cannot be established, and inventory recognition is therefore not feasible.
Land Use and Leakage: Stronger Requirements
Finally, the LSR Standard significantly strengthens land use and economic leakage requirements compared to the 2022 draft. While the draft gave companies flexibility to choose among land-tracking metrics, the LSR Standard mandates that all companies report land occupation for both scope 1 and scope 3 in hectares and quantify land carbon leakage whenever “high leakage risk activities”2 displace food or feed production. This includes companies developing crop-based biofuels and bio-based feedstocks.
Leakage must be quantified using the Carbon Opportunity Cost, a calculation aimed at capturing how much carbon could have been stored in the absence of land management activities.
What Should Companies Do Now?
For entities reporting in accordance with the GHG Protocol’s Corporate Standard and Scope 3 Standard, the new LSR Standard goes into effect on January 1, 2027. However, the GHG Protocol’s Land Sector and Removal Guidance is not set for publication until Q2 2026, leaving many open questions related to implementation amid a short data collection and reporting cycle
In the interim, companies may consider a continuous improvement approach, evolving and improving their internal measurement and reporting mechanisms to enable more granular accounting over time. Companies may also consider running analyses to assess the impact of new requirements on the design and cost of decarbonization strategies, with a specific focus on data collection and monitoring approaches.
Ultimately, while implementation of the LSR Standard may evolve over time, it need not delay action on value chain intervention. Companies that continue investing in supply chain decarbonization are building the data infrastructure, supplier relationships, and operational resilience that yield greater visibility into supply chain risk and drive long-term value, independent of reporting standards.
As the LSR Standard's requirements develop, companies that have already begun assessing their emissions footprint and strengthening supply chain traceability and data quality are likely to be better positioned to align their reporting procedures accordingly.
Marine Carbon Dioxide Removal: What It Is and How It Works
Key Takeaways
- Marine carbon dioxide removal (mCDR) uses ocean-based processes—primarily ocean alkalinity enhancement (OAE) and direct ocean removal (DOR)—to capture and durably store atmospheric carbon dioxide (CO₂), without the land and freshwater constraints of terrestrial methods.
- The ocean already absorbs roughly 29% of human-caused CO₂ emissions each year, according to the 2025 Global Carbon Budget, and mCDR technologies aim to safely enhance that natural uptake without worsening ocean acidification.
- For corporate carbon buyers and project developers evaluating mCDR, the Criteria for High-Quality Marine Carbon Dioxide Removal, developed by Microsoft and Relae, outlines standards to guide responsible mCDR deployment at scale.
Reducing carbon dioxide (CO₂) emissions alone is no longer sufficient to limit global warming to 1.5°C. To effectively address climate change, scientific consensus highlights the need to remove carbon dioxide already present in the atmosphere. Marine carbon dioxide removal (mCDR), a form of ocean-based carbon removal, offers a scalable solution by leveraging the ocean’s natural ability to absorb and store carbon, without the land and resource limitations associated with terrestrial carbon removal methods.
This guide explores the fundamentals of marine carbon dioxide removal, including how it works, the technologies involved, and its role in global decarbonization.
What Is Marine Carbon Dioxide Removal?
Marine carbon dioxide removal uses ocean-based processes to capture and store carbon dioxide from the atmosphere. mCDR techniques fall into two primary categories:
- Biotic CDR, which includes using photosynthetic fixation, microalgae cultivation, and terrestrial biomass sinking, to capture and store carbon.
- Abiotic CDR, which influences CO₂ concentrations and carbonate chemistry in the seawater to absorb atmospheric CO₂ without increasing acidity. There are two main abiotic mCDR pathways: ocean alkalinity enhancement (OAE) and direct ocean removal (DOR).
How Does Marine Carbon Dioxide Removal Work?
Marine carbon dioxide removal functions via the air-sea gas exchange—a process by which the atmosphere and surface seawater maintain equal CO₂ concentrations—meaning a shift in one leads to a corresponding change in the other. This exchange allows the ocean to absorb or release CO₂ back into the atmosphere depending on concentration levels and factors like pH.
Once absorbed by the ocean, CO₂ exists in several forms, including dissolved CO₂, carbonates, and bicarbonates, influencing the ocean's pH levels. As atmospheric CO₂ levels rise, the oceans absorb roughly 12 GtCO2 annually, approximately 29% of anthropogenic CO2 emissions. This increase is disrupting the natural CO₂ balance and contributing to ocean acidification.
mCDR methods like ocean alkalinity enhancement and direct ocean removal use safe and controlled processes to increase the amount of CO2 absorbed from the atmosphere while mitigating acidification.
Understanding Ocean Alkalinity Enhancement (OAE)
Ocean alkalinity enhancement (OAE) captures and stores atmospheric CO₂ as dissolved carbonates in the ocean by increasing the alkalinity of seawater using one of two primary methods:
- Adding alkaline minerals such as olivine or basalt to seawater.
- Using electrochemical methods to add alkaline compounds to seawater.
Both of these methods increase the alkalinity of seawater and, thereby, its capacity to absorb atmospheric CO₂ without acidification.
OAE methods can also differ by location and the manner in which seawater interacts with alkaline substances and atmospheric CO₂. This interaction may occur in the open ocean or within a controlled mCDR project facility. Each approach involves trade-offs: open ocean methods tend to be less energy-intensive but present greater uncertainties and challenges in measurement, reporting, and verification (MRV).
Understanding Direct Ocean Removal (DOR)
Direct ocean removal (DOR), also called direct ocean capture (DOC), removes CO₂ dissolved in seawater using the controlled acidification of seawater in a closed system using one of two primary methods:
- Electrochemical methods such as electrolysis of seawater or electrodialysis
- The addition of minerals like olivine and basalt.
The acidified and CO₂ depleted seawater is neutralized to native pH and allowed to equalize with and remove atmospheric CO₂. Once removed, CO₂ can be safely stored using geologic storage with a durability of >1,000 years.
Nomenclature for Direct Ocean Removal
Direct ocean removal is more commonly referred to as direct ocean capture. Relae believes the term direct ocean removal (DOR) is more accurate for two reasons:
- We think it is scientifically more accurate as both OAE and DOR remove CO₂ from the atmosphere but DOR directly removes CO₂ from the oceans, where in OAE, CO₂ is captured as bicarbonates in the ocean.
- DOC is a term for dissolved organic carbon, which is frequently used in mCDR project documents, reports, and the scientific literature.
Key Benefits of Marine Carbon Dioxide Removal
Understanding how mCDR works highlights its potential to address climate challenges. Here are the key benefits that make it a critical tool in global decarbonization strategies.
- Scalable carbon removal without land constraints: Marine carbon dioxide removal does not require large land areas or significant freshwater resources, making it highly scalable.
- Harnessing the ocean’s natural carbon sink: The ocean absorbs about 25% of human-generated CO₂ annually. mCDR enhances this natural process, increasing carbon storage without accelerating ocean acidification.
- Diverse technological pathways for flexibility: Technologies like ocean alkalinity enhancement and direct ocean removal offer flexible solutions tailored to different environments and project needs.
- Global reach with a large surface area: Covering over two-thirds of the Earth’s surface, the ocean provides an expansive platform for mCDR technologies globally.
- Potential to mitigate ocean acidification: Some mCDR methods, such as ocean alkalinity enhancement, not only remove CO₂ but also help restore ocean pH levels, supporting marine ecosystem health.
Challenges of Marine Carbon Dioxide Removal
While mCDR holds significant promise, it also presents challenges that must be addressed for responsible deployment.
- Technical scalability and efficiency: Scaling mCDR technologies to achieve meaningful carbon removal while maintaining energy efficiency remains a significant hurdle.
- Potential environmental impacts: Altering ocean chemistry may pose risks to marine ecosystems, with long-term effects still not fully understood.
- Measurement, reporting, and verification (MRV) complexity: Accurately measuring CO₂ removal and ensuring its durability requires advanced monitoring systems, which are still evolving.
- Regulatory and governance gaps: Clear global policies are needed to oversee mCDR deployment, manage environmental risks, and ensure accountability.
- Public perception and ethical considerations: Concerns around geoengineering and potential unintended consequences may impact public acceptance and policy support.
Deploying Marine Carbon Dioxide Removal
As mCDR technologies evolve, effective deployment will rely on adaptive management practices to address technical, environmental, and regulatory challenges. This includes robust MRV systems for accurate CO₂ removal tracking and continuous ecosystem monitoring to mitigate potential risks to marine life.
Collaborative efforts between scientists, policymakers, and project developers are key to establishing clear regulatory frameworks, optimizing technologies for efficiency and scalability, and building public trust. These practices ensure mCDR can be scaled responsibly while safeguarding ocean health.
The Future of Marine Carbon Dioxide Removal
As technologies like ocean alkalinity enhancement and direct ocean removal advance, their potential to deliver large-scale, durable carbon removal is becoming increasingly evident. Realizing this potential requires more than technological innovation—it depends on rigorous environmental monitoring, transparent reporting, and strong collaboration among project developers, carbon buyers, and policymakers.
Establishing clear, consistent standards for high-quality mCDR is essential to ensure both climate effectiveness and environmental safety. To support this, Microsoft and Relae have partnered to develop the Criteria for High-Quality Carbon Dioxide Removal.
Frequently Asked Questions
What is marine carbon dioxide removal (mCDR)?
mCDR uses ocean-based processes, primarily ocean alkalinity enhancement and direct ocean removal, to capture and durably store atmospheric CO₂. It works by increasing the ocean's natural capacity to absorb CO₂ without increasing acidification.
How does marine carbon dioxide removal compare to land-based methods like direct air capture or reforestation?
Unlike land-based approaches, mCDR doesn't require large land areas or freshwater, and the ocean's size gives it significant scaling potential. It's earlier-stage than more established pathways, though, with measurement and environmental monitoring standards still maturing.
Is marine carbon dioxide removal proven and scalable today, or still emerging?
mCDR technologies have shown promising results in lab testing and early deployments, but confirming safety and effectiveness at a large real-world scale requires more monitoring data. It's best described as an emerging pathway with strong near-term momentum, not yet a mature, at-scale solution.
What should a company look for when evaluating a marine carbon dioxide removal project or credits?
Buyers should look for rigorous carbon MRV paired with equally rigorous monitoring of ocean ecosystem health (eMRV), transparent reporting, and adherence to established frameworks like the Criteria for High-Quality Carbon Dioxide Removal.
US Wood Pellet Producers: The UK Market Is Contracting. Four Markets Are Beginning.
Key Takeaways
- The UK's new biomass Contracts for Difference framework will cut industrial wood pellet imports by slightly more than half starting in April 2027. As a result, US producers will be left competing for only 1.6 million GST, an 80% reduction in US-addressable volume, with no successor market locked in.
- US wood pellet producers who move now to upgrade sustainability credentials and build relationships in emerging markets will be best positioned to capture the next generation of demand; those who wait may find the most attractive offtake opportunities already structured around someone else's supply.
- Four domestic markets now present producers with new demand opportunities: cofiring, sustainable aviation fuel (SAF), low-carbon steel, and bioenergy with carbon capture and storage (BECCS). Of these, BECCS for data centers is the strongest structural fit: hyperscalers need clean firm power, pellet mills need offtakers, and the feedstock infrastructure is already in place.
The Demand Cliff Is Real, and the Timeline Is Short
A pellet made in southern Mississippi this morning will be burned in a UK boiler about four weeks later. North America is on pace to ship more than 9 million green short tons (GST) of pellets to the UK each year—making the UK the world's largest consumer of wood pellets since 2018. The US Southeast is at the center of that supply chain: 28 large mills, 13.5 million GST of production capacity, rail spurs, export terminals, and bulk carriers, built almost entirely around UK demand.
However, the UK's new low-carbon Contracts for Difference (CfD) framework caps biomass power generators at a 27% annual capacity factor starting April 2027, down from roughly 64% today. When run hours fall by half, pellet demand follows. Existing subsidies expire in the first quarter of 2027, and the new CfD runs only to March 2031 with no commitment beyond that. Plant closures in Arkansas and Washington state, along with reduced output in Canada, are already early signals of supply chain contraction.
The Math of Who Gets Squeezed
The math is stark. By the second quarter of 2027, total annual UK pellet demand drops to 4.9 million GST. Of that:
- Approximately 2.3 million GST goes to captive, integrated UK supply chains.
- Approximately 1.0 million GST goes to Baltic suppliers, whose shipping times of one week or less become a decisive advantage as UK plants shift from baseload to dispatchable operation.
That leaves US producers competing for only 1.6 million GST. If Baltic suppliers capture more, US wood pellet exports to the UK could be effectively eliminated by 2031.
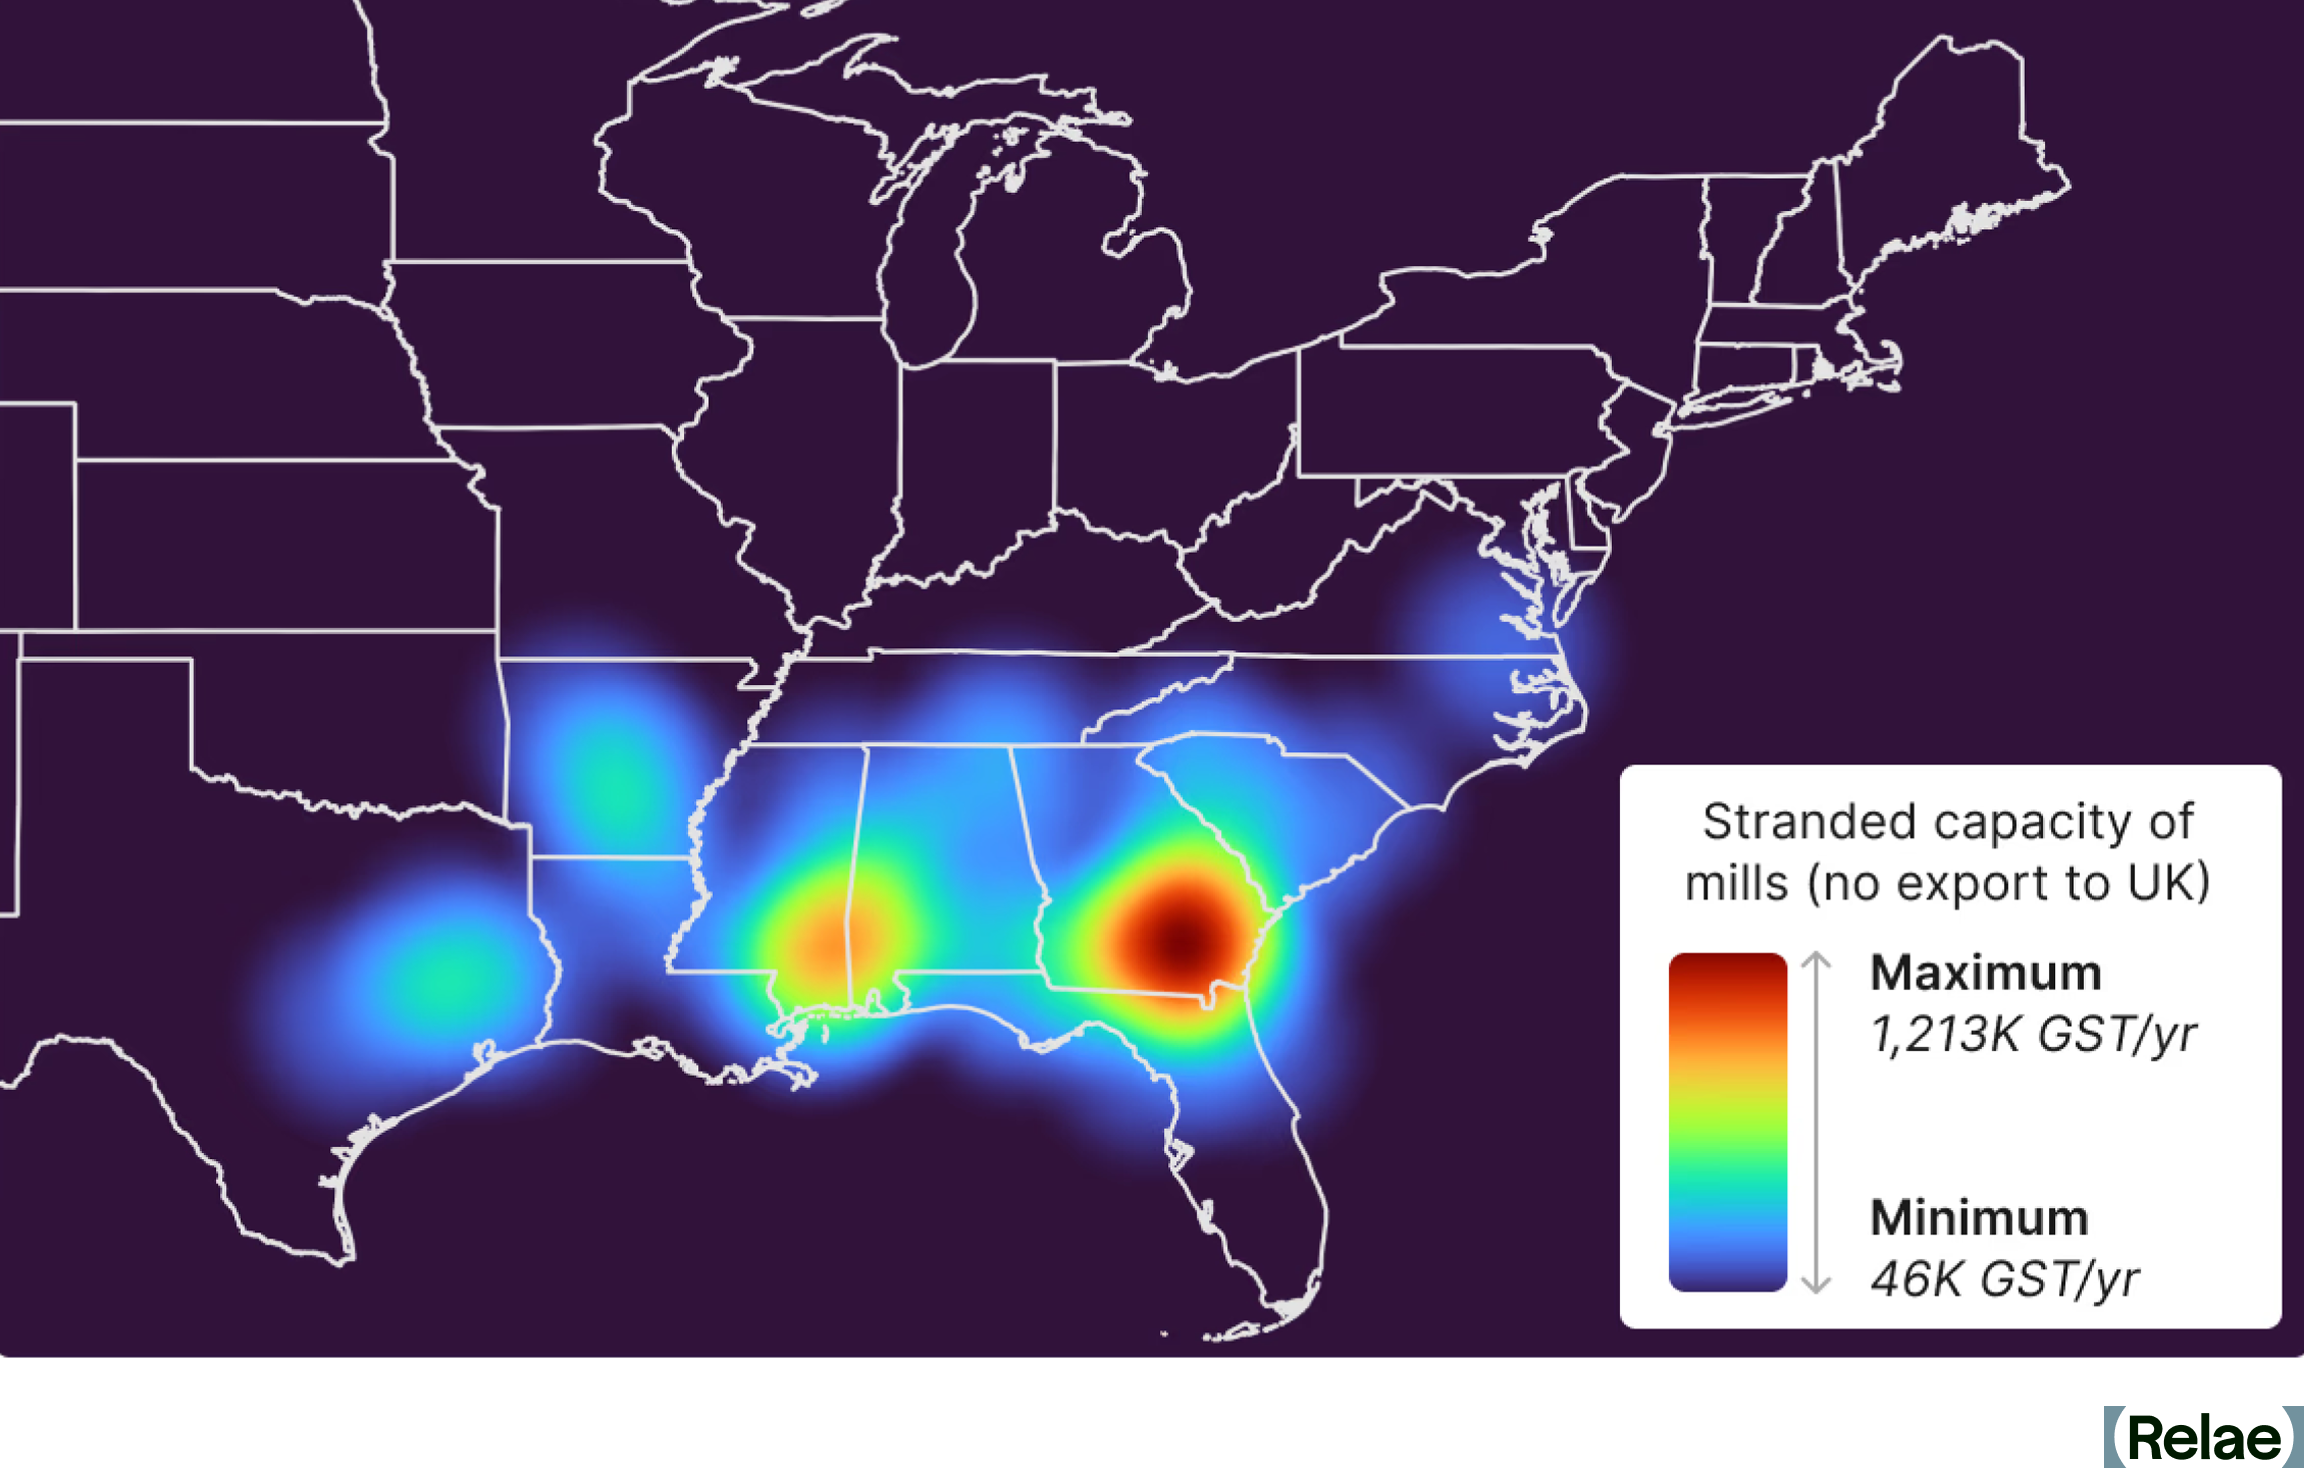
Sustainability qualification is also tightening. The new CfD cuts the supply-chain emissions ceiling from 55.6 grams of carbon dioxide equivalent per megajoule (gCO₂e/MJ) to 36.6 gCO₂e/MJ. The framework assesses compliance mill by mill, not on a portfolio average. A cleaner mill cannot carry a dirtier sibling through the door.
The producers who understand this math now have roughly 18 months to position themselves for what comes next.
From Stranded Supply to New Markets
The US Southeast's wood basket is robust: abundant inventory, strong growth-to-removal ratios, and more available residues than ever. The infrastructure is in place. The question is whether the next generation of markets can be developed quickly enough to redeploy this supply before the infrastructure sits idle.
Four pathways stand out as the strongest options for redeploying US pellet supply: BECCS for data centers, low-carbon steel, SAF, and domestic cofiring. We have rigorously assessed the logistics economics, sustainability cases, and project development for each.
BECCS for Data Centers: The Strongest Structural Fit
BECCS as a power source for data centers is the most compelling match for the situation pellet producers now face. The timing, feedstock requirements, and buyer characteristics align closely in a way that few other emerging markets can match.
Hyperscalers, the large data center operators driving an unprecedented surge in electricity demand, are signing deals for nuclear, geothermal, and small modular reactors alongside natural gas and renewables. They are doing this because annual Renewable Energy Certificates (RECs) are no longer sufficient to compensate for their scope 2 emissions, and they need clean, firm generation that can be matched to load on an hourly basis.
BECCS delivers exactly that. The Louisiana Green Fuels project—advanced by Strategic Biofuels and Relae (formerly Carbon Direct)—illustrates the model: regionally sourced forestry residues and sawmill waste generate 75 megawatts (MW) of firm electricity while sequestering over one million tonnes of CO₂ annually in deep saline formations. An ample supply of wood pellets creates a strategic opportunity for similar projects to move forward with certainty around feedstock processing, logistics, and costs.
The remaining commercial barrier is deal structure, not technology. No data center operator has yet signed an agreement to purchase both the electricity and carbon removal credits from a single BECCS plant. As scope 2 accounting tightens and domestic pellet supply becomes more readily available post-2027, the conditions for structuring the first such deal are improving fast.
"Pellet mills and data center developers have complementary problems: mills need offtakers, and data centers need local, dispatchable, clean power they can match to load on an hour-by-hour basis. BECCS is one of the few technologies that could solve both at once, and hyperscalers have shown they are willing to back early-stage clean firm power when the asset makes sense."
—Douglas Bryan, Senior Power and Energy Systems Modeler
Low-Carbon Steel: Certification Frameworks Are Arriving
Wood-derived biocarbon has a long-established niche in steelmaking. Brazil produces roughly 10% of its steel and 30% of its pig iron using charcoal from managed eucalyptus plantations—a proof of concept for biomass as a metallurgical input, if not a direct template for US producers. The plantations measurably lowered groundwater in producer regions of Minas Gerais, and charcoal's mechanical weakness relative to fossil coke has limited the model's reach beyond Brazil.
Current pilot projects use biomass in two roles. As a fuel, industrial trials have demonstrated 10% bio-coal co-injection without operational disruption, with reviews estimating that full replacement could cut blast-furnace CO₂ by around 27% per tonne of hot metal. As a reductant, biocoke is already being demonstrated at Outokumpu's pelletizing plant in Tornio, Finland. ArcelorMittal in Belgium and Tata Steel in India are running biomass pilots at tens of thousands of tonnes per year.
What makes this market worth serious attention now is the certification landscape. The Low Emission Steel Standard issued its first certifications in September 2025. The Global Steel Climate Council's Steel Climate Standard is under stakeholder review. In May 2025, Relae and Microsoft published Criteria for High-Quality Environmental Attribute Certificates in the Concrete and Steel Sectors. These frameworks allow producers to internalize carbon price and environmental attribute certificate (EAC) values, closing the cost gap against fossil coke that has historically constrained biocarbon demand.
Relae worked with Eramet, a global metals company pursuing biogenic materials as a substitute for fossil coke at its Norwegian smelters, to assess high-quality carbon dioxide removal methodologies and chart a path to generating and selling carbon credits from their decarbonization projects. Producers who align their sustainability credentials to these emerging standards now will be better positioned for offtake as commercial-scale demand grows.
"Steelmaker pilots and the first low-carbon steel certifications are opening green-steel offtake to wood pellets, though commercial-scale demand remains limited. The producers that thrive in this market will be those that reliably deliver pellets aligned with high-quality sustainability standards."
—Louisa Brotherson, Hybrid Decarbonization Scientist
Sustainable Aviation Fuel: Mandates Create a Durable Demand Signal
Wood-based SAF is technically feasible via gasification to syngas, followed by Fischer-Tropsch upgrading, a proven chemistry for converting syngas to liquid hydrocarbons. Yet, the commercial challenges are substantial: the International Civil Aviation Organization estimates capital costs exceeding US$1 billion for large facilities, and production costs of US$11–48 per gallon to distillate.
The cautionary case is Fulcrum Bioenergy near Reno, Nevada, which attempted a Fischer-Tropsch process using municipal solid waste and appears to have failed due to a lack of rigorous pre-implementation testing and unrealistic timelines, a reminder that feedstock homogeneity matters enormously, and one area where pellets have a relative advantage.
Two structural dynamics make SAF worth serious attention despite those barriers. First, the European Union's (EU) SAF mandate, starting at 2% of jet fuel supply and ramping to 70% by 2050, carves out cellulosic biomass as the only qualifying feedstock once cooking oil supply is exhausted. The penalty structure in both the EU and UK creates strong demand regardless of SAF price: EU non-compliance penalties run roughly three times the price of SAF, and UK penalties can reach 13 times the cost of the fuel itself. Second, the alcohol-to-jet pathway offers a lower-capital entry point than Fischer-Tropsch, as demonstrated by Project Speedbird, a British Airways and LanzaJet collaboration targeting UK woody residues.
The near-term question is which routes have bankable offtake. Very few do yet, but the mandate structure suggests that window will shift rapidly.
"So far, facilities haven't scaled to the levels required to meet timeline demand. But the EU and UK mandate structures mean buyers are greatly incentivized to purchase SAF even at high prices, rather than pay non-compliance penalties."
—John Dees, Director, Fuels and Industrial Commodities
Domestic Cofiring: Achievable, but Not a Long-Term Anchor
Cofiring biomass with coal to produce electricity or heat is the most immediately achievable option. Most US coal-fired power plants could displace up to 10% of their input energy with raw or torrefied pellets, though plants would likely need fuel handling upgrades. Some state policies, such as Pennsylvania's Alternative Energy Portfolio Standards Act of 2004, support cofiring to meet renewable energy goals. However, there are no federal policies in the US that incentivize cofiring.
The case for cofiring as a long-term market is weak. The US coal fleet has contracted steadily for economic reasons—over 100 gigawatts (GW) of coal-fired capacity retired between 2015 and 2025—and biomass cofiring is unlikely to make a coal plant more cost-competitive. The Greenhouse Gas Protocol's scope 2 guidance does not permit buyers to procure a "strip" of electricity representing the biomass-fired fraction of output from a cofired plant; instead, buyers must accept the average total emissions from the plant in their scope 2 inventory, which limits the value proposition for corporate buyers seeking to demonstrate clean energy procurement.
The more interesting version of this pathway combines cofiring with carbon capture and storage (CCS), a combination that creates a deeper-abatement value proposition and the kind of firm, dispatchable power that corporate buyers increasingly need.
"Cofiring is a proven step toward modest emissions reductions from coal-fired electricity, but it's hard to make the economic case for it when compared to applications that command price premiums for deeper climate abatement."
—A.J. Simon, Director of Industrial Decarbonization
Sustainability Is Now the Qualification Gate
Each of these markets is more discerning about sustainable biomass sourcing than the UK power sector was a decade ago. That shift will not reverse.
US Southeast wood has real potential for high-integrity sustainability credentials, particularly in softwood residues. But it also carries downside risks when sourcing from natural stands. Through work with producers, buyers, and project developers across these markets, we have found that four questions now drive every serious procurement conversation:
- Does the supply chain have verifiable governance and chain-of-custody transparency?
- Does sourcing respect the rights of Indigenous Peoples and local communities?
- Is the wood coming from regions where forest carbon stocks are stable or growing, and not from protected areas or primary forest?
- Is sourced biomass a by-product of non-energy uses, and not the primary silviculture driver?
Producers who can answer yes to all four, and support those answers with data, are more likely to access these emerging markets. Those who cannot will find it harder to compete for offtake.
For a detailed framework on how these principles translate into contract language and certification requirements, see the 2025 Sustainable Forest Biomass Sourcing for CDR: A Buyer's Guide.
The Window Is Open, but Not Indefinitely
The US Southeast wood basket is well-positioned for the markets described here. The infrastructure is in place. What producers still need to build is the market positioning, sustainability documentation, and offtake relationships to go with it.
The producers who move now will have a meaningful head start. Those who wait for certainty may find that the most attractive offtake opportunities have already been structured around someone else's supply.
Learn more about Relae's work on SAF mandates, steel decarbonization, and sustainable biomass sourcing.
Frequently Asked Questions
What happens to US wood pellet exports when the UK's new biomass rules take effect?
Starting April 2027, the UK's signed Contracts for Difference agreement caps subsidized biomass generation at a 27% capacity factor, roughly half of today's levels. That's expected to cut total UK pellet demand to about 4.9 million GST a year, leaving only around 1.6 million GST available to US exporters.
Is BECCS for data centers a proven market, or still emerging?
The underlying technology is credible, and the Louisiana Green Fuels project already demonstrates it at commercial scale. However, the deal structure isn't yet proven. No hyperscaler has signed a single contract for both electricity and carbon removal credits from one BECCS plant, so this market is emerging rather than established.
How does low-carbon steel demand compare to sustainable aviation fuel as a market for pellet producers?
Steel offers nearer-term certification frameworks (the Low Emission Steel Standard began issuing certifications in 2025) but limited commercial-scale volume so far. SAF has a stronger long-run demand signal thanks to EU and UK blending mandates and steep non-compliance penalties, but requires far higher capital investment to enter.
What should a wood pellet producer look for when evaluating a new market?
The four sourcing questions that now gate access across all these markets are: verifiable chain-of-custody, respect for Indigenous and local community rights, sourcing from stable or growing forest carbon stocks (not primary forest), and biomass that's a by-product of non-energy uses rather than the primary driver of harvest.
Carbon Removal, Reduction, and Avoidance Credits Explained
Key Takeaways
- Trust in carbon credits remains low. In part, this is because many mistakenly treat every credit type as interchangeable.
- Reduction, removal, and avoidance credits are verified against fundamentally different baselines, so credit quality must be judged based on type and project specifics, never with one blanket standard.
- The Integrity Council for the Voluntary Carbon Market's Core Carbon Principles now give buyers an independent bar to check against, including 44 methodologies approved across 13 eligible crediting programs, as of August 2026.
- Removal credits still make up only 5–6% of the market, even as compliance-driven demand accelerates, per our 2026 State of the Voluntary Carbon Market report.
Three Types of Carbon Credits: Reduction, Removal, and Avoidance
A carbon credit is a mechanism that allows one party to compensate another for their carbon mitigation activities. Based on their net emissions impact, there are three types of carbon credits: reduction, removal, and avoidance.
- Reduction credits reflect activities that decrease greenhouse gas emissions, compared to prior practices.
- Removal credits reflect activities that remove carbon dioxide already present in the atmosphere and oceans and lock it away for decades, centuries, or millennia.
- Avoidance credits reflect activities that prevent greenhouse gases from being emitted in the first place. For all three types, credits are assessed and issued by measuring or estimating how much carbon is reduced, removed, or avoided as a result of a credit purchase and its associated activities.
While credits are assessed in different ways depending on the type, one of the most important indicators of quality is a project's baseline - the emissions that would be present in a business-as-usual scenario, without action being taken to reduce, remove, or avoid them. Project developers use baselines as a means of comparison to assess the net emissions impact of a project.
- Baselines must be accurately set and data-driven.
- Emissions impacts of a project must be correctly calculated against its baseline.
Reduction, removal, and avoidance projects involve very different activities and, for some types of projects, it may be more challenging to establish an accurate baseline. However, without accurate baselines, climate impacts cannot be reliably determined.
Across the voluntary carbon market, Reduction credits represent roughly 20% of the purchases. Removal credits represent roughly 5% of the purchases. The remainder, roughly 75%, are avoidance credits.
Carbon Reduction Credits
Carbon reduction must drive the majority of our push to net zero, but translating carbon reduction activities into carbon credits that can be purchased is challenging. Examples of activities represented by carbon reduction credits include reducing fossil fuel use by improving fuel efficiency, or programs that reduce the methane that is generated from farms or municipal waste processing.
Reduction credits are measured and quantified against the baseline emissions of an existing technology or process. Some reduction credits are easy to track and measure, such as efficiency investments or destruction of fugitive methane. Other projects are more complex. For example, low-emission cookstove projects in developing regions rely on tracking patterns of cookstove use and quantifying emission factors for various fuel and stove combinations, both of which are hard to do. The result, as studies have shown, sometimes leads to overcrediting in reduction projects.
Superpollutant Credits
One class of reduction credit, superpollutant credits, has garnered recent attention. These credits involve the reduction of non-CO2 greenhouse gases with very strong radiative forcing, such as methane, nitrous oxides, or fluorinated gases like chlorofluorocarbons. These are not a substitute for CO2 removal, but can provide rapid and profound reductions at modest cost. Many different kinds of superpollutants exist in today’s market, worth roughly $60M today. Recent purchases by tech companies and others have highlighted the potential of these reduction credits.
Another class of reduction credit, transition credits, involves the deliberate early closure of emitting assets like coal-fired power plants or heavy manufacturing facilities. Early efforts by governments, banks, and companies around the world under the Just Energy Transition Partnership agreement jump-started transition credits as a concept at COP26. The Kinetic Coalition, in partnership with many groups including Relae, has launched work to bring transition credits to market with several pilot efforts, including closing a coal plant in the Philippines 10 years early.
Carbon Removal Credits
Projects that remove carbon come from a diverse set of solutions, from nature-based solutions like reforestation, to hybrid solutions like biochar, to engineered solutions such as direct air capture and storage. Roughly 5–6% of credits on the voluntary carbon market today are classified as removals, up from roughly 3% a few years ago.
Carbon removal baselines are determined differently depending on whether a project uses an engineered, hybrid, or nature-based solution. For engineered removals, the baseline is zero, because no carbon removal was occurring in the absence of the project. The credited removal will be the difference between the quantity of carbon removed and any emissions that occur to facilitate the removal (determined through a carbon credit life cycle assessment). Baselines for hybrid and nature-based removals can be more challenging. In natural systems, changes in carbon stocks created by removals must be measured and approximated over time, and creditable removals represent the additional carbon removed by the intervention relative to the baseline (e.g., fallow land versus a reforestation project).
Another important consideration for carbon removal credits is project durability, a measure of the likely duration of carbon storage. Stored carbon can re-enter the atmosphere either through deliberate actions (e.g., deforestation) or accidental ones (e.g., wildfires). Nature-based removals are especially vulnerable to being re-released and are usually considered less durable (i.e., stored for less than 50 years). In contrast, engineered solutions offer high durability (i.e., stored for hundreds to thousands of years), and hybrid removals also offer durability periods that are typically longer than those of nature-based removals.
While less durable, nature-based solutions are effective, cost-effective, and widely available today. They made up over 95% of all carbon removal credits issued in 2025. Engineered and hybrid solutions are more expensive and scarce but offer longer durability. Prices of engineered carbon removal are likely to fall with innovation and increased market participation, but are currently much higher than most nature-based credits. With SBTi's finalized Corporate Net-Zero Standard V2.0, this balance is likely to shift. Large companies must now purchase removal credits covering 1–100% of scope 1, scope 2, and scope 3 emissions between 2035 and their net-zero year, with an explicit focus on more durable CO2 removal credits.
Carbon Avoidance Credits
Examples of carbon avoidance include avoiding deforestation that would result in the release of carbon dioxide into the atmosphere or clean energy projects that avoid the release of emissions from burning fossil fuels in possible facilities. This can be confusing, since many avoided credits are called reduction credits, as is the case with projects under the Reducing Emissions from Deforestation and Forest Degradation (REDD+) framework. Avoidance credits make up roughly 75% of certified credits on the voluntary carbon market today - an overwhelming majority - in part due to high availability and low price.
Avoiding emissions is an important goal with numerous environmental, climate, community, and other benefits. Relae works with clients and customers across industries on developing and implementing strategies to avoid emissions within their value chain. However, there are significant challenges with the way that many carbon avoidance credits are created.
- Carbon avoidance credits are based on an estimate of the emissions that might have existed had a project not been funded. Because it is impossible to observe what might have happened in the absence of a project, carbon avoidance estimates are determined by considering historic data and contextual information. Statistical models can be used to create a presumed baseline that represents what would have happened in the absence of the project.
- Because the baseline is not observed in an avoided emissions project, there is uncertainty in calculating the number of carbon credits it produces. If the baseline is not set accurately, a project can overcredit. While the lack of a directly observed and measured baseline means avoidance credits will always have some degree of uncertainty, high-quality avoidance projects present compelling evidence to support their baselines, greatly reducing uncertainty.
New datasets, statistical techniques, and methodologies are providing opportunities for developing avoidance credits with more certainty. Three REDD+ methodologies have now cleared the Integrity Council for the Voluntary Carbon Market (ICVCM) assessment for its Core Carbon Principles (CCPs), a concrete sign that credit quality standards for avoidance projects are maturing.
Defining and Standardizing Quality in the Voluntary Carbon Market
Carbon credits are intended to reduce, remove, or avoid emissions. They pay for an environmental service that must be delivered. Companies working to generate climate benefits through credit purchases must grapple with the differences and uncertainties of credit quality to ensure that the intended benefits are realized.
While high-quality credits exist for all types of projects, a rich understanding of the differences in methodologies, geographies, physics, and ecology is required to identify high-quality projects and understand varied certainty, durability, and risk terms. Identifying high-quality carbon projects demands extensive and project-specific diligence beyond carbon market certification.
Our own diligence work reveals that high-quality projects can be hard to find. Fewer than 10% of the carbon removal projects we assessed for our 2026 State of the Voluntary Carbon Market report met our quality criteria. This diligence work now has an additional, independent backstop. As of August 2026, the ICVCM has approved 44 methodologies across 13 programs, as eligible for its CCP label, including ACR, Gold Standard, and VCS. For buyers, considering projects that are CCP-eligible should be used as a first filter—not a substitute for project-level diligence, but representing a legitimate floor.
While realized emissions impacts may be difficult to prove in some cases, it is important to remember that some projects provide additional co-benefits. REDD+ projects, for example, may have a positive impact on conservation and biodiversity, and cookstove projects may offer clear human health and social welfare benefits. However, these benefits should be assessed separately from carbon reduction, removal, or avoidance benefits.
Frequently Asked Questions
What's the difference between a carbon credit and a carbon offset?
A carbon credit represents one verified tonne of emissions reduced, removed, or avoided. A carbon offset describes how a buyer uses that credit, typically to counterbalance emissions it has not yet accounted for. The credit itself does not change type based on how it's claimed.
Which type of carbon credit—reduction, removal, or avoidance—is highest quality?
No single type is inherently highest quality. Each project, regardless of type, is verified against a defined baseline. Quality depends on how rigorously that specific baseline was set and how well the project meets other quality criteria. Removal credits from engineered sources have the most straightforward baseline (zero), and avoidance credits carry the most baseline uncertainty by design, but these are only one determinant of credit quality.
Do carbon removal credits automatically meet the ICVCM’s Core Carbon Principles?
No. The ICVCM assesses methodologies and programs, not individual projects. If a project uses a methodology that is eligible for the CCP label, this can be a useful floor but is not a guarantee of high quality.
How does SBTi's near-term removal mandate change which credits I should buy now?
SBTi's finalized Corporate Net-Zero Standard V2.0 doesn't require removal purchases until 2035, but it sets the ramp now (i.e., 1% of scope 1, scope 2, and scope 3 emissions in 2035, scaling to 100% by the net-zero year). This means the highest-durability removal supply that is scarcest and most in demand today is the same supply that many companies will need later. The SBTi guidelines are still changing, so buyers and project developers must track them closely.
Key Trends in the 2026 Voluntary Carbon Market
Key Takeaways
- What's happening: The voluntary carbon market (VCM) stalled in 2025, with carbon credit retirements falling 7% despite a 227% surge in corporate climate commitments.
- Why it matters: Over 80% of high-durability carbon removal capacity is at risk of not being realized without additional offtake.
- The implication: For corporate buyers with 2030 climate targets, early movers will define market standards and secure the supply they need, while those who wait risk volatility and constrained access to high-quality credits.
Why the Voluntary Carbon Market Needs Action Now
The voluntary carbon market stands at a crossroads. Credit retirements in 2025 fell far below the billion-tonne-scale projections from earlier in the decade. There is a widening gulf between climate ambition and market action.
The VCM transacts credits that avoid, reduce, or remove emissions. Carbon dioxide removal (CDR), the process of removing and durably storing atmospheric CO₂, remains a small but critical segment, accounting for 5% of credits retired. Limiting overshoot of 1.5°C requires a rapid scale-up of CDR.
However, most organizations with 2030 climate goals have yet to engage in CDR procurement. Without clear market signals today, CDR supply will falter. What's missing isn't capability or knowledge, but the commitment to act. Early movers will define the market in its early stages, while latecomers may face volatility and uncertain supply.
Our latest analysis reveals both troubling trends and clear pathways forward for CDR buyers ready to move from commitment to execution.
[cta]
Five Years of Stagnation: The VCM Falls Short of Projections
For five consecutive years, muted growth and persistent oversupply of poor-quality credits have defined the market. In 2025, credit retirements—a proxy for spot-market demand—reached 157 million metric tonnes (Mt), down 7% from 2024.
This incremental growth is far below what market analysts anticipated earlier in the decade, when several projections expected demand to exceed 1 billion tonnes by 2030.
VCM Credit Trends: Concentrated in Avoidance and Reduction
The VCM has historically been concentrated in avoidance and reduction carbon projects, largely dominated by REDD+, renewable energy, and cookstove credits. 2025 marks the first year a new credit type has dominated, though: projects that reduce emissions of superpollutants now make up roughly 20% of all credits issued in the VCM. Superpollutant issuances increased by about 180% between 2020 and 2025, while retirements grew by roughly 150%.
CDR Remains a Small but Critical VCM Segment
In 2025, CDR credits accounted for only 5% of 2025 retirements, but have a more active forward offtake market—where buyers commit today to purchase credits that will be delivered in the future, providing crucial early-stage financing for projects.
Within the CDR category, high-quality credits are still hard to find. Applying our Criteria for High-Quality Carbon Dioxide Removal, we find that less than 10% of the CDR projects we review meet our high-quality threshold with minimal reservations.
Nature-Based CDR Dominates the Spot Market
Of the all CDR credits issued in the VCM in 2025, 95% originated from nature-based CDR pathways, while 5% represented high-durability CDR pathways such as biochar or bioenergy with carbon capture and storage (BECCS). This distribution reflects the mature role that nature-based CDR projects continue to play in the market, alongside the early stage of durable CDR deployment.
Within nature-based credits, supply and demand dynamics differed significantly between afforestation, reforestation, and revegetation (ARR) and improved forest management (IFM).
- For ARR credits, issuances and retirements have tracked closely at a roughly 1:1 ratio, with issuances remaining flat at around 7–8 Mt annually over the past four years, leaving little inventory available for spot purchasing.
- IFM credits, by contrast, have grown 2.5-fold since 2023, making them one of the largest sources of growth within nature-based credits, though high-quality CDR credits from IFM are in much lower supply.
For buyers, this means ARR credits are increasingly difficult to source on the spot market, while IFM credits are more readily available—though careful diligence is needed to identify high-quality projects.
Nature-based offtakes and commitments have expanded in recent years, with more than 90 Mt of future delivery now contracted or committed. The vast majority of these commitments are concentrated in ARR projects, highlighting both the supply constraints facing ARR today and buyers' foresight in securing the supply they will need in the near future.
High-Durability CDR Is Almost Entirely Forward-Looking
The spot market for high-durability CDR credits represents only 0.3% of activity in the VCM, but important dynamics are beginning to emerge as more high-durability CDR technologies reach the market.
From 2021 to 2025, roughly 80% of high-durability issuances and retirements came from biochar and geologic storage. However, the emergence of large-scale geologic CDR projects is beginning to shift the balance, with individual projects capable of delivering hundreds of thousands of tonnes annually. Early-stage methodologies such as enhanced rock weathering (ERW) and ocean alkalinity enhancement (OAE) issued their first credits in 2025, totaling roughly 12,000 tonnes.
While the spot market for high-durability CDR is growing and diversifying, forward offtake agreements continue to define the landscape. The ratio of high-durability spot retirements to volumes committed through forward offtake is 1:70—meaning for every tonne retired today, 70 tonnes have been committed for future delivery.
Forward Offtake Commitments Are Rising Across CDR Pathways
To date, forward offtake agreements, advanced market commitments (AMC), and large contracted deals with intermediaries cover more than 40 Mt of high-durability CDR, in addition to over 90 Mt of nature-based CDR. These cumulative volumes highlight the increasingly central role of forward purchasing in shaping future supply, particularly for capital-intensive, high-durability pathways.
However, the success of forward offtake strategies depends critically on careful due diligence. Without a rigorous assessment of technological readiness, project viability, and delivery risks, forward commitments risk financing projects that fail to deliver, undermining both individual investments and broader market confidence.
Market Concentration of Forward Offtake Remains High
A small group of companies continues to drive the majority of forward offtake activity. In 2025, Microsoft remained the clear market leader, accounting for roughly 60% of contracted nature-based CDR offtakes and more than 80% of high-durability offtakes with a named buyer announced to date. Other active buyers—including Google, JPMorgan Chase, Equinor, and Amazon—have expanded their commitments, but overall market concentration remains high.
This concentration reveals both opportunity and risk: while anchor buyers are proving the market model works, broader participation is needed to unlock the full scale of CDR deployment required.
Growing Gap Between Climate Ambition and Market Action
Corporate climate targets anchor most current VCM activity: All of the top-10 buyers in the market today participate based on either self-declared commitments or net-zero commitments aligned with the Science Based Targets initiative (SBTi).
Demand forecasts based on these future commitments project that total CDR demand could reach 46-110 Mt by 2030, a ~6-14x growth from today. Yet, how companies decide to implement their targets will ultimately affect the composition of CDR demand within the VCM.
Rather than relying solely on public commitments, we analyzed the behavior of companies that are actively purchasing CDR today. Should today's top buyers follow through on their stated CDR commitments, CDR demand could reach a minimum of 28 Mt by 2030, with 6.5 Mt of demand for high-durability CDR.
However, the discrepancy between observed demand and target-led scenarios shows a persistent gap between what companies say and what they do. SBTi reported a 227% surge in companies setting both near-term and net-zero targets in the 18 months leading up to mid-2025, while carbon credit retirements in the VCM fell 7% in 2025.
Shifting from intention to execution will ultimately determine whether the VCM evolves into a durable, functioning marketplace or stalls short of the scale required for credible, net-zero pathways.
Rising Trends of Greenhushing and Anonymity Obscure CDR Demand
In the broader VCM, 55% of tonnes retired on the spot market over the past three years have been anonymous, and that fraction has been increasing. A similar trend is true of high-durability CDR: nearly 40% of all offtake transactions made in 2025 did not disclose the participating buyer. This buyer behaviour could reflect the often-discussed greenhushing phenomenon.
When anonymous actors dominate, it becomes harder to track demand signals, verify corporate progress, and establish clear integrity benchmarks. This opacity creates systemic risk for the entire market.
Market Growth Tipping Points on the Horizon
Several pivotal events on the horizon could mitigate risk and unlock project development, tipping buyers into action after half a decade of limited market growth:
- Voluntary demand: SBTi's Corporate Net Zero Standard V2.0, published in June 2026, confirms credits still can’t count toward scope 1-3 targets, but introduces a voluntary recognition program starting in 2027 and mandatory removal purchasing for large companies from 2035, starting at 1% of footprint.
- Compliance demand: The UK's Emissions Trading Scheme (ETS) Authority has already committed to integrating carbon removals into the UK ETS by 2028 via an auction model. This is the first confirmed large-scale compliance pathway for CDR credits, though credit-type eligibility is still being worked out.
- Regulatory support: Publication of Article 6.4 methodologies under the Paris Agreement and loosening of CORSIA credit supply bottlenecks could expand eligible supply and boost buyer confidence.
These tipping points in policies, standards, and market structures are advancing with clear timelines, creating conditions to move CDR procurement from hesitation to activation.
CDR Supply Faces Critical Challenges
While buyer inaction poses one threat to market growth, the supply side faces its own critical challenges.
30%–220% More Investment Is Needed in Nature-Based CDR Supply
Nature-based CDR would require a 30%–220% increase in finance to support current corporate targets. Relae (formerly Carbon Direct) has identified US$18 billion in publicly committed funds for nature-based CDR announced from 2018 to 2025. If deployed immediately to generate high-quality CDR, this level of funding could translate into up to 32 Mt per year by 2030 and 290 Mt cumulatively through 2040.
This is sufficient to meet the conservative 28 Mt demand floor from today's active buyers—but falls well short of what would be needed if even a fraction of companies with 2030 targets begin executing on their stated commitments.
80% of High-Durability CDR Projects Are at Risk
The situation is more acute for high-durability CDR. We estimate that over 80% of the total 2030 credit supply pipeline is at risk, due to insufficient project offtake and financing agreements.
Without increased offtake and financing support, we expect that the landscape for capital-intensive, high-durability CDR may consolidate
CDR Buyers Will Determine Which Projects Get Built
The supply-side ecosystem features a sufficient number of high-quality CDR suppliers with the potential to scale. These suppliers face purchasing behavior insufficient to meet buyers' own stated climate goals. In this environment, every CDR procurement decision matters. Companies that delay procurement risk missing their own climate targets while also ceding competitive advantage to early movers who secure the limited supply of high-quality credits.
Five Actions to Strengthen the CDR Market
Buyers and investors can play a critical role in reducing project risk and strengthening the CDR market. Our full report details five essential actions:
- Use purchasing power wisely
- Prioritize project diligence
- Construct bankable contracts
- Support market data transparency and CDR goals
- Undertake project assurance
Each action addresses specific market failures and, when implemented strategically, can significantly improve the likelihood that high-quality CDR projects reach operation and deliver credits as contracted.
With 2030 only four years away, the window for action is rapidly closing. Early movers will secure supply and define market standards, while those who wait risk entering a crowded market with limited access to high-quality credits and escalating prices.
[cta]
Frequently Asked Questions
Why did the voluntary carbon market stall in 2025 despite rising corporate climate commitments?
Retirements fell 7% even as SBTi reported a 227% surge in companies setting near-term and net-zero targets. The gap reflects that most companies with 2030 goals haven't yet moved from setting targets to actually procuring credits.
Is carbon dioxide removal a proven market today, or still emerging?
CDR remains a small segment—about 5% of 2025 retirements—but it has an unusually active forward market, with buyers committing today to volumes delivered years from now. High-durability pathways like biochar and geologic storage are still early-stage relative to nature-based credits.
How does the new SBTi Net-Zero Standard affect corporate carbon credit strategy?
Under the new SBTi Net-Zero Standard, credits still can't be counted toward scope 1, 2, or 3 targets. But it introduces a voluntary recognition program starting in 2027, and requires large companies to begin purchasing carbon removals from 2035, starting at 1% of their footprint.
What should CDR buyers prioritize given current market conditions?
Given how concentrated forward offtake activity is today, buyers should prioritize rigorous project diligence and bankable contract structures over simply committing volume—the 2026 State of the Voluntary Carbon Market report details five recommended actions in more depth.